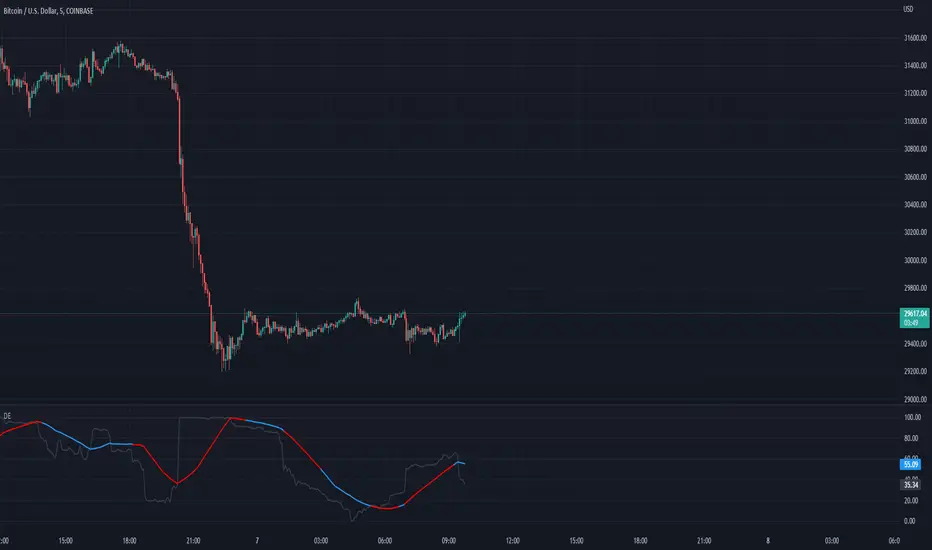
Directional ExpectancyThe Directional Expectancy tool is a volatility based indicator, It is a Directional Correlation to the Volatility given by the Historical Volatility Percentile.
We calculate this correlation function then visually color plot it across a moving average of the HVP.
Use this tool to not only gauge the Historical Volatility that is present as well as the Directional Expectancy of the volatility and price!
Dynapro
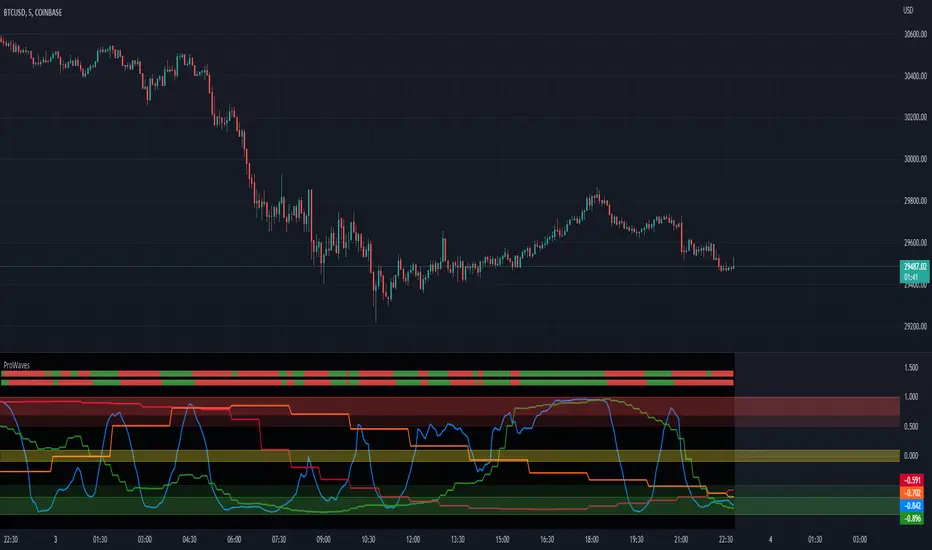
ProWaves - [Soldi]ProWaves
Introducing the latest and greatest tool in the DynaPro Trading Tools! ProWaves is a multi timeframe precision trend tool to help traders identify the waves of the market and trade the convergence, exhaustion points, continuation points of multiple timeframes.
By default you will have a 15m, 1h and 2h Wave on your indicator - this is completely customizable by the user! You can choose up to 3 higher timeframes to display the underlaying wave trend.
How Do I Enter Trades?
To bring ProWaves into a full trading system someone could easily use we have to make a trade trigger system for potential entries - an original and unique Trend Bar system to easily signal a trader that there is an entry present. These trend bars use 2 sensitive weighted moving averages based off the HL2 of the candle, we offset them to create a ribbon like effect to help eliminate any false signals
Include this in your own trading strategy or compile it with DynaPro's other institutional caliber tools!
To use ProWaves effectively you will want to understand wave theory first
This indicator is based off the idea of Elliot wave and fractal cycles of the market, to really understand what this indicator is reading you will need to understand what Elliot Wave is along with fractal cycles in the markets.
What Are The Waves Based On
The waves are primarily a Correlation function to make an oscillated value of "trend", by doing so and measuring this across multiple timeframes we are able to gain a sense of clarity on the tops and bottoms of the markets as well as the trends that take place in between!
NOTE
When the Waves are above/below - 0.5/-0.5 then the wave is in an area of significance for either a reversal or to influence a trend - couple this with the precision of the Trend Bars system then you have a great trading system!
SIVE 2.0 - [Soldi]SIVE 2.0 IS FINALLY HERE, after the long awaited update we are finally able to bring to you SIVE 2.0!
SIVE 1.0 (Systematic Institutional Volatility Expansion) brought a whole new approach to the algorithm and retail trading game on TradingView. Never before have you had access to a quantitative institutional approach like this, after years in development and testing we finally brought SIVE 1.0 to market. With very very high demand, support and so much positive feedback we knew that what we've created really hit the mark for so many traders!
What is SIVE?
SIVE as stated above stands for, Systematic Institutional Volatility Expansion. What this means is we have a highly effective system that reads what institutional algorithms are proven to be looking at. While only providing alerts during periods where Volatility is Expanding
We don't shy away from volatility here, that is where the bread and butter lays. volatility is a double edged sword that not many people know how to effectively use to their advantage. Simply put, because they are told in their retail trading that volatility is risky, and that you should stay away from volatile products. I say embrace it with the right tools.
What Has Changed?
At the core, SIVE 2.0 brings more efficient calculations to the volatility modelling as well as the triggering of trades!
Trend Scalper - This is a sub-set strategy we have included, what it measures is 'Super Trend' with a deviation of 7 and the MTI ribbon crosses. This is to be used as a way to scalp and trade the momentum of the market. I am aware that another brand/community has put this out as a paid feature to their algorithm. Since they didn't want to credit me for my contribution I decided to release it for free and also add it here. This is listed in my scripts as a free to use access.
Volatility Confluence - We have now also added a feature where you can choose how many volatility models you want to be aligned before SIVE calls an alert. There are a total of 9 models we have included, example. You choose 3 'Volatility Confluence', this means that SIVE will only call alerts when 3 of those 9 models agree. This can be very effective if you want to have more refined volatility trades, giving you more confidence that an expansion will take place.
Low Volatility Flashes - You now have the ability to control the low volatility back ground flash feature that was included with SIVE 1.0
Volatility Candles - You can now plot the volatility strength as candles! before you weren't able to see the actual underlaying volatility . Till now, turn this on and watch it turn you candles into a colourful array of the rainbow based on the volatility . Note - You will either need to *bring to front* or turn off the price data to see it
Take Profit System (beta) - Before on SIVE 1.0 and in the beta versions we had an early version of the money management. Where based on the ATR on the trade it would give you a suggested Stop Loss and Take Profit area. Now we have completely over hauled that and re calculated how we approach this also giving the trader 2 different options to choose from for suggested Stop Loss placement. We also included a 'Dynamic Take Profit' system that's based on the MTI to give you momentum based Take Profits. These are still in beta stages so any feedback is much appreciated and as always will be reviewed and considered.
RSI bands - Reverse plot the RSI onto your chart. Plot the over sold and over Bought static lines to price!
Moving Average Filter ( Multi Time Frame ) - Introducing a way further refine the trade alerts and give more power into the traders hands. We know that many many traders like to only trade if example. price is Greater Than 200 EMA. We wanted to give traders a choice to refine the trade alerts based on this information. You can choose between 'Price vs MA' - which is explained in that example just provided. The other option is 'MA vs MA', this allows you to filter out trades based on if a Moving Average of your choice(MA1) is Greater than MA2. With all this we also provided Multi Time Frame accessibility to just further give the trader more control and range. You also have the ability to just plot the Moving averages and not filter the trades at all!
Kill Zone / Time Sessions - Including another free script that has already been posted to my account. This script is also unique as it plots the specified time zones 24 hours in advanced . If you trade example. 'New York Session', Instead of using an indicator that only shows you after the fact it happens. You can now plot that time zone 24 Hours in advanced and watch how price trades to it and interacts with it. It has 4 completely customizable Time Zone slots. Please adjust to your time zone and desired sessions.
Here are some examples of SIVE working across various charts with the different features
USDCAD - 1 Hour
Take Profit System
XAUUSD ( Gold ) - 15 min
Trend Scalper System
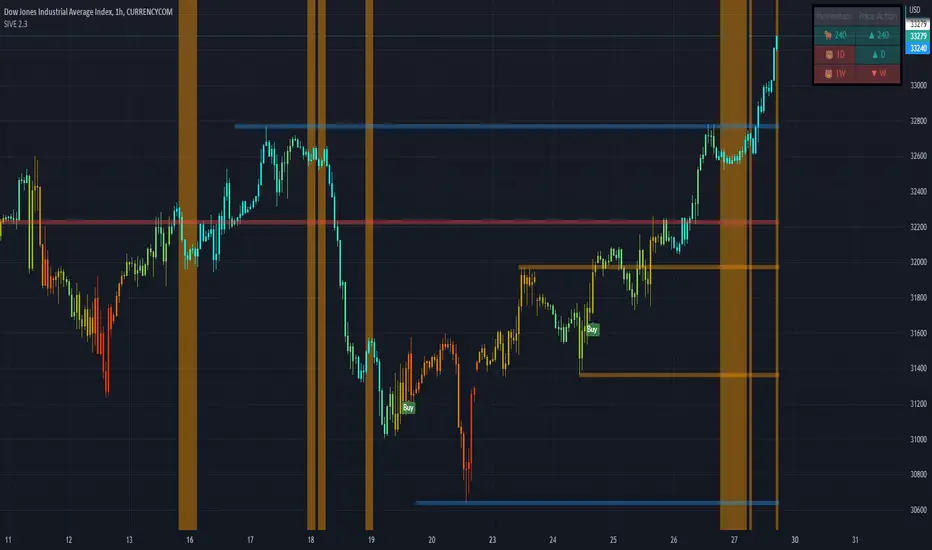
US30(Dow Jones) - 15 min
Volatility Candles + Low Volatility Flashes
BTCUSD ( Bitcoin ) - 1 hour
Support / Resistance + Dashboard + Multi Time Frame MTI
USOIL (WTI Crude Oil ) - 5m
Kill Zones + Moving Average Filter
APPL( Apple ) - 1 hour
Moving Average Filter
SIVE 1.0 [Soldi]SIVE 1.0
What is SIVE?
SIVE stands for Systematic Institutional Volatility Expansion, SIVE uses a variety of different statistical indicators to gauge volatility along with trend correlation and other measures to filter and define a price move. This system was originally set out to redefine what a 'Trend Following System' could be; we achieved more than just that. We had created what is considered to be one of the first retail quantitative trading system, that incorporates trend following mechanics as well as trend reversal techniques. All while being aligned/correlated to trend and volatility . Something truly powerful to put into the hands of the every day trader, demystifying what quant trading can be while easily presenting it in a way where even your mom could learn how to use the system without being overwhelmed.
What makes this different from any other trading system?
SIVE raises the bar on what traditional indicators and trading systems can do, traditionally you have lagging indicators that only tell you what happened in the past with no correlation to the market or what can happen in the future. Really providing little to no statistical value, yet completely idolized by the retail world. Where SIVE exceeds these systems is all in the math and the application of those formulas to the time/price, finding the synchronicities to exploit for profits as well as exploiting the high probabilities of non-random events. How we do it? well that's in the secret crabby patty formula.
Where we are now, and where we plan to go
SIVE as it stands right now is the very first iteration of the retail quantitative trading system, it is performing exceptionally well but we aren't take that as our standard as we want to always raise the bar. as it stands, we are already working on the updates to come that will dwarf anything we've done in the past.
Our goal with SIVE is to be able to provide an easy to learn and easy to profit trading system that will provide the retail public with a trust worthy system to use. In the future our updates will carry heavier weight on key aspects like Risk to Reward, Win rates and capturing those big parabolic movements that everyone dreams of. Far fetched? for the traditional indicator junkies, but for a Quant it is just a matter of time.
What does it perform best on?
Simply put, yes... We set out to create this to be used for any trading instrument and any timeframe. Intraday timeframes have been shown to give more trades and typically higher reward trades as your able to execute with a high degree of accuracy 1:2 is very modest and can easily be achieved but we have also seen so so many trades run higher than 1:10 and even 1:20!! but as you already may know the market doesn't always give those favorable conditions to trade that high of a Risk to Reward all the time.
Stocks, Crypto, Forex, Metals, Energies, Indices, etc. are all tradeable with SIVE

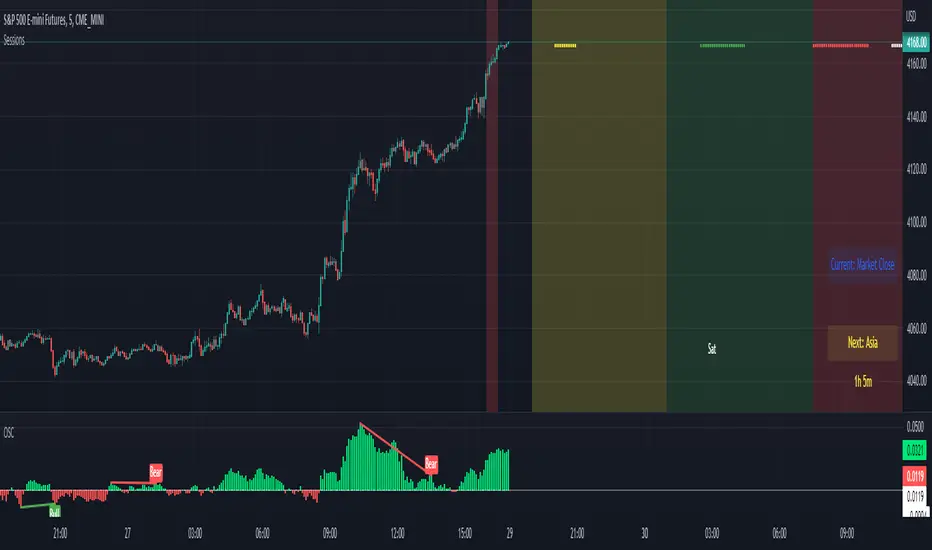
Directional Volatility Index (DVI) - SoldiDirectional Volatility Oscillator
What the DVI does is it measure 9 different volatility models based on their directional correlation and then scores that. While it calculated the volatility it also measures and scores 5 different indicators to find the likeliness of a retail position. That way the Oscillated value being plotted is that of an accurate modelled nature. This indicator aims to measure and score the directional volatility across the 9 different volatility models and then plots it as an oscillator. Included in that calculation is a measure of the likeliness of a retail traders position.
This can be used to gauge liquidity sweeps in a strategy like Smart Money Concepts. As, all the retail money is long - expect a sweep of the lows or equal highs. etc. more so you can also use this as a market meter like RSI , if the market is Over bought or Over sold, the DVI value will be over 100 or under -100 - or this tool can be used to gauge the underlaying trend!
Examples
Here is an example on BTCUSD - 1d
- as you can see there is significant trend when the DVI is crossed
Here is that same example on BTCUSD - 1d zoomed into 4h
- as you can see there is significant trend when the DVI is crossed

Log OscillatorThe Log Oscillator measures the mean of logarithmic returns, given this data you can assume market expectancy in returns of the mean. When seeing positive Means you can assume positive returns will follow positive returns if positive autocorrelation is present. Vice versa for the other event of negative returns.
How you can effectively use this indicator and oscillator is by looking at a higher time frame and if the oscillator is positive, you can go to a lower timeframe and try to trade in that direction of the market as the expected returns are positive in nature.
You can also spot trend divergences very well as the trend continues but the returns are dropping that means the returns are mean reverting and can have a potential to flip to the other side
Advanced Time SessionsIntroducing Advanced Time Sessions , this tool uses a 24 hour look ahead plot - this is to help inform the trader about not just the current session but the next one coming up. Now traders, at a quick glance can see what session they trading in, how much time till the sessions close, what is the next session, and when the daily market close is! Main features of the tool include daily dividers, day labels and kill zone highlighters.
This tool is a day traders dream to have this subtle and stylish data at a glance letting you focus on more strategically placing your trades based around time and price!
EURUSD - 15m
EURUSD - 5m
Smart Money Concepts used with Advanced Time Sessions
