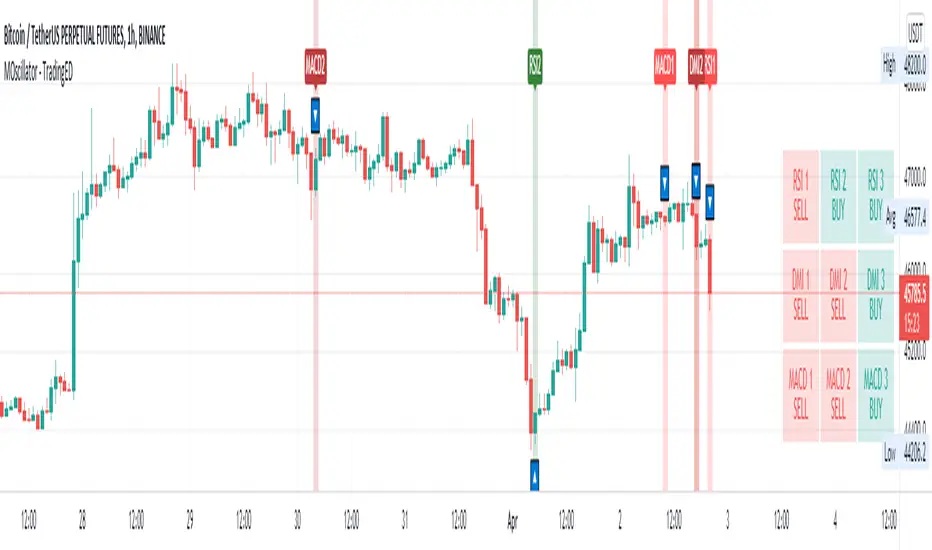
Multiple Oscillator Crossing - TradingEDThis case study is based on different previous studies: ADX Triple , MACD Triple & RSI Triple , with three different counts to compare different oscillations of each indicator. Actually, this indicator is complementary to those previously mentioned . The use of this indicator is restricted to private use, and it can be used only by invitation. Different functionalities have been added to the original codes, such as alerts and signals that seek to make trading much easier to interpret by any type of trading operator of any experience level , from beginner to intermediate and advanced .
Key components of the original ADX indicator:
• The DIRECTIONAL MOVEMENT INDEX (DMI) is a technical indicator that measures both the strength and direction of a price movement and is intended to reduce false signals.
• The DMI uses two standard indicators, one negative ( -DI ) and one positive ( +DI ), in conjunction with a third, the AVERAGE DIRECTIONAL INDEX ( ADX ), which is non-directional but shows momentum.
• The larger the spread between the two primary lines, the stronger the price trend. If +DI is way above -DI the price trend is strongly up. If -DI is way above +DI then the price trend is strongly down.
• ADX measures the strength of the trend, either up or down; a reading above 20 indicates a strong trend.
ADX is plotted as a single line with values ranging from a low of zero to a high of 100. ADX is non-directional; it registers trend strength whether price is trending up or down. The indicator is usually plotted in the same window as the two DMI lines, from which ADX is derived. When +DI is above -DI, there is more upward pressure than downward pressure in the price. Conversely, if -DI is above +DI, then there is more downward pressure on the price. This indicator may help traders assess the trend direction. Crossovers between the lines are also sometimes used as trade signals to buy or sell, theay are the main trade signals. A long trade is taken when the +DI crosses above the -DI and an uptrend could be underway. Meanwhile, a sell signal occurs when the +DI instead crosses below the -DI.
Key components of the original RSI indicator:
● The Relative Strength Index ( RSI ) is a popular momentum oscillator developed in 1978.
● The RSI provides technical traders signals about bullish and bearish price momentum, and it is often plotted beneath the graph of an asset's price.
● An asset is usually considered overbought when the RSI is above 70% and oversold when it is below 30%.
It is a momentum indicator used in technical analysis that measures the magnitude of recent price changes to assess overbought or oversold conditions in the price of an asset. The RSI is displayed as an oscillator (a line chart moving between two extremes) and can read from 0 to 100. Overbought does not necessarily mean that the price will reverse lower, just as oversold does not mean that the price will reverse higher. Rather, the overbought and oversold conditions simply alert traders that the RSI is near the extremes of its recent readings.
Key components of the original MACD indicator:
● The Moving Average Convergence Divergence ( MACD ) is calculated by subtracting a long period (26) Exponential Moving Average ( EMA ) from a short (12) period EMA .
● MACD triggers technical signals when it crosses above (to buy) or below (to sell) its signal line.
● The speed of crossovers is also taken as a signal of a market is overbought or oversold.
● MACD helps traders to understand whether the bullish or bearish movement in the price is strengthening or weakening.
It is a momentum indicator that follows the trend and shows the relationship between two moving averages of the price of a security. It can function as a trigger for buy and sell signals, when you cross above (to buy) or below (to sell) your signal line. It helps to understand if the movement is bullish or bearish , if it is getting stronger or weaker. The further the MACD is above or below its baseline, it indicates that the distance between the two EMAs will be growing, often shown with a histogram that graphically represents the distance between the MACD and its signal line, and It is used to identify when the bullish or bearish momentum.
Main functions of this modified indicator:
1) The SOURCE for the counts can be determined by the trader (close, open, etc).
2) In some cases, you can select the type of MOVING AVERAGE , among many available options ( SMA , EMA , DEMA , HMA , etc.)
3) The MEASURE can be based on a CANDLES count if you are trading OHLC Charts from 1D onwards , or if your trading is intraday, you can also select counts by MINUTES , HOURS or DAYS , depending on your trading style.
4) LENGTH , by default it will be loaded as in the STRATEGY , but considering the previous point, you can modify it according to your convenience.
5) You have the option to hide or show a LABEL at the top of the chart, with respect to the signals: BULLISH green, BEARISH red. *
6) You have the option to hide or show INDICATORS or SIGNALS based on EACH OSCILLATION .
Main performance functions of this modified indicator:
I) In the case of the PERFORMANCE that appears at the right of the chart, you have the option to adjust the WIDTH of each box.
II) The TEXT of the PERFORMANCE is not modifiable, but you can customize the default color. *
III) The BACKGROUND of the PERFORMANCE , you can customize the default color. *
IV) You have the option to hide or show a PERFORMANCE that appears at the right of the chart.
Main functions to customize the style of this indicator:
a) For any type of SIGNAL , it is painted as a VERTICAL LINE in the graph, you can change the color that comes by default. *
b) In the case of the LABELS that appear at the top, the text is not modifiable, but you can customize both the type of label and change the default color. *
c) When you have a SHORT SIGNAL or a LONG SIGNAL , you can change the EMOTICON that comes by default. **
* By default, they are marked as red for downtrends and green for uptrends.
** By default, they are marked with an emoticon indicating the possible direction of the price, down if it is bearish or up if it is bullish .
Divergência
MACD hist divergence strategy with switch v2
sum Macd hist to compare their strength,the DIAMOND means total strength , if the strength divergence, the trend may change
Macd 面積比較力度, 鑽石代表總力度, 力度背離即可能發生反轉
for the bullish market, I will suggest you to close the sw of buying energy divergence ex:btc
對於大牛市會建議您將買點能量背離關掉ex 比特幣
this strategy only have long order by now
目前此策略只支援做多
按鈕簡介
switch info
1.macd 面積背離時價格是否有背離的開關
1.A divergence switch btw price and MACD hist
2.macd 快線下穿0軸賣出的選項
2. Once MACD fast_line crossunder 0 stop loss switch
3.the setting logic and method is like this
設定如下
A1. 大牛股 for bullish market
B1. 高勝率低利潤 for high winning rate but lower profit
C1 高頻適合小級別 for high frq trading, useful in low period
D1 極小級別 for extremeness low period

Crypto Scanner [MensaTrader]Market Scanner
By default set up to scan 7 Crypto Currencies on 3 different Time frames
Default assets are from Binance listing, but can be changed in settings.
First timeframe is set to Daily, (all timeframes can be changed in the settings), The RSI value for the Daily resolution is printed. The current conditions need it to be between the value of 40 and 50, If this condition is met then the box will light are green, if they are not they will stay red.
Second timeframe is set to 4 Hour, RSI for this timeframe and assset will also be printed here, the conditions for it are different though. Currently set up so if the RSI value is lower than 40 the box will light up green. This 40 value can be changed in the settings aswell.
Third timeframe is set to 1 Hour, This timeframe is looking for divergences. If a Divergence is found, the box will light up green and say "Bullish Divergence", This will stay green until either of the 2 invalidation conditions are met.
One condition is (For Bullish Divergence) to be cleared, If the recent Low where the divergence was formed gets taken out. Then the divergence sign will dissappear
Second condition is if the RSI Value climbs above 55, Then once again the Divergence sign will dissappear.
Use this to help scan multiple assets at once and find RSI values which suit your trading set ups.
I have tried to make as many options adjustable as possible including the Size of the Scanner, all in the settings.

3GBH - MoneyMeter (Stablecoins RSI)This indicator tracks the Market Caps of
- USDT
- USDC
- DAI
The data is presented on the RSI.
The intent of this indicator is to help determine whether money is flowing into the market or not.
If the major stablecoins are green, money is entering the market.
The opposite applies, if red, money is leaving the market.
This is another tool which may provide help to build confluence in your trading or analysis.
-----
Default length is set to 168 to see the momentum of the past 7 days on the 1-hour timeframe.

Martyv Auto Fib Retracement with Logarithmic SupportSimple & easy auto-fib levels. Took the out-of-the-box version provided by TradingView and added Logarithmic support and a nicer palette, and made the controls a bit nicer to use (in my opinion lol). Enjoy.

RSI Signals by HBRELATIVE STRENGTH INDEX (RSI)
This is a tool that is widely used
Especially for Overbought and Oversold systems, but I have made some changes in this indicator,
How to use it...!
I have set it as the default setting
- RSI Length: 7
- Overbought: 70
- Oversold: 30
What is unique about this tool?
we can see 3 conditions:
1) RSI Overbought / Oversold with Bullish Engulfing / Bearish Engulfing
2) RSI Overbought / Oversold with Hammer and Shooting Star
3) RSI Overbought / Oversold with 2 Bullish Bars / 2 Bearish Bars
4) RSI Overbought / Oversold with All Patterns at the same time
When the RSI reaches its Oversold line, the code will wait for Bullish Engulfing pattren , when oversold and Bullish engulfing matched, This indicator will generate a buy signal when the condition is met,
and same as for Bear market, When the RSI reaches its Overbought line, the code will wait for Bearish Engulfing pattren , This indicator will generate a sell/exit signal when the condition is met,
2nd condition is that a Hammer candle will be waited for when RSI touches the Overbought line, for Bullish Move
and Shooting Star candle will be waited for when RSI touches the Overbought line, for Bullish Move, for Bearish Move
3rd Condition is also the same as Condition 1 and Condition 2,
When the RSI reaches its Oversold line, the code will wait for 2 Bullish Bars , when oversold and 2 Bullish Bars matched then this indicator will generate a buy signal, and same as for Bear market,
When the RSI reaches its Overbought line, the code will wait for 2 Bearish Bars , when overbought and 2 Bearish Bars matched then this indicator will generate a Sell signal,
4th Condition is that we can use All Conditions at the same time,
- Bullish Engulfing / Bearish Engulfing
- Hammer and Shooting Star
- 2 Bullish Bars / 2 Bearish Bars

Tipsy EMA Tipsy EMA
v0.2a
Coded by vaidab.
A simple strategy to buy dips in an uptrend.
How to use:
- buy on trend when price retraces to the orange "buy" line and compound orders
- sell when price reaches red line (stop loss) or at 💰 (take profit)
Note that you can reverse trade on the 💰 sign for a short scalp / day trade.
Uptrend: green/red background. Danger zone: orange bg. No go zone: no bg.
Potential buys (in a clear trend): 55, 100, 200 EMA touches and
fibo retracements to .382 and .618.
Potential stop loss: when price breaks the 200 EMA (marked by a red line).
Exit signs: opposite trend divergences (RSI).
Take profit: EMA 55 crossing down EMA 100.
Use it in confluence with market structure. E.g. If 200 EMA ligns up with
past market structure, if there are whole numbers or if there's a monthly level.
Tested BTCUSDT D, 4H

Trend Power Index [Fournier-Eaton]Trend Power Index measures the power of a given trend relative to its past strength.
Increasing values indicate strengthening of an upward trend or weakening of a downward trend
Decreasing values indicate strengthening of a downward trend or weakening of an upward trend.
Crossing zero is a confirmation of trend initiation in the respective direction
Note: Parameters may be changed to account for low cycle times and high volatility
As always, please make any suggestions you might have or share problems or successes. Any feedback is helpful.

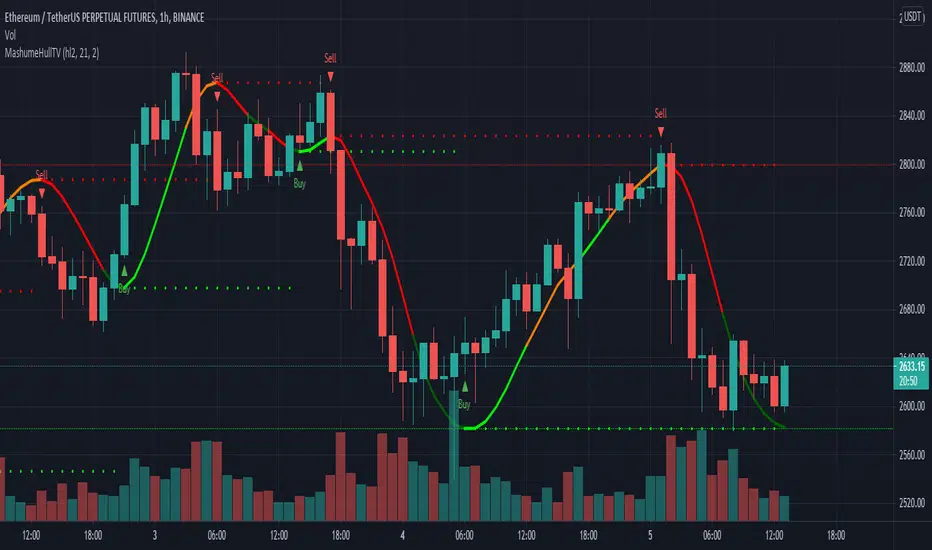
MashumeHullTV█ OVERVIEW
This plots the Hull Moving Average Turning Points and Concavity
with the addition of colored segments representing concavity and turning points: maxima, minima and inflection.
a fast way to determine the trend direction and possible reversals based on concavity of the trend
Dark Green: Concave Up but HMA decreasing. The 'mood' has changed and the declining trend of the HMA is slowing. Possible trend change to Uptrend soon
Light Green: Concave up and HMA increasing. Price is increasing, and since the curve is still concave up, it is accelerating upward. Uptrend
Orange: Concavity is now downward, and though price is still increasing, the rate has slowed, perhaps the mood has become less enthusiastic. Possible trend change to Downtrend soon
Red: Concave down and HMA decreasing. Downtrend
Buy signals generated when Hull turns from Dark Green -> Light Green
Sell signals generated when Hull turns from Orange -> Red
To best determine if this is a entry point or a trend reversal, it is recommended to use in conjunction with the QQEMoMoTV indicator
█ FEATURES
Calculations
Calculates the concavity of the Hull Moving Average comparing the Hull concavity of the current bar to the previous bar and displays the concavity in the form of 4 different colors.
Note: may cause repainting, so recommended to use with another indicator such as the QQEMoMoTV indicator to confirm signals.
Calculates divergence between the calculated HMA and the actual price and displays this in the Divergence Label.
Calculates the local minima, maxima and inflection points with the ability to display these as auto support/resistance lines.
Inputs
You can use the script's inputs to configure:
• Calculation Source (default HL2)
• HMA Length (default 21)
• Lookback (default 2)
• Whether to show Auto Support/Resist Lines
• Whether to show Buy/Sell Arrows
• Whether to show Divergence Label
• Whether to extend Local Auto Support/Resist Lines
Alerts
Buy Signal alert based on HMA crossing above MA_Min/Hull Support, when Hull turns from Dark Green -> Light Green, Bullish
Sell Signal alert based on HMA crossing below MA_Max/Hull Resistance, when Hull turns from Orange -> Red, Bearish
Experimental support for applying the indicator to higher time frames
eg. charting the hourly MashumeHull indicator on 15 min chart. See the commented code to access this feature
█ CREDITS
Original Author: Seth Urion (Mashume)
Feature upgrades and usage: Xiuying
Converted to Tradingview by: Machdragon
HTF Candles by DGThigher timeframe (multi timeframe) candles
a simple study introducing new pine function box.new

[Sidders] LTFDIV - Strategy version (beta)Strategy version of my previously released LTF divergence scalper. Currently being beta tested prior to full release as a premium indicator.
Description of the indicator: The indicator uses several trades of divergences and overbought/oversold levels (which can be defined) of several indicators on the 1 minute timeframe. Long signals are only given if the overall trend is bullish (determined by either moving averages or the Ichimoku system). Short signals are only given if the overall trend is bearish (determined yet again by either the moving averages or the Ichimoku system).
The strategy contains several additional filters that can be applied to sharpen the strategy and improve overall winrate and profitability. Additionally it contains a multitude of different ways of setting your stoplosses and setting your profit targets. I've also included many other customization options, such as time zones, trading periods and even the possibility to base the entire strategy on Ichimoku (either classic or crypto settings) instead of moving averages. The sky is the limit with regards to customization.
Lastly, but still a major feature: I've included a way to automate the strategy through the use of 3Comma bots. This takes away the need to sit behind your pc and trade the strategy yourself and automates everything after you've set it up properly.
Access to the strategy is currently limited. A full release will follow in the coming week. If you're interested, send me a message and I can more details (e.g. pricing). Cheers!


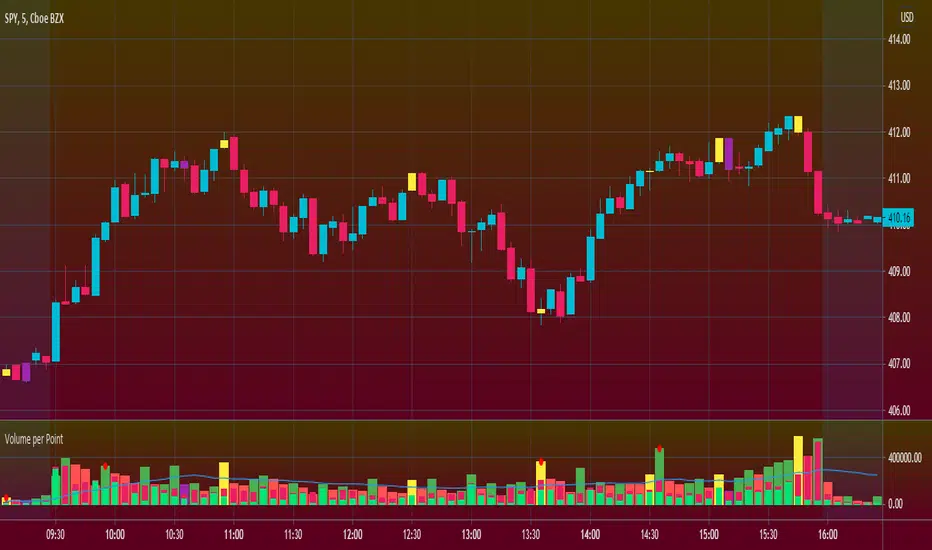
Volume per PointHello everyone <3
I present to you guys my new indicator Volume per Point (VP)
As suggested by the title, this script gives you the volume for every point.
Here's a run down on specific features:
SUBCHART COLUMNS:
The columns can be the following four colors:
Green - There was an increase in VP
Red - There was a decrease in VP
Yellow - There was divergence between volume and candle range
Purple - There are signs of exhaustion compared to the previous candlestick
SUBCHART HISTOGRAM:
The histogram can be the following two colors:
Lime - Buying volume
Red - Selling volume
I left you guys the ability to change the multiplier on the volume in settings just incase it's too small or too big compared to the VP. Decimals are allowed!
CANDLESTICK CHART:
The candlesticks can the following two colors:
Yellow - There was a divergence between volume and candle range
Purple - There are signs of exhaustion compared to the previous candlestick
FILTERS
In the settings, you're able to add the following two filters:
RSI Filters - RSI must be below or above the specified value for the divergence or exhaustion to trigger
Percent Filters - The candlestick range or volume must be higher or lower than the specified value depending whether it's divergence or exhaustion.
This is a very helpful tool if you're interesting in reading volume. It also facilitates finding market maker activity depending on the size of the VP. Sudden abnormal spikes in VP usually do signal something and that's up for you to figure out :)
Thank you for your time to read this
~July <3
OBV+ (Div/Trends) [Anan]Hello friends,
As you requested, this is my own version of OBVwith these features:
- Plot various types of moving averages ("SMA","Smooth SMA","SuperSmooth MA","EMA","DEMA","TEMA","Triangular MA","QEMA","RMA","Hull MA","KAMA","WMA","VWMA","CTI","LSMA","VIDYA","Blackman Filter","Adaptive RSI","Probability")
- Change the length of moving average
- Change the Source of OBV
- Bullish/Bearish Regular/Hidden divergences
- Trend lines on OBV

RSI Divergence (chiefwils0n)Greetings All,
This simple indicator is a stylistic modification of the original TradingView Divergence indicator. I've enhanced the following:
Styles
RSI will turn RED when overbought and CYAN when oversold. CYAN presents an LONG opportunity, while RED is where I look for SHORT entries.
Added background color to the the Oversold/Mid-Level and Overbought/Mid-Level. The idea is to go LONG when RSI is in the GREEN channel, and consider closing your position when RSI is the RED channel. Or, SHORT in the RED, and close your position in the GREEN.
Hidden Divergences are styled with muted colors. Maroon is Hidden Bearish and Dark Green is Hidden Bullish.
Regular Divergences have brighter labels with Red (Bearish) and Lime (Bullish). My logic is to bring attention to these divergences, since they are stronger than hidden divergences.
Alerts:
I also added the following alerts:
Bullish Divergence
Hidden Bullish Divergence
Bearish Divergence
Hidden Bearish Divergence
RSI Overbought
RSI Oversold'
The alerts really distinguish this script for me. I hope you enjoy.
Happy Trading!
Divergence of Stocks Above MA50 v.s. US-Stock MarketEnglish:
This indicator has been developed as an early warning tool to estimate the probability of correction in the US stock market. It works best in the daily chart.
Function:
1.) "Index-line"
The underlying stock index is converted to a scale between 0% and 100% based on its 52-week highs and lows. Where 100% is closing price at 52-week high and 0% is closing price at 52-week low.
2nd) "Stocks Above MA50".
For each major stock index, there is an index that determines the percentage of stocks above its 50 moving average. For example, for the S&P 500, this is the S5FI.
3) "Divergence
In an efficient market, both lines (index and number of stocks above the 50 MA) would run more or less in sync. A new high in the index would also mean a new high in the stocks trading above the 50 moving average. Often, however, a correction in the index is announced when the number of stocks trading above their 50 MA do not make a new, or even a lower, high while the underlying index marks a new high. The divergence signal measures this divergence of the indices. The higher the bar, the more pronounced the divergence.
How to read the indicator?
If a divergence occurs, then the stops should be tightened. As with any indicator, false signals can occur because a divergence does not automatically lead to a correction. The higher the divergence is indicated, the higher the probability. The strength of a correction cannot be predicted with the indicator.
For which symbols does the indicator work?
The indicator works exclusively for the following symbols:
S&P500: SPX, SPY, ES1!, US500 Index above MA50: S5FI
Russel2000: IWM, US2000, RTY1!, RUT, IWO Index above MA50: R2FI
NASDAQ100: NDX, NAS100, NQ1!, US100, QQQ Index above MA50: NDFI
NASDAQ: IXIC, ONEQ, QCN1!, NDAQ Index above MA50: NCFI
NYSE: XAX, NYA Index above MA50: MMFI
DowJones100: DJX, DJI, DIA, MYM1!, YM1! Index above MA50: DIFI
DowJonesComp: DOW, IYY Index above MA50: DCFI
Deutsch:
Dieser Indikator ist als Frühwarninstrument zur Einschätzung der Korrekturwahrscheinlichkeit im US-Aktienmarkt entwickelt worden. Er funktioniert am besten im Tages-Chart.
Funktion:
1.) „Index-line“
Der zugrunde liegende Aktienindex wird bezogen auf seine 52Wochen Hochs und Tiefs in eine Skala zwischen 0% und 100% umgerechnet. Dabei sind 100% Schlusskurs auf 52-Wochen Hoch und 0% Schlusskurs auf 52-Wochen Tief.
2.) „Stocks Above MA50“
Zu jedem Hauptaktienindex gibt es einen Index, der den Prozentwert der Aktien über Ihrem 50 gleitenden Durchschnitt ermittelt. Beim S&P 500 ist das z.B. der S5FI.
3.) „Divergence“
In einem effizienten Markt würden beide Linien (Index und Anzahl Aktien über dem 50 MA) mehr oder weniger synchron laufen. Ein neues Hoch im Index würde auch ein neues Hoch bei den Aktien, die über dem 50 gleitenden Durchschnitt notieren, bedeuten. Oft jedoch kündigt sich eine Korrektur im Index an, wenn die Anzahl der Aktien, die über ihrem 50 MA notieren kein neues, oder sogar ein niedrigeres Hoch machen, während der zu Grunde liegende Index ein neues Hoch markiert. Das Divergenz-Signal misst diese auseinanderlaufen der Indices. Je höher der Balken, umso stärker ist die Divergenz ausgeprägt.
Wie ist der Indikator zu lesen?
Wenn eine Divergenz auftritt, dann sollten die Stopps enger herangezogen werden. Es kann wie bei jedem Indikator zu Fehlsignalen kommen, da eine Divergenz nicht automatisch zu einer Korrektur führen muss. Die Wahrscheinlichkeit ist um so höher, je höher die Divergenz angezeigt wird. Die Stärke einer Korrektur kann mit dem Indikator nicht prognostiziert werden.
Für welche Symbole funktioniert der Indikator?
Der Indikator funktioniert ausschließlich für folgende Symbole:
S&P500: SPX, SPY, ES1!, US500 Index über MA50: S5FI
Russel2000: IWM, US2000, RTY1!, RUT, IWO Index über MA50: R2FI
NASDAQ100: NDX, NAS100, NQ1!, US100, QQQ Index über MA50: NDFI
NASDAQ: IXIC, ONEQ, QCN1!, NDAQ Index über MA50: NCFI
NYSE: XAX, NYA Index über MA50: MMFI
DowJones100: DJX, DJI, DIA, MYM1!, YM1! Index über MA50: DIFI
DowJonesComp: DOW, IYY Index über MA50: DCFI

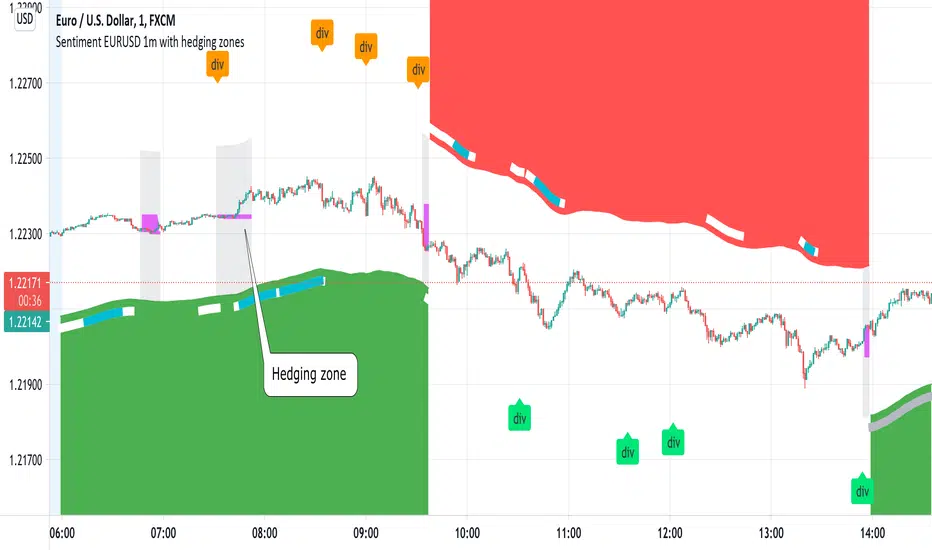
Sentiment EURUSD 1m with hedging zonesThis is a very specialised and optimized script, for 1m EURUSD traders - daytraders, scalpers.
1m trading is very difficult, but it can be also most profitable, if done right.
Why difficult? It is hard to detect market direction - usually when trend indicators reverse, that new trend is already over. One and the same indicator signal sometimes provides one outcome (for example reversal) and sometimes exactly the opposite (continuation). It requires deep understanding on WHEN to use which indicator and when to ignore signals. Set the parameters of your indicators to a very sensitive extent and they will keep changing direction back and forth - always being too late of course :) Set the parameters too losely, and you'll be late with entries 100% of times. Looking for universal trend-showing indicator? There is none...
This script is a result of 2 years of practical following EURUSD 1m market action. Looking at charts with MANUAL TRADER'S eyes. Analyzing all together: price action, indicators, zigzag, divergences, momentum, pivot points, support and resistance. On the one hand traders say only manual trading can be successful and on the other - to stick to one strategy and be automatic when applying to it. So this is it - automatic coding of market signals as if manual trader would do it. Forex is news-driven? Yes, it is. So if market sentiment changes because of some news happening, the script will quickly recognize it and suggest reversal.
Please note I'm not pretending to have a crystal ball. Nobody has. The goal of this script is not to predict where EURUSD market will be, but to correctly notice that is has reversed. Nothing else.
Sometimes the market will move towards reversal, but not cross the line yet - these are so-called HEDGING ZONES. Sometimes they turn out to be reversals and sometimes simply best places for dip entries. Ideally a trader should hedge there, because market could move either way. You might wanna apply apply knowledge of market fundamentals there or look into some micro-indicators. Anyway, it is good to realize where those zones are and this script shows them. In pink.
It is invite-only script. DM me for access.
Buy/Sell Volume confirmation for BO_Entry_ExitThis script helps to identify the volume strength basis EMA and various EMA multipliers, There are provisions provided to enable and disable when the volume is gaining momentum and the volume for a particular candle touches the Break Out criteria. Users will be able to modify the criteria for Volume strength and Volume break out Indication. It will also show the buyers & sellers strength of a volume bar which the uses will be able to enable and disable.
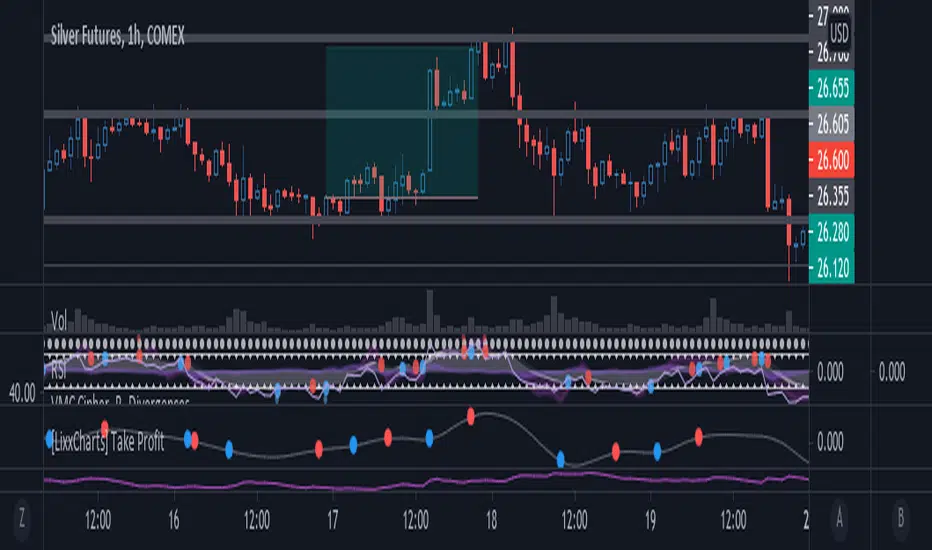
[Lixx] MESA(EMA/SMA) and ROC(ROC/MESA) Take Profit TriggersThis script uses the MESA EMA and SMA as well as the ROC/MESA cross to help find the take profit areas when trading divergences using market cipher or wavetrend. It is inspired by jordanfungs MESA indicator, however this one is different because it is not lagging in the signals.
Hope you enjoy it, and make sure to backtest any strategy before you use it.
RSI Div at Daily VWAP StDevMean Reversion indicator based on RSI Divergences at Overbought/Oversold conditions with Price above/below a Standard Deviation from Daily VWAP. Useful for intra-day trading.
Signal criteria:
1. RSI is at Overbought/Oversold
2. RSI Divergence present (not hidden)
3. RSI has not reached Neutral level (i.e. 50)
4. Price has crossed above/below a Standard Deviation from Daily VWAP
Config Options:
- RSI length (default:14)
- Divergence Lookback Period (default:14)
- RSI Oversold/Overbought tresholds (default: 70/30)
- RSI Reset Level (default: 55/45)
- Use VWAP Std Dev (default: yes)
- Standard Deviation from Daily VWAP (default: 1.51)
Use with discretion.

Divergence Indicator with alertsFirst time I've published a script so go easy!
All credit goes to @yatrader2 for the script, I have just made it easier to set alerts on it.
Enjoy!

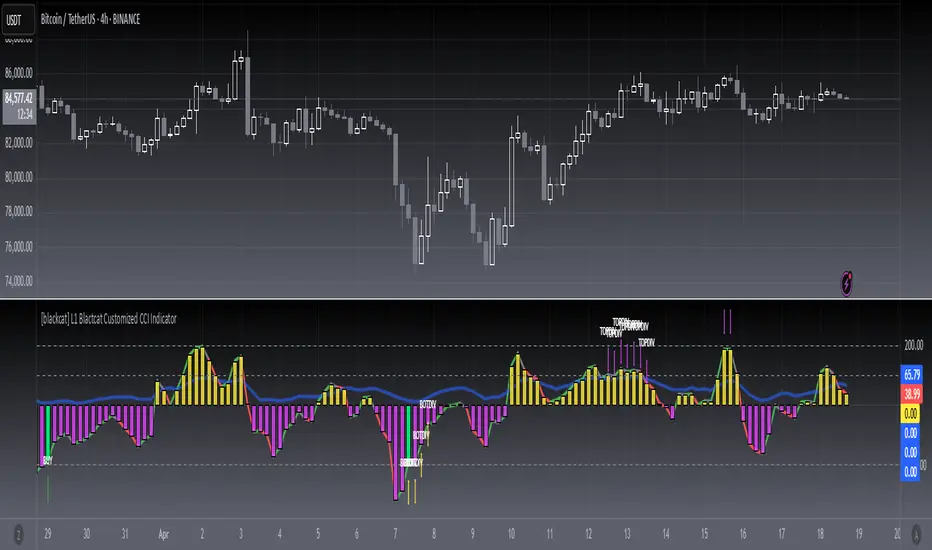
[blackcat] L1 Blackcat Customized CCI IndicatorLevel: 1
Background
This CCI indicator is blackcat customized version with enhanced features.
Function
This CCI use green line to indicate strong long trend with cci values > 0 and red line to indicate weak long trend with cci values <0. It also use yellow and fuchsia candles to present the strong and weak long trend. A green candle is used to indicate long entry, while a red candle is usded to indicate long flatten signal.
Key Signal
green line --> strong long trend
red line --> weak long trend
blue line --> trend strength indicator
SELL label --> flatten long or short entry
BUY label --> long entry
TOPDIV label --> top divergence indicator
BOTDIV label --> bottom divergence indicator
Remarks
Feedbacks are appreciated.
Readme
In real life, I am a prolific inventor. I have successfully applied for more than 60 international and regional patents in the past 12 years. But in the past two years or so, I have tried to transfer my creativity to the development of trading strategies. Tradingview is the ideal platform for me. I am selecting and contributing some of the hundreds of scripts to publish in Tradingview community. Welcome everyone to interact with me to discuss these interesting pine scripts.
The scripts posted are categorized into 5 levels according to my efforts or manhours put into these works.
Level 1 : interesting script snippets or distinctive improvement from classic indicators or strategy. Level 1 scripts can usually appear in more complex indicators as a function module or element.
Level 2 : composite indicator/strategy. By selecting or combining several independent or dependent functions or sub indicators in proper way, the composite script exhibits a resonance phenomenon which can filter out noise or fake trading signal to enhance trading confidence level.
Level 3 : comprehensive indicator/strategy. They are simple trading systems based on my strategies. They are commonly containing several or all of entry signal, close signal, stop loss, take profit, re-entry, risk management, and position sizing techniques. Even some interesting fundamental and mass psychological aspects are incorporated.
Level 4 : script snippets or functions that do not disclose source code. Interesting element that can reveal market laws and work as raw material for indicators and strategies. If you find Level 1~2 scripts are helpful, Level 4 is a private version that took me far more efforts to develop.
Level 5 : indicator/strategy that do not disclose source code. private version of Level 3 script with my accumulated script processing skills or a large number of custom functions. I had a private function library built in past two years. Level 5 scripts use many of them to achieve private trading strategy.
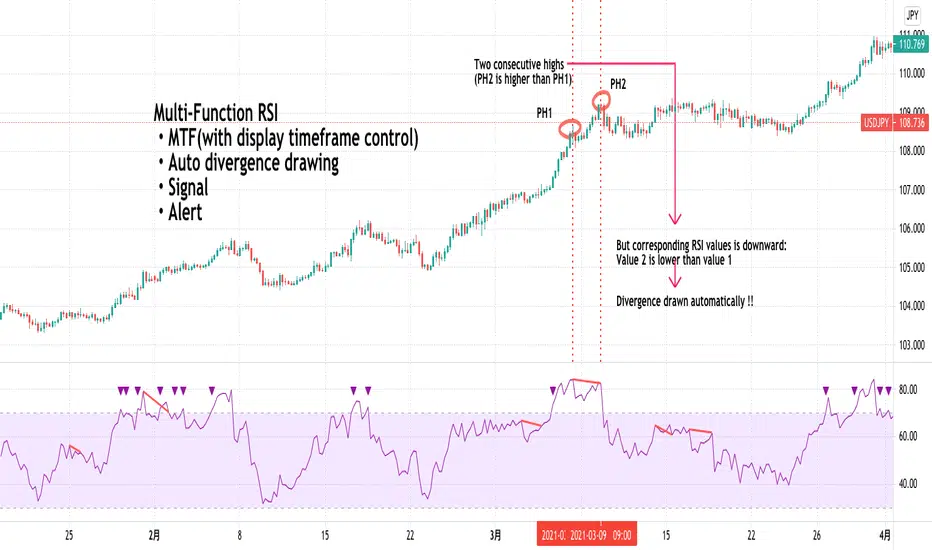
Multi-Function RSI(MTF, divergence, signal and alert)Japanese below / 日本語説明は下記
Overview
Multi-function RSI indicator with functions below.
1.MTF with display timeframe control
2.Auto divergence drawing incl. hidden divergence
3.Signal when RSI crosses over upper band/crosses under lower band
4.Color background when MTF RSI crosses over/under lower band
5.Alert when RSI crosses over upper band/crosses under lower bands
Please see the details below.
Functions:
1.MTF with display timeframe control
You can display daily, 4hour or 1 hour RSI or all of them as upper timeframe MTF RSI.
How is it different from other MTF indicators?
Problems with other MTF RSI indicators are;
-If you set higher timeframe RSI, it will also be shown on further higher timeframes.
i.e. If you set 4hour chart’s RSI on 1 hour or lower time frame charts, it will also appear on daily and weekly chart, which is not necessary.
To tackle these problems, this indicator has incorporated functions below.
-To show MTF RSI on timeframe lower than the upper timeframe you set as MTF timeframe.
For example, if you select daily timeframe for MTF RSI , the RSI will be shown only on 4 hour or lower timeframes(1H, 30M, 15M, 5M, 1M).
Left: 4hour chart, Middle: Daily chart, Right: Weekly chart
If you look at 4hour chart, daily chart’s RSI is shown(pale blue and orange) but weekly chart does not show daily chart’s RSI.
2.Auto divergence drawing incl. hidden divergence
Regular divergence line and hidden divergence line will be automatically drawn for current timeframe RSI as per the logic below.
Bearish : When two consecutive pivot highs go up but RSI values corresponding to each high go down.
Bullish: When two consecutive pivot lows go down but RSI values corresponding to each low go up.
Pivot highs(lows) are identified when those are preceded by n lower highs(lows) and proceeded by n lower highs(lows).
* n is parameterized.
See the diagram below.
Bearish : When two consecutive pivot highs go down but RSI values corresponding to each highs go up.
Bullish : When two consecutive pivot lows go up but RSI values corresponding to each low go down.
3.Signal when RSI crossing upper/lower bands
Signal will be shown when;
-RSI(current timeframe) crosses over upper band
-RSI(current timeframe) crosses under lower band
Example:
Purple triangle is signals.
4.Color background when MTF RSI crosses over/under lower band
Background color can be applied when MTF RSI crosses over upper band/under lower band.
Example:
Pale purple is daily RSI on 4 hour chart. Background color applied while daily RSI is outside upper/lower bands.
5.Alert when RSI crosses over upper band/under lower band
Alert can be set when;
-RSI crosses over upper band
-RSI crosses under lower band
How to use this indicator?
This indicator is paid indicator and invited-only indicator.
Please contact me via private chat or follow links in my signature so that I can grant the access right to the indicator.
Comment section is only for comments on the indicator or updates. Please refrain from contacting me using comments to follow TradingView house rules.
———————————————————————————————————————
多機能RSIインジケーターです。以下の機能が搭載されています。
1.マルチタイムフレーム機能(表示時間足制御機能付き)
2.ダイバージェンス自動描画機能(ヒドゥンダイバージェンス対応)
3.RSIがアッパーバンド、ロワーバンドとクロスした時にシグナル表示
4.上位足RSI(MTF RSI)がアッパーバンドより上にある時、ロワーバンドより下にある時に背景をハイライト
5.RSIがアッパーバンド、ロワーバンドとクロスした時にアラート設定
機能詳細は以下の通りです。
機能詳細
1.マルチタイムフレーム機能(表示時間足制御機能付き)
日足、4時間足、1時間足のいずれか、もしくは全てをRSIをマルチタイムフレームRSIとして表示することができます。(不要な場合は非表示可能)
他のマルチタイムフレームRSIとの違い
他のマルチタイムフレームRSIのインジケーターでは、以下の問題に直面します。
・上位足のRSIを表示すると、さらに上位足でもそのRSIが表示され見にくくなる。
例: 4時間足のRSIを下位足で表示可能な様に設定すると、日足や週足でも表示され、チャートが見にくくなる。
この問題に対して、このインジケーターでは、
・上位足のRSIを表示する時間軸を制御することで上位足で不必要な情報を表示させない。
という機能を加えることでこの問題を解決しています。
具体的には、マルチタイムフレーム用に選択した上位足のタイムフレームより小さいタイムフレームでのみ上位足のRSIが表示されるようになっています。
例えば、上位足として日足を選択した場合、日足のRSIは4時間足、1時間足、30分足、15分足、5分足、1分足にのみ表示されます。
<サンプルチャート>
左から4時間足、日足、週足です。
4時間足では日足のRSI(薄いパープルのライン)が表示されていますが、週足には表示されません。これはオシレーターが表示される時間軸を裏側のロジックで制御しているためです。
2.ダイバージェンス自動描画機能(ヒドゥンダイバージェンス対応)
以下のロジックに基づきダイバージェンスを自動描画します。(不要な場合は非表示可能)
<通常のダイバージェンス>
下降示唆:2つの連続する高値(*)が切り上げられているが、 それぞれの高値に対応するRSIの値は切り下げている場合
上昇示唆:2つの連続する安値(*)が切り下がっているが、 それぞれの安値に対応するRSIの値は切り上がっている場合
*高値(安値)は、左右n本(**)ずつのローソク足の高値(安値)より高い(低い)高値(安値)をピボットハイ・ローとして算出しています。
** nはユーザ設定値です。
<例: ダイバージェンス>
高値PH1はPH1のローソクの高値より左側にn個のより低い高値、右側にn個のより低い高値があった場合に高値として認識されます。
上記の例では高値がPH2>PH1と切り上がっていますが、対応するRSIの値はvalue2
下降継続示唆:2つの連続する高値(*)が切り下がっているが、 それぞれの高値に対応するRSIの値は切り上がっている場合
上昇継続示唆:2つの連続する安値(*)が切り上がっているが、 それぞれの安値に対応するRSIの値は切り下がっている場合
言うまでもないことですが、ダイバージェンスが出たから逆張り、などの安易な発想は避けるべきです。
環境認識の一つの要素として見るべき指標でしょう。
3.RSIがアッパーバンドを上抜いた時、ロワーバンドを下抜いた時にシグナル表示
アッパーバンド(初期値70)とロワーバンド(初期値30)の数値は変更可能です。
サンプルチャート:
4.上位足RSI(MTF RSI)がアッパーバンドより上にある時、ロワーバンドより下にある時に背景をハイライト
サンプルチャート:
日足のRSI(薄いパープルのライン)がアッパーラインより上にある時に背景がグレーがかっています。
このように上位足のRSIの状況を視覚的に認識したい時に役立つでしょう。
日足RSIラインは非表示にすることができますので、背景色だけ表示しておいて、背景に色が付き、かつダイバージェンスも出たら反転を警戒といった状況判断が可能です。
5.RSIがアッパーバンド、ロワーバンドとクロスした時にアラート設定
アラートを設定したいタイムフレームを開いた状態で、アラート設定の画面を開き以下の条件を選択することができます。
・RSIがアッパーバンドを上抜いた時
・RSIがロワーバンドを下抜いた時
インジケーターの使用について
当インジケーターは招待制インジケーター(有料)となっています。
使用を希望される方はプライベートチャットや下記リンクのDMでご連絡ください。
このページのコメント欄はインジケーターそのものに対するコメントやアップデートの記載のためのものとなっております。Tradingviewのハウスルールを守るためにもコメント欄からの連絡はご遠慮ください。