Daytrade

DepthHouse - Relative Momentum Range CandlesticksDepthHouse Relative Momentum & Range Candlesticks is a candlestick indicator based off of my previously released RMRO Oscillator.
DepthHouse Relative Momentum Range Candlesticks uses several calculations between the relative momentum and range to help determine trend direction and strength.
Candlestick meanings:
Green : Bullish trend
Blue (default is lime): Bullish trend weakening / possible consolidation
Red: Bearish trend
Salmon (default is orange): Bearish trend weakening / possible consolidation
White : Uncertain
How to get:
As you can see this is an invite only script. In the coming month this indicator, along with many others will become pay to use only. (website on my profile page)
However all my indicators will be FREE until May 1, 2018 . So please try them out!
T o take advantage of this FREE trial:
1. Leave comment on this indicator post! Maybe even give me a follow :D
2. Check out and take advantage of all my other indicators!
Here is the link to the DepthHouse RMRO Oscillator:
Please Note: There are NOT trading signals. Each colored candle represents nothing other than a possibility of which way the trend may go. Be sure to use your own adequate analysis. Use at your own financial risk.

DepthHouse Relative Momentum Range OscillatorDepthHouse Relative Momentum Range Oscillator uses several calculations between the relative momentum and range to help determine trend direction and strength.
Breakouts above the adjustable horizontal zone often serve as a bullish confirmation, while breakout below the horizontal zone often serve as a bearish confirmation.
Crosses of gold and yellow signal line represent trend consolidation and/or possible reversal zones.
How to get:
As you can see this is an invite only script. In the coming month this indicator, along with many others will become pay to use only. (website on my profile page)
However all my indicators will be FREE until May 1, 2018 . So please try them out!
To take advantage of this FREE trial :
1. Leave comment on this indicator post! Maybe even give me a follow :D
2. Check out and take advantage of all my other indicators!
I hope you all enjoy!
Notes:
Signals Beta:
Both functions give possible buy and sell signals shown by the circles in the middle. The strength of the signal is shown by the circle size. The larger the circle, the stronger the signal.
This feature is in beta testing is not advised to trade off of.
Altering the Multi-Factor will adjust the dotted signals at the bottom.
This is a heavily modified version of my DepthHouse Envelope Oscillator

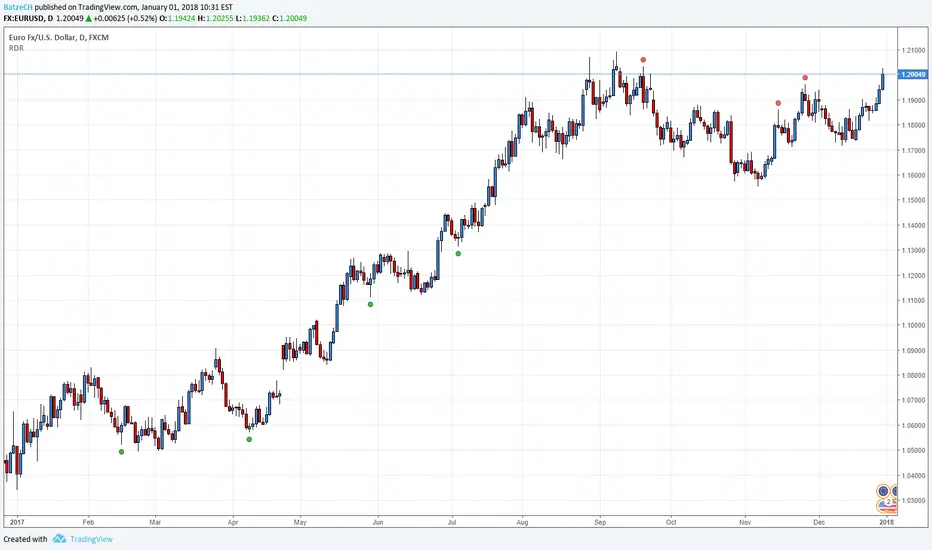
Red Dog Reversal PatternThis indicator is a interpretation of the Red Dog Reversal Pattern which was discovered by T3Live founder Scott Redler. (AFAIK)
The indicator is maybe useful for Day Trade or Swing Trade.
BUY Criteria:
1. Stock is down for multiple days
2. Stock goes below prior day's low
3. Stock trades back up through prior day's low, which triggers the buy
4. The stop is set at the current intraday low
SELL Criteria:
1. Stock is up for multiple days
2. Stock goes above the prior day's high
3. Stock trades back down through prior day's high, which triggers the sell
4. The stop is set at the current intraday high
Please always remember, there is no holy grail indicator!
[naoligo] 12x MA DT (5, 15, 30 & 60)This indicator is based on "Generic 8x MA Plotter", by @LazyBear.
It is also based on my own indicator "10x MA (H, D, W, M)", which is good for Swing Trading and/or Position.
This one is focused in daytrade and it will plot three Moving Averages based on current time interval (under 5 minutes) and nine based on chosen periods by 5, 15, 30 and 60 minutes. You will be able to see where is, for example, a 50 period's SMA of 15 minutes when using a 2 minutes time interval chart. I find it very useful to analyze, in a snap, possible price ranges and enter/exit points. All reference values are from setups known and used by daytraders.
you can choose between EMA or SMA (default: SMA) for each time interval, that are distributed in:
3x MA current time interval;
3x MA 5 minutes;
2x MA 15 minutes;
2x MA 30 minutes;
2x MA 60 minutes.
I've tried to keep the code as simple as possible, so you can increase the number of MA or modify the type for each time interval.
Cons: Use it wisely, because if you choose to plot all the 12 Moving Averages, it will may consume a lot of your navigator resources.
Enjoy!

Gain/Loss TrackerHi,
This script's purpose is to provide a really quick view of gain/loss of a buying price.
As it is my first script, it is not perfect.
You have to select % scale and input your buying price in the options.
I'll continue to work on it to :
- make an auto selection of % scale (if possible)
- render different colors (positive/negative differentiation in relation to the buying price)
Updates 11/10/2017
- default precision set to 8 (for satoshis)

[naoligo] Pivot Points (Daily)Suporte/Resistência do Pivot diário para gráficos intraday
Marcação do S/R tradicional e S/R Fibonacci
Daily Pivot Point Support/Resistances on intraday charts
Both Traditional and Fibonacci methods plotted

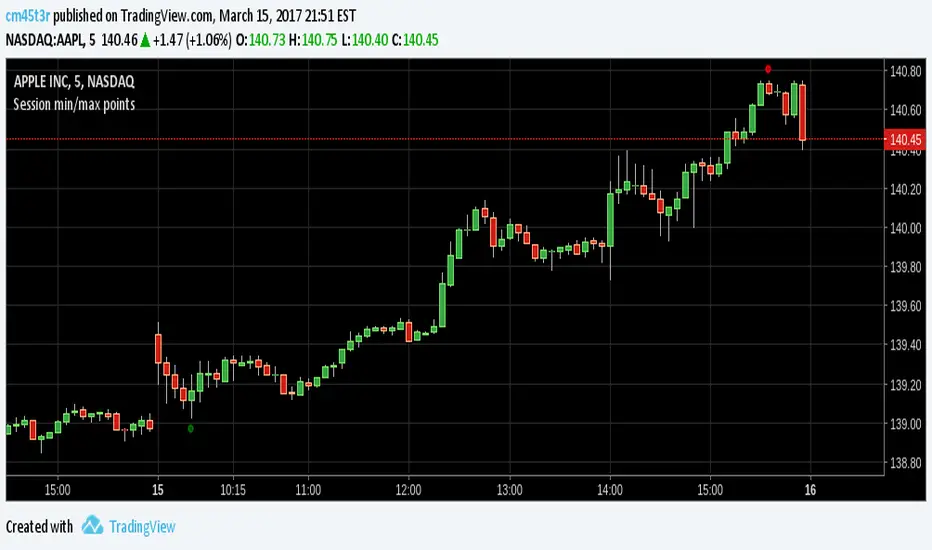
Session min/max pointsMinimum and maximum points in a day trading session. It may help you spot the range which min and max occur in a session.
In day trading, for example, at securities like GBPNZD, minimum happens between 02:00-05:00 ET and maximum between 08:00-14:00 ET. This indicator can help you test this hypothesis.
Happy trading!
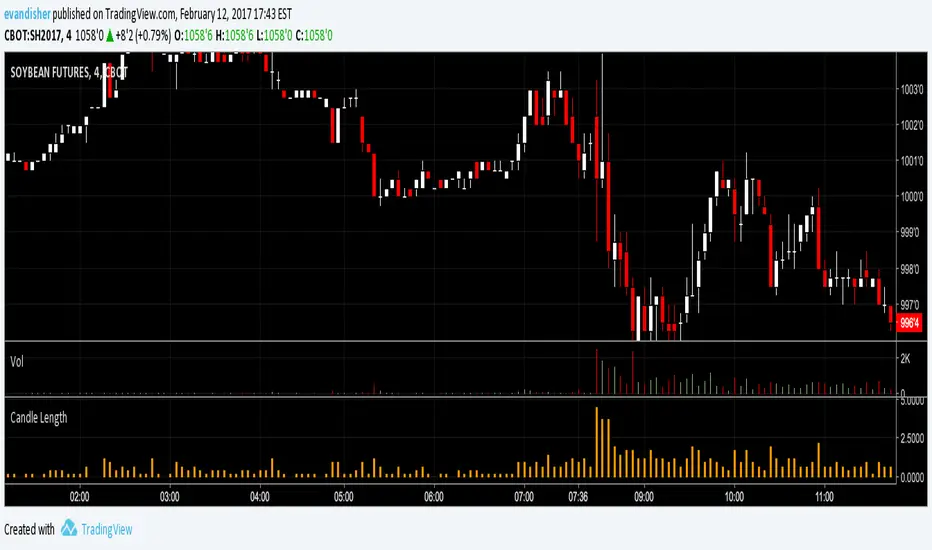
Candle Length by WiscoDishMeasure of the total candle length, including the upper and lower wicks. Works best as a histogram in my opinion. Used as a quick reference for the high minus the low of each candle.
JPY GBP ROCsRate of change of most volatile JPY and GBP pairs. All pairs ending in JPY are red except GBPJPY (colored yellow --currently most volatile 7/2016). GBPNZD is blue, the other GBP pairs are green, lime and teal. GBPJPY and GBPNZD are my favorite day trading / swing trading pairs. This script allows me to see the action of the most volatile and liquid pairs on one screen. JPY pairs (ex-GBPJPY) are all red so that I see the flow of JPY not so much each pair and its name. Global movement of JPY is what I am after. Same for the coloring of GBP pairs as green expect GBPNZD as blue. ***** EURGBP is plotted as an opposite (with a negative in front of its sma. EURGBP is extremely correlated to GBPNZD, I decided to plot it also.
