Daily OpenUses provided unix time functions to print daily open (0000 UTC) lines and optionally an additional extension to it from the previous day.
Dailyopen
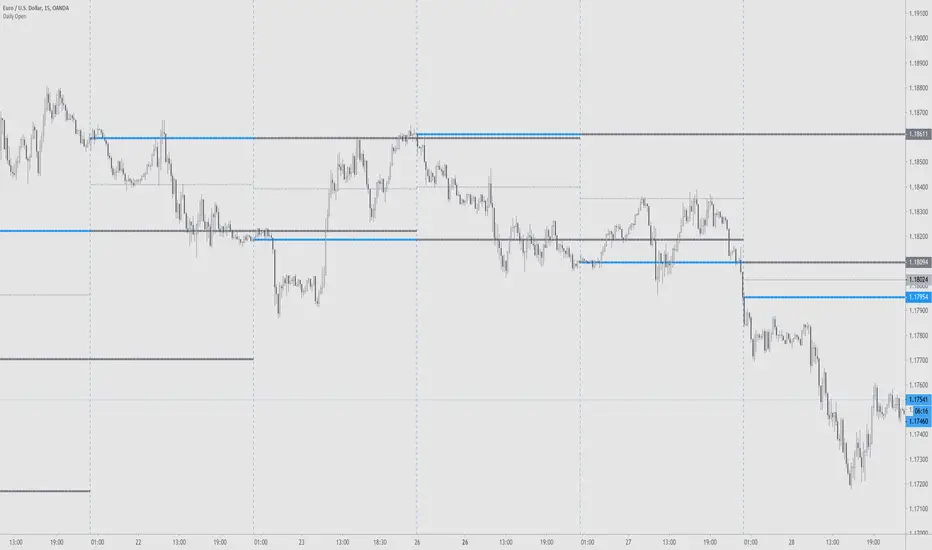
Daily Weekly Monthly Yearly OpensThis script plots the current daily, weekly and monthly opens (all enabled by default).
Here are some additional info about the drawing behavior:
Daily open is shown only on intraday timeframes
Weekly open is shown only on timeframes < weekly
Monthly open is shown only on timeframes < monthly
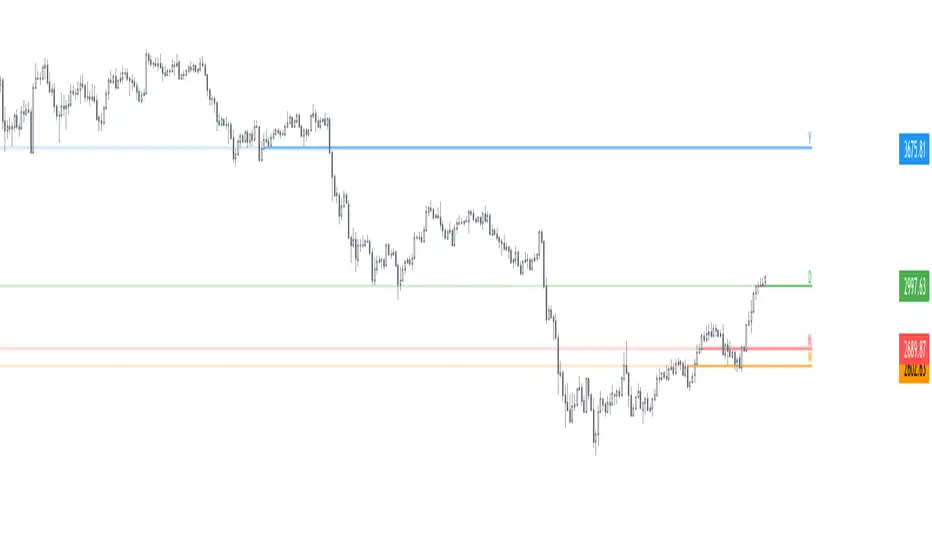
SFL Levels - levels that matterThis is an indicator that gives you an easy way to display the following significant levels on a chart:
- The daily open
- The weekly open
- The monthly open
- Yesterday's high and low price
- Last week's high and low price
These levels often function as natural support and resistance and because of that, it's relevant to have them on your charts.
Every type of level can be enabled or disabled, allowing you to easily customize for the levels you want to see.
The colours and line types can also be changed as you wish.


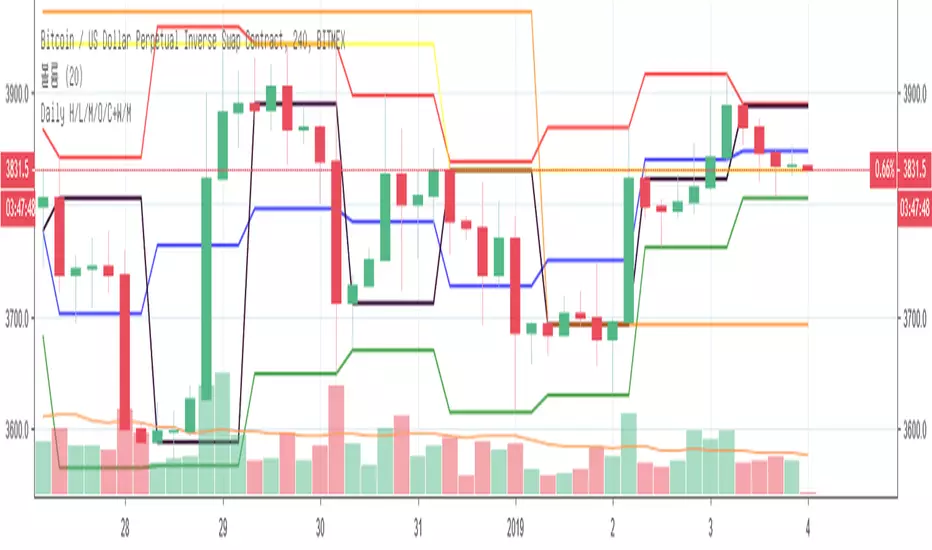
Daily High/Low/Mid/Open/CloseI modify existing scripts about Daily High/Low, Daily Open, Previous Daily Close, etc.
Daily High = red color
Daily Low = green color
Daily Mid = blue color
Daily Open = purple color
Previous Daily Close = black color