@tk · fractal emas█ OVERVIEW
This script is an indicator that plots short, medium and long moving averages for multiple fractals. This script was based on sharks EMAs by rlvs indicator, that plots multiple rays for each fractals into the chart. The main feature of this indicator is the customizability. The calculation itself is simple as moving average.
█ MOTIVATION
The trader can customize all aspects of the plotted data. The text size, extended line length, the moving average type — exponential, simple, etc... — the length of fractal rays, line style, line width and visibility. To keep minimalist, this indicator simplifies the logic of line colors based on the purpose of each moving averages. To prevent overnoise the chart with multiple lines with multiple colors for each fractal timefraes, the trader needs to keep in mind that the all lines with the "short" moving average color for example, will represents the short moving averages lines for all fractals. This logic is applied for medium and long moving averages either.
█ CONCEPT
The trading concept to use this indicator is to make entries on uptrend or downtrend pullbacks when the asset price reaches the short, medium or long moving averages price levels. But this strategy don't works alone. It needs to be aligned together with others indicators like RSI, Chart Patterns, Support and Resistance, and so on... Even more confluences that you have, bigger are your chances to increase the probability for a successful trade. So, don't use this indicator alone. Compose a trading strategy and use it to improve your analysis.
█ CUSTOMIZATION
This indicator allows the trader to customize the following settings:
GENERAL
Text size
Changes the font size of the labels to improve accessibility.
Type: string
Options: `tiny`, `small`, `normal`, `large`.
Default: `small`
SHORT
Type
Select the Short Moving Average calculation type.
Type: string
Options: `EMA`, `SMA`, `HMA`, `VWMA`, `WMA`.
Default: `EMA`
Length
Changes the base length for the Short Moving Average calculation.
Type: int
Default: 12
Source
Changes the base source for the Short Moving Average calculation.
Type: float
Default: close
Color
The base color that will represent the Short Moving Average.
Type: color
Default: color.rgb(255, 235, 59) (yellow)
Fractal Style
The fractal ray line style.
Type: string
Options: `dotted`, `dashed`, `solid`.
Default: `dotted`
Fractal Width
The fractal ray line width.
Type: string
Options: `1px`, `2px`, `3px`, `4px`.
Default: `1px`
Fractal Ray Length
The fractal ray line length.
Type: int
Default: 12
MEDIUM
Type
Select the Medium Moving Average calculation type.
Type: string
Options: `EMA`, `SMA`, `HMA`, `VWMA`, `WMA`.
Default: `EMA`
Length
Changes the base length for the Medium Moving Average calculation.
Type: int
Default: 26
Source
Changes the base source for the Medium Moving Average calculation.
Type: float
Default: close
Color
The base color that will represent the Short Moving Average.
Type: color
Default: color.rgb(0, 230, 118) (lime)
Fractal Style
The fractal ray line style.
Type: string
Options: `dotted`, `dashed`, `solid`.
Default: `dotted`
Fractal Width
The fractal ray line width.
Type: string
Options: `1px`, `2px`, `3px`, `4px`.
Default: `1px`
Fractal Ray Length
The fractal ray line length.
Type: int
Default: 12
LONG
Type
Select the Long Moving Average calculation type.
Type: string
Options: `EMA`, `SMA`, `HMA`, `VWMA`, `WMA`.
Default: `EMA`
Length
Changes the base length for the Long Moving Average calculation.
Type: int
Default: 200
Source
Changes the base source for the Long Moving Average calculation.
Type: float
Default: close
Color
The base color that will represent the Short Moving Average.
Type: color
Default: color.rgb(255, 82, 82) (red)
Fractal Style
The fractal ray line style.
Type: string
Options: `dotted`, `dashed`, `solid`.
Default: `dotted`
Fractal Width
The fractal ray line width.
Type: string
Options: `1px`, `2px`, `3px`, `4px`.
Default: `1px`
Fractal Ray Length
The fractal ray line length.
Type: int
Default: 12
VISIBILITY
Show Fractal Rays · (Short)
Shows short moving average fractal rays.
Type: bool
Default: true
Show Fractal Rays · (Medium)
Shows short moving average fractal rays.
Type: bool
Default: true
Show Fractal Rays · (Long)
Shows short moving average fractal rays.
Type: bool
Default: true
█ FUNCTIONS
The script contains the following functions:
`fn_labelizeTimeFrame`
Labelize timeframe period in minutes and hours.
Parameters:
tf: (string) Timeframe period to be labelized.
Returns: (string) Labelized timeframe string.
`fn_builtInLineStyle`
Converts simple string to built-in line style variable value.
Parameters:
lineStyle: (string) The line style simple string.
Returns: (string) Built-in line style string value.
`fn_builtInLineWidth`
Converts simple pixel string to line width number value.
Parameters:
lineWidth: (string) The line width pixel simple string.
Returns: (string) Built-in line width number value.
`fn_requestFractal`
Requests fractal data based on `period` given an expression.
Parameters:
period: (string) The period timeframe of fractal.
expression: (series float) The expression to retrieve data from fractal.
Returns: (mixed) A result determined by `expression`.
`fn_plotRay`
Plots line after chart bars.
Parameters:
y: (float) Y axis line position.
label: (string) Label to be ploted after line.
color: (color) Line and label color.
length: (int) Line length.
show: (bool) Flag to display the line. (default: `true`)
lineStyle: (string) Line style to be applied. (default: `line.style_dotted`)
lineWidth: (int) Line width. (default: `1`)
Returns: void
`fn_plotEmaRay`
Plots moving average line for a specific period.
Parameters:
period: (simple string) Period of fractal to retrieve
expression: (series float) The expression to retrieve data from fractal.
color: (color) Line and label color.
length: (int) Line length. (default: `12`)
show: (bool) Flag to display the line. (default: `true`)
lineStyle: (string) Line style to be applied. (default: `line.style_dotted`)
lineWidth: (string) Line width. (default: `1px`)
Returns: void
`fn_plotExtendedEmaRay`
Draws extended line for current timeframe moving average.
Parameters:
coordY: (float) Extended line Y axis position.
textValue: (simple string) Extended line label text.
textColor: (color) Extended line text color.
length: (int) Extended length. (default: `5`)
Returns: void
Customizable

[Camarilla Pivots] Signal Clean Up Analysis with Backtest (TSO)Camarilla Pivots NEW GEN Indicator!
This is a full-cycle trading system indicator, which uses Camarilla Pivots for generating signals using a custom developed algorithm, TP (Take Profit) and SL (Stop Loss) levels. There are 3 SOURCES for signals (each can be used separately or in combination or all 3 can be used at the same time, each signal SOURCE is using Camarilla Pivots levels to open optimal trade direction) with chained (NOTE: There are many potential profitable setups available, by combining clean up features availabe in the indicator settings!) signal cleanup and analysis approach with scheduling and alerting capabilities. Works best with shorter timeframes: 1M, 5M, 15M, 1H.
NOTE: Every calculation is done on a confirmed closed candle bar state, so the indicator will never repaint!
NOTE: At position open - there will be calculated Take-Profit and Stop-Loss targets, however each target is considered hit, when candle bar closes breaking that target, so Take-Profit and Stop-Loss when hit will slightly differ then what you see at position open!
===========================================================================
Explanation of all the Features | Configuration Guide | Indicator Settings | Signal Cleanup Analysis
---------------------------------------------------------------------------
>>> Customizable Backtesting for a specific date range, results via TradingView strategy, which includes “Deep Backtesting” for largest amounts of data on trading results.
>>> Trading Schedule with customizable trading daily time range, automatic closing/alert trades before Power Hour or right before market closes or leave it open until next day.
>>> 3 Trading Systems.
>>> Multiple Signal SOURCEs for opening trades, either SOURCE can be used or both at the same time!
>>> Static/Dynamic Stop-Loss setups (HIGHLIGHT: Stop-Loss will be moved to Entry after TP1 is taken, which minimizes risk).
>>> Single or Multiple profit targets (up to 5).
>>> Take-Profit customizable offset feature (set your Take-Profit targets slightly before everyone is expecting it!).
>>> Candle bar signal analysis (matching candle color, skip opposite structured and/or doji candle uncertain signals).
>>> Additional analysis of VWAP/EMA/ATR/EWO (Elliot Wave Oscillator)/Divergence MACD+RSI/Volume signal confirmation (clean up your chart with indicator showing only the best potential signals!).
>>> Advanced Alerts setup, which can be potentially setup with a trading bot over TradingView Webhook (NOTE: This will require advanced programming knowledge).
===========================================================================
Labels, plots, colors explanations:
---------------------------------------------------------------------------
>>>>> LONG open: green "house" looking arrow below candle bar.
>>>>> SHORT open: red "house" looking arrow above candle bar.
>>>>> LONG/SHORT take-profit target: green/red circles (multi-profit > TP2/3/4/5 smaller circles).
>>>>> LONG/SHORT stop-loss target: green/red + crosses.
>>>>> LONG/SHORT take-profit hits: green/red diamonds.
>>>>> LONG/SHORT stop-loss hits: green/red X-crosses.
>>>>> LONG/SHORT EOD (End of Day | Intraday style) close (profitable trade): green/red squares.
>>>>> LONG/SHORT EOD (End of Day | Intraday style) close (loss trade): green/red PLUS(+)-crosses.
===========================================================================
Date Range and Trading Schedule Settings
---------------------------------------------------------------------------
>>>>> Date Range: Select your start and/or end dates (uncheck “End” for indicator to show results up to the very moment and to use for LIVE trading) for backtesting results, if not using backtesting – uncheck “Start”/“End” to turn it off.
>>>>> Use TradingView “Strategy Tester” to see backtesting results
NOTE: If Strategy Tester does not show any results with Date Ranged fully unchecked, there may be an issue where a script opens a trade, but there is not enough TradingView power to set the Take-Profit and Stop-Loss and somehow an open trade gets stuck and never closes, so there are “no trades present”. In such case you will need to manually check “Start”/“End” dates or use “Depp Backtesting” feature!
>>>>> Trading Schedule: This is where you can setup Intraday Session or any custom session schedule you wish. Turn it ON. Select trading hours. Select EOD (End of Day) setting (NOTE: If it will be OFF, the indicator will assume you are holding your position open until next day!). Please note the EOD trade closure times with the 2 different Intraday close settings when turned on:
At Market Close:
1/3/5min > will close at 15:55pm ET
15min > will close at 15:45pm ET
30min > will close at 15:30pm ET
45min > will close at 15:45pm ET
60min > will close at 15:00pm ET
Before Power Hour:
1/3/5min > will close at 15:00pm ET
15min > will close at 15:00pm ET
30min > will close at 15:00pm ET
45min > will close at 15:00pm ET
60min > will close at 15:00pm ET
>>> Trading Systems: 1) "Open Until Closed by TP or SL": the signal will only open a trade if no trades are currently open/trunning, a trade can only be closed by Take Profit, Stop Loss or End of Day close (if turned on) | 2) "Open Until Closed by TP or SL + OCA": Same as 1), but if there is an opposite signal to the trade which is currently open > it will immediately be closed with new trade open or End of Day close (if turned on) | 3) "OCA (no TP or SL)": There are is Take Profit or Stop Loss, only an opposite signal will close current trade and open an opposite one or End of Day close (if turned on).
>>> Position Open sources:
>>>>> Position Open - SOURCE1 | LONG: S3, SL: S4, TP1: R3, TP2: R4, TP3: R5, TP4/5: Smart Formula | SHORT: R3, SL: R4, TP1: S3, TP2: S4, TP3: S5, TP4/5: Smart Formula
>>>>> Position Open - SOURCE2 | LONG: R4, SL: R3, TP1: R5, TP2/3/4/5: Smart Formula | SHORT: S4, SL: S3, TP1: S5, TP2/3/4/5: Smart Formula
>>>>> Position Open - SOURCE3 | LONG: R5, SL: R4, TP1/2/3/4/5: Smart Formula | SHORT: S5, SL: S4, TP1/2/3/4/5: Smart Formula
>>> Turn On/Off: Current Position SL + Opposite Position Open Signal on the same closing candle bar (If current trade hits Stop-Loss and at that same closing candle bar there is a signal for an opposite direction trade > indicator will close current position as Stop-Loss and immediately open an opposite position). NOTE: With this option turned on, there will be more trades, but not necessarily better results, since after Stop-Loss is hit, it may make sense to wait a little before opening an opposite trade, even if it matches the condition at the same time when Stop-Loss is hit, but sometimes it shows great results, so this setting/feature is included.
>>> Turn On/Off: Turn On/Off: Current Position REGULAR SL | Only the SL + Opposite Position Open will trigger if turned on, IF NOT - THERE WILL BE NO STOP-LOSS AT ALL!!! NOTE: It is very dangerous to trade without Stop-Loss!
>>>>> Signal Candle Bar consuming Take-Profits - position/trade signal candle bar is big enought to "consume"/close ahead the first TP setting > the signal can either be skipped, or all Take-Profit areas pushed ahead using smart formula)
>>>>> MULTIPROFIT | TP (Take-Profit) System: Once the trade is open, all Take-Profit target(s) are immediately calculated and set for the trade > once the target(s) is hit > trade will be partially closed (if candle bar closes beyond several Take-Profit targets > trade will be reduced accordingly to the amount of how many Take-Profit targets were hit)
>>>>> MULTIPROFIT | SL (Stop-Loss) System: 1) Static – Once the trade is open, Stop-Loss is calculated and set for the remaining of the trade ||| 2) Dynamic – At trade open, Stop-Loss is calculated and set the same way, however once 1st Take-Profit is taken > Stop-Loss is moved to Entry, reducing the risk.
>>>>> # of TPs (number of take profit targets): Just like it is named, this is where you select the number of Take-Profit targets for your trading system (NOTE: If "OCA (no TP or SL)" Trading System is selected, this setting won’t do anything, since there are no TP or SLs for that system).
>>>>> TP(s) offset: This is a special feature for all Take-Profit targets, where you can turn on a customizable offset, so that if the price is almost hitting the Take-Profit target, but never actually touches it > you will capture it. This is good to use with HHLL (Highest High Lowest Low), which is pretty much a Support/Resistance as often the price will nearly touch these strong areas and turn around…
===========================================================================
Signal Analysis and Cleanup Settings
---------------------------------------------------------------------------
>>>>> Candle Analysis | Candle Color signal confirmation: If closed candle bar color does not match the signal direction > no trade will be open.
>>>>> Candle Analysis | Skip opposite candle signals: If closed candle bar color will match the signal direction, but candle structure will be opposite (for example: bearish green hammer, long high stick on top of a small green square) > no trade will be open.
>>>>> Candle Analysis | Skip doji candle signals: If closed candle bar will be the uncertain doji > no trade will be open.
>>>>> Divergence/Oscillator Analysis | EWO (Elliot Wave Oscillator) signal confirmation: LONG will only be open if at signal, EWO is green or will be at bullish slope (you can select which setting you desire), SHORT if EWO is red or will be at bearish slope.
>>>>> Divergence/Oscillator Analysis | VWAP signal confirmation: LONG will only be open if at signal, the price will be above VWAP, SHORT if below.
>>>>> Divergence/Oscillator Analysis | Moving Average signal confirmation: LONG will only be open if at signal, the price will be above selected Moving Average, SHORT if below.
>>>>> Divergence/Oscillator Analysis | ATR signal confirmation: LONG will only be open if at signal, the price will be above ATR, SHORT if below.
>>>>> Divergence/Oscillator Analysis | RSI + MACD signal confirmation: LONG will only be open if at signal, RSI + MACD will be bullish, SHORT if RSI + MACD will be bearish.
>>>>> Volume signal confirmation: LONG/SHORT will only be opened with strong Volume matching the signal direction, by default, strong Volume percentage is set to 150% and weak to 50%, but you can change it as you desire.
===========================================================================
||||||||||||||||||||||||||||||||||| *** ||||||||||||||||||||||||||||||||||| *** |||||||||||||||||||||||||||||||||||
||||||||||||||||||||||||||||||||||| *** ||||||||||||||||||||||||||||||||||| *** |||||||||||||||||||||||||||||||||||
TP System - VERY IMPORTANT INFO!
-------------------------------------------------------------------------------------------------------------------
"TP PERCENTAGE" - amount by which current trade/position needs to be reduced/partially closed/sold.
-------------------------------------------------------------------------------------------------------------------
TP System: Dynamic
"TP PERCENTAGE" - will always be the same amount (trade/position size divided by the # of take-profit(TP) targets) and percentage to be closed will always be of the ORIGINAL trade/position.
-------------------------------------------------------------------------------------------------------------------
TP System: Static
"TP PERCENTAGE" - will always be the same amount IF take-profit(TP) targets are hit 1-by-1 (TP1 > TP2 > TP3 > TP4 > TP5), otherwise it will vary and unless it is a 1st take-profit(TP1), the REMAINING trade/position size will always be smaller than original and therefore the percentage to be closed will always be of the REMAINING trade/position and NOT the original one!
-------------------------------------------------------------------------------------------------------------------
"TP PERCENTAGE" CheatSheet (these are the only percentages you may see)
-----------------------------------------------------------------------
TP PERCENTAGE---Close/Sell Amount-------------Example (trade size: 50 stocks)
20%-------------trade size * 0.2--------------50 * 0.2 = 10 stocks
25%-------------trade size * 0.25-------------50 * 0.25 = 12.5(~13) stocks
34%-------------trade size * 0.34-------------50 * 0.34 = 17 stocks
40%-------------trade size * 0.4--------------50 * 0.4 = 20 stocks
50%-------------trade size * 0.5--------------50 * 0.5 = 25 stocks
60%-------------trade size * 0.6--------------50 * 0.6 = 30 stocks
66%-------------trade size * 0.66-------------50 * 0.66 = 33 stocks
75%-------------trade size * 0.75-------------50 * 0.75 = 37.5(~38) stocks
80%-------------trade size * 0.8--------------50 * 0.8 = 40 stocks
100%------------trade size--------------------50 = 50 stocks
-----------------------------------------------------------------------
If for any reason a portion of the current/remaining trade closed at such occurrence was slightly wrong, it is not an issue. Such occurrences are rare and with slight difference in partial TP closed is not significant to overall performance of our algorithms.
||||||||||||||||||||||||||||||||||| *** ||||||||||||||||||||||||||||||||||| *** |||||||||||||||||||||||||||||||||||
||||||||||||||||||||||||||||||||||| *** ||||||||||||||||||||||||||||||||||| *** |||||||||||||||||||||||||||||||||||
Alert Settings (you don’t have to touch this section unless you will be using TradingView alerts through a Webhook to use with trading bot)
---------------------------------------------------------------------------
Here is how a LONG OPEN alert looks like.
NOTE: Each label , , etc. is customizable, you can change the text of it within indicator Input settings.
ALERT >>>>>>>>>>>>>>>>>>>>>>>>>>>>>>>>>>>>>>>>>>>>>>>
COIN: BTCUSD
TIMEFRAME: 15M
LONG: OPEN
ENTRY: 20000
TP1: 20500
TP2: 21000
TP3: 21500
TP4: 22500
TP5: 23500
SL: 19000
Leverage: 0
---------------------------------------------------------------------------
Here is how a TP1 alert will look with 5 TPs breakdown of the trade.
NOTE1: Next to TP1 taken it will show at which price it was triggered.
NOTE2: Next to "TP Percentage" it shows how much of the CURRENT/ACTIVE/REMAINING trade needs to be closed.
NOTE2: If TP2/3/4/5 comes before TP1 - the alert will tell you exactly how many percent of the trade needs to be closed!
ALERT >>>>>>>>>>>>>>>>>>>>>>>>>>>>>>>>>>>>>>>>>>>>>>>
COIN: BTCUSD
TIMEFRAME: 15M
LONG: TP1
TP1: 20500
TP Percentage: 20%
---------------------------------------------------------------------------
Here is how an alert will look for LONG - STOP-LOSS.
ALERT >>>>>>>>>>>>>>>>>>>>>>>>>>>>>>>>>>>>>>>>>>>>>>>
COIN: BTCUSD
TIMEFRAME: 15M
ENTRY: 20000
LONG: SL
SL: 19000
---------------------------------------------------------------------------
Here is how an alert will look for LONG - EOD (End of Day) In Profit close.
ALERT >>>>>>>>>>>>>>>>>>>>>>>>>>>>>>>>>>>>>>>>>>>>>>>
COIN: BTCUSD
TIMEFRAME: 15M
LONG: EOD-Close (profit)
ENTRY: 20000
EOD-Close: 21900
===========================================================================
Adding Alerts in TradngView
---------------------------------------------------------------------------
-Add indicator to chart and make sure it is configured (check back-testing results)
-Right-click anywhere on the TradingView chart
-Click on Add alert
-Condition: Select this indicator by it’s name
-Alert name: Whatever you want
-Hit “Create”
-Note: If you change ANY Settings within the indicator – you must DELETE the current alert and create a new one per steps above, otherwise it will continue triggering alerts per old Settings!
===========================================================================
If you have any questions or issues with the indicator, please message me directly via TradingView.
---------------------------------------------------------------------------
Good Luck! (NOTE: Trading is very risky, past performance is not necessarily indicative of future results, so please trade responsibly!)
---------------------------------------------------------------------------
NOTE: There seems to be a strange glitch when strategy is running live, it will show "double-take" take-profits labels on the chart. This is not affecting the script logic and backtesting results, if you will remove/re-add the script afterwards, it will no longer show the duplicate orders... this must be some sort of a glitch as every alert was thoroughly tested to make sure everything is working!

[Volume Profile] Signal Clean Up Analysis with Backtest (TSO) This is a full-cycle trading system indicator, which uses Volume Profile for generating signals using a custom developed algorithm, TP (Take Profit) and SL (Stop Loss) levels. There are 2 SOURCES for signals (each can be used separately or both can be used at the same time, each signal SOURCE is using Volume Profile levels to open optimal trade direction) with chained (NOTE: You can select several or ALL of the features, this is not limited to either one) signal cleanup and analysis approach with scheduling and alerting capabilities. Works with most popular timeframes: 1M, 5M, 15M, 1H, 4H, D, great for intraday trading!
NOTE: Every calculation is done on a confirmed closed candle bar state, so the indicator will never repaint!
===========================================================================
Explanation of all the Features | Configuration Guide | Indicator Settings | Signal Cleanup Analysis
---------------------------------------------------------------------------
>>> Customizable Backtesting for a specific date range, results via TradingView strategy, which includes “Deep Backtesting” for largest amounts of data on trading results.
>>> Trading Schedule with customizable trading daily time range, automatic closing/alert trades before Power Hour or right before market closes or leave it open until next day.
>>> 3 Trading Systems.
>>> Multiple Signal SOURCEs for opening trades, either SOURCE can be used or both at the same time!
>>> Static/Dynamic Stop-Loss setups (HIGHLIGHT: Stop-Loss will be moved to Entry after TP1 is taken, which minimizes risk).
>>> Single or Multiple profit targets (up to 3).
>>> Take-Profit customizable offset feature (set your Take-Profit targets slightly before everyone is expecting it!).
>>> Candle bar signal analysis (matching candle color, skip opposite structured and/or doji candle uncertain signals).
>>> Additional analysis of VWAP/EMA/ATR/EWO (Elliot Wave Oscillator)/Divergence MACD+RSI/Volume signal confirmation (clean up your chart with indicator showing only the best potential signals!).
>>> Advanced Alerts setup, which can be potentially setup with a trading bot over TradingView Webhook (NOTE: This will require advanced programming knowledge).
===========================================================================
Labels, plots, colors explanations:
---------------------------------------------------------------------------
>>>>> Signal SOURCE(s): Green/Red arrows, which will be shown unconditionally, outside of trade engine and can be hidden if desired.
>>>>> LONG open: green "house" looking arrow below candle bar.
>>>>> SHORT open: red "house" looking arrow above candle bar.
>>>>> LONG/SHORT take-profit target: green/red circles (multi-profit > TP2/3/4/5 smaller circles).
>>>>> LONG/SHORT take-profit hits: green/red diamonds.
>>>>> LONG/SHORT stop-loss target: green/red + crosses.
>>>>> LONG/SHORT stop-loss hits: green/red X-crosses.
>>>>> LONG/SHORT EOD close (profitable trade): green/red squares.
>>>>> LONG/SHORT EOD close (loss trade): green/red PLUS(+)-crosses.
===========================================================================
Date Range and Trading Schedule Settings
---------------------------------------------------------------------------
>>>>> Date Range: Select your start and/or end dates (uncheck “End” for indicator to show results up to the very moment and to use for LIVE trading) for backtesting results, if not using backtesting – uncheck “Start”/“End” to turn it off.
>>>>> Use TradingView “Strategy Tester” to see backtesting results
NOTE: If Strategy Tester does not show any results with Date Ranged fully unchecked, there may be an issue where a script opens a trade, but there is not enough TradingView power to set the Take-Profit and Stop-Loss and somehow an open trade gets stuck and never closes, so there are “no trades present”. In such case you will need to manually check “Start”/“End” dates or use “Depp Backtesting” feature!
>>>>> Trading Schedule: This is where you can setup Intraday Session or any custom session schedule you wish. Turn it ON. Select trading hours. Select EOD (End of Day) setting (NOTE: If it will be OFF, the indicator will assume you are holding your position open until next day!).
>>> Trading Systems: 1) "Open Until Closed by TP or SL": the signal will only open a trade if no trades are currently open/trunning, a trade can only be closed by Take Profit, Stop Loss or End of Day close (if turned on) | 2) "Open Until Closed by TP or SL + OCA": Same as 1), but if there is an opposite signal to the trade which is currently open > it will immediately be closed with new trade open or End of Day close (if turned on) | 3) "OCA (no TP or SL)": There are is Take Profit or Stop Loss, only an opposite signal will close current trade and open an opposite one or End of Day close (if turned on)
>>>>> MULTIPROFIT | TP (Take-Profit) System: Once the trade is open, all Take-Profit target(s) are immediately calculated and set for the trade > once the target(s) is hit > trade will be partially closed (if candle bar closes beyond several Take-Profit targets > trade will be reduced accordingly to the amount of how many Take-Profit targets were hit)
>>>>> MULTIPROFIT | SL (Stop-Loss) System: 1) Static – Once the trade is open, Stop-Loss is calculated and set for the remaining of the trade ||| 2) Dynamic – At trade open, Stop-Loss is calculated and set the same way, however once 1st Take-Profit is taken > Stop-Loss is moved to Entry, reducing the risk.
>>>>> # of TPs (number of take profit targets): Just like it is named, this is where you select the number of Take-Profit targets for your trading system (NOTE: If "OCA (no TP or SL)" Trading System is selected, this setting won’t do anything, since there are no TP or SLs for that system).
>>>>> TP(s) offset: This is a special feature for all Take-Profit targets, where you can turn on a customizable offset, so that if the price is almost hitting the Take-Profit target, but never actually touches it > you will capture it. This is good to use with HHLL (Highest High Lowest Low), which is pretty much a Support/Resistance as often the price will nearly touch these strong areas and turn around…
===========================================================================
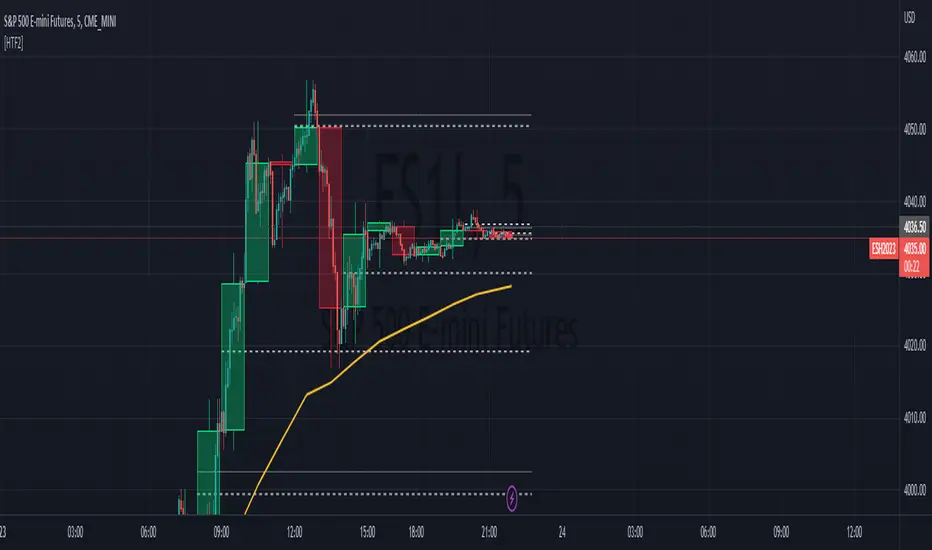
Take-Profit and Stop-Loss visual example:
---------------------------------------------------------------------------
1) A simply nice intraday trading day for SPY (S&P500 ETF TRUST) with a single Take-Profit target on each trade.
See how Take-Profit distances increase with price momentum and how Stop-Loss is following the trade reducing the risk!
2) Same intraday trading day for SPY (S&P500 ETF TRUST) with 3 Take-Profit targets with static Stop-Loss.
3) Same intraday trading day for SPY (S&P500 ETF TRUST) with 3 Take-Profit targets with dynamic Stop-Loss.
You can see how Stop-Loss was moved once TP1 is taken!
===========================================================================
Trade Analysis and Cleanup Settings
---------------------------------------------------------------------------
>>>>> Candle Analysis | Candle Color signal confirmation: If closed candle bar color does not match the signal direction > no trade will be open.
>>>>> Candle Analysis | Skip opposite candle signals: If closed candle bar color will match the signal direction, but candle structure will be opposite (for example: bearish green hammer, long high stick on top of a small green square) > no trade will be open.
>>>>> Candle Analysis | Skip doji candle signals: If closed candle bar will be the uncertain doji > no trade will be open.
>>>>> Divergence/Oscillator Analysis | EWO (Elliot Wave Oscillator) signal confirmation: LONG will only be open if at signal, EWO is green or will be at bullish slope (you can select which setting you desire), SHORT if EWO is red or will be at bearish slope.
>>>>> Divergence/Oscillator Analysis | VWAP signal confirmation: LONG will only be open if at signal, the price will be above VWAP, SHORT if below.
>>>>> Divergence/Oscillator Analysis | Moving Average signal confirmation: LONG will only be open if at signal, the price will be above selected Moving Average, SHORT if below.
>>>>> Divergence/Oscillator Analysis | ATR signal confirmation: LONG will only be open if at signal, the price will be above ATR, SHORT if below.
>>>>> Divergence/Oscillator Analysis | RSI + MACD signal confirmation: LONG will only be open if at signal, RSI + MACD will be bullish, SHORT if RSI + MACD will be bearish.
>>>>> Volume signal confirmation: LONG/SHORT will only be open if closing candle volume is 150% above average Volume based on the Volume Length.
===========================================================================
Alert Settings (you don’t have to touch this section unless you will be using TradingView alerts through a Webhook to use with trading bot)
---------------------------------------------------------------------------
Here is how a LONG OPEN alert looks like (each label is customizable + I can add up more items/labels if needed):
COIN: BTCUSD
TIMEFRAME: 15M
LONG: OPEN
ENTRY: 20000
TP1: 20500
TP2: 21000
TP3: 21500
SL: 19000
Leverage: 0
===========================================================================
Adding Alerts in TradngView
---------------------------------------------------------------------------
-Right-click anywhere on the TradingView chart
-Click on Add alert
-Condition: Select this indicator by it’s name
-Alert name: Whatever you want
-Hit “Create”
-Note: If you change ANY Settings within the indicator – you must DELETE the current alert and create a new one per steps above, otherwise it will continue triggering alerts per old Settings!
===========================================================================
If you have any questions or issues with the indicator, please message me directly via TradingView.
---------------------------------------------------------------------------
Good Luck! (NOTE: Trading is very risky, past performance is not necessarily indicative of future results, so please trade responsibly!)

@tk · fractal rsi levels█ OVERVIEW
This script is an indicator that helps traders to identify the RSI Levels for multiple fractals wherever the current timeframe is. This script was based on RSI Levels, 20-30 & 70-80 by abdomi indicator, that calculates the Relative Strenght Index levels based on the asset's price and plots it into the chart, creating a "wave" style indicator. The core feature of this indicator is the fractal rays, so trader can visualize each of the oversold and overbought levels of multiple timeframe on the current timeframe that he is on. The indicator will plots multiple rays after the chart bars. indicating where is the oversold and overbought levels for others fractals.
█ MOTIVATION
Since the RSI Levels, 20-30 & 70-80 by abdomi indicator helps a lot to identify the possible price levels when the asset is oversold or overbought, I saw myself drawing multiple horizontal lines on these levels in lower timeframes so, in an uptrend or downtrend, I can try to get a pullback of these trends when the asset reaches oversold or overboght levels. So, I get the idea to make those lines visible in multiple timeframes so I don't need to draw it myself manually anymore.
█ CONCEPT
The trading concept to use this indicator is the concept to make entries on uptrend or downtrend pullbacks when the asset price reaches oversold or overbought levels. But this strategy don't works alone. It needs to be aligned together with others indicators like Exponential Moving Averages, Chart Patterns, Support and Resistance, and so on... Even more confluences that you have, bigger are your chances to increase the probability for a successful trade. So, don't use this indicator alone. Compose a trading strategy and use it to improve your analysis.
█ CUSTOMIZATION
This indicator allows the trader to customize the following settings:
GENERAL
Text size
Changes the font size of the labels to improve accessibility.
Type: string
Options: `tiny`, `small`, `normal`, `large`.
Default: `small`
RSI LEVELS · SETTINGS
Pre-oversold Level
Changes the RSI Level to calculate the "pre-oversold" price level on the chart.
Type: int
Min: 1
Max: 49
Default: 33
Pre-overbought Level
Changes the RSI Level to calculate the "pre-overbought" price level on the chart.
Type: int
Min: 51
Max: 100
Default: 67
Show "Pre-over" Levels
Enables / Disables the pre-oversold and pre-overbought levels on the chart.
Type: bool
Default: true
FRACTAL RAYS · SETTINGS
Length
Changes the base length for the RSI calculation.
Type: int
Min: 1
Default: 14
Source
Changes the base source for the RSI calculation.
Type: float
Default: close
FRACTAL RAYS · STYLE
Ray Color
Changes the color of all fractal rays and its label.
Type: color
Default: color.rgb(187, 74, 207)
Ray Style
Changes the style of all fractal rays.
Type: string
Options: `line.style_solid`, `line.style_dashed`, `line.style_dotted`
Default: line.style_dotted
Ray Length
Changes the length of all fractal rays.
Type: int
Default: 15
FRACTAL RAYS · OVERSOLD
Oversold Level
Changes the base RSI Level for fractal rays calculation.
Type: int
Min: 1
Default: 30
Oversold Prefix
Customizes the fractal ray label with a prefix text.
Type: string
Default: 🚀
Oversold Suffix
Customizes the fractal ray label with a suffix text.
Type: string
Default: (empty)
FRACTAL RAYS · OVERBOUGHT
Overbought Level
Changes the base RSI Level for fractal rays calculation.
Type: int
Min: 1
Default: 70
Overbought Prefix
Customizes the fractal ray label with a prefix text.
Type: string
Default: 🐻
Overbought Suffix
Customizes the fractal ray label with a suffix text.
Type: string
Default: (empty)
FRACTAL RAYS · VISIBILITY RULES
These rules are applied for each of fractal rays so, the traders can choose what timeframes they wants to show the fractal rays for each of it. The rule will be applied as the following condition: `if timeframe != CURRENT_TIMEFRAME and timeframe <= CHOSEN_OPTION`. Actually, the fractal rays are on the chart but, isn't visible because it was applied a transparent color, so it is visually not on the chart to prevent chart's over polution.
LABELS
Show Labels on Price Scale
Shows labels on price scale.
Type: bool
Default: false
Show Price on Fractal Rays
Shows the RSI Level price on each of fractal rays respectively.
Type: bool
Default: false
█ EXTERNAL LIBRARIES
This script uses the `tk` library to calculate RSI Levels. It is a library that contains various functions that helps pine script developers to calculate RSI Levels.
█ FUNCTIONS
The library contains the following functions:
fn_fractalVisibilityRule(string visibilityRule)
Converts the fractal rays timeframe visibility rule label to timestamp int.
Parameters:
visibilityRule: (string) Fractal ray visibility rule label.
Returns: (int) Fractal ray visibility rule timestamp.
fn_requestFractal(string period, expression)
Converts the fractal rays timeframe visibility rule label to timestamp int.
Parameters:
period: (string) Timeframe period for the desired fractal.
expression: (mixed) Security expression that will be applied for calculation.
Returns: (mixed) A result determined by expression.
fn_plotRay(float y, string label, color color, int length)
Plots ray after chart bars for the current time.
Parameters:
period: (string) Timeframe period for the desired fractal.
expression: (mixed) Security expression that will be applied for calculation.
Returns: (void) This function only plots the elements into the chart
fn_plotRsiLevelRay(simple string period, simple int level, color color)
Plots RSI Levels ray after chart bars for the current time.
Parameters:
period: (simple string) Timeframe period.
level: (simple int) Relative Strength Index level.
color: (color) The color of both, ray and label text.
Returns: (void) This function only plots the elements into the chart

[SMA Cross + HHLL] Signal Clean Up Analysis with Backtest (TSO) This is a DEMO indicator with a simple 2 SMAs cross for signals + HHLL for TP/SL. It mainly demonstrates chained (NOTE: You can select several or ALL of the features, this is not limited to either one) signal cleanup and analysis approach with scheduling and alerting capabilities. Works with most popular timeframes: 1M, 5M, 15M, 1H, 4H, D.
===========================================================================
Here are some pre-set examples with nice Backtesting results (try em out!):
---------------------------------------------------------------------------
>>> Indexes – SPY (INTRADAY SETUP ): Timeframe: 5M | Trading Schedule: ON, 10:00-15:45 ET, EOD: At Market Close | Trading System: Open Until Closed by TP or SL | MULTIPROFIT: TP (take profit) System: Dynamic | MULTIPROFIT: SL (stop loss) System (This is only for “Dynamic” TP System ONLY!!!): Dynamic | # of TPs: 5 | Skip opposite candle types in signals, which are opposite to direction of candle color (for example: bearish green hammer) | Everything else: Default
>>> Bitcoin – BTCUSD (24/7 SETUP): Timeframe: 1H | Trading Schedule: OFF, End of Day (EOD): OFF | Trading System: Open Until Closed by TP or SL | MULTIPROFIT: TP (take profit) System: Dynamic | MULTIPROFIT: SL (stop loss) System (This is only for “Dynamic” TP System ONLY!!!): Dynamic | # of TPs: 3 | TP(s) Offset: on, TP(s) offset amount: 50 | ATR confirmation | Everything else: Default
===========================================================================
Explanation of all the Features | Configuration Guide | Indicator Settings
---------------------------------------------------------------------------
---------------------------------------------------------------------------
Signal cleanup analysis:
---------------------------------------------------------------------------
>>> Customizable Backtesting for a specific date range, results via TradingView strategy, which includes “Deep Backtesting” for largest amounts of data on trading results.
>>> Trading Schedule with customizable trading daily time range, automatic closing/alert trades before Power Hour or right before market closes or leave it open until next day.
>>> 3 Trading Systems.
>>> Static/Dynamic Take-Profit setups (HILIGHT: momentum catch dynamic Take-Profit approach).
>>> Static/Dynamic Stop-Loss setups (HIGHLIGHT: smart trailing Stop-Loss which minimizes risk).
>>> Single or Multiple profit targets (up to 5).
>>> Take-Profit customizable offset feature (set your Take-Profit targets slightly before everyone is expecting it!).
>>> Candle bar signal analysis (skip opposite structured and/or doji candle uncertain signals).
>>> Additional analysis of VWAP/EMA/ATR/EWO (Elliot Wave Oscillator)/Divergence MACD+RSI signal confirmation (clean up your chart with indicator showing only the best potential signals!).
>>> Advanced Alerts setup, which can be potentially setup with a trading bot over TradingView Webhook (NOTE: This will require advanced programming knowledge).
>>> Customize your signal SOURCE and your Take-Profit/Stop-Loss SOURCES as you desire.
===========================================================================
Labels, plots, colors explanations:
---------------------------------------------------------------------------
>>>>> Signal SOURCE: SMA crossings (green and red BIG circles) .
>>>>> Take-profit/Stop-loss SOURCE: HHLL (Highest High Lowest Low) .
>>>>> LONG open: green arrow below candle bar.
>>>>> SHORT open: red arrow above candle bar.
>>>>> LONG/SHORT take-profit target: green/red circles (multi-profit > TP2/3/4/5 smaller circles).
>>>>> LONG/SHORT take-profit hits: green/red diamonds.
>>>>> LONG/SHORT stop-loss target: green/red + crosses.
>>>>> LONG/SHORT stop-loss hits: green/red X-crosses.
>>>>> LONG/SHORT EOD close (profitable trade): green/red squares.
>>>>> LONG/SHORT EOD close (loss trade): green/red PLUS(+)-crosses.
===========================================================================
Date Range and Trading Schedule Settings
---------------------------------------------------------------------------
>>>>> Date Range: Select your start and/or end dates (uncheck “End” for indicator to show results up to the very moment and to use for LIVE trading) for backtesting results, if not using backtesting – uncheck “Start”/“End” to turn it off.
---------------------------------------------------------------------------
>>>>> Use TradingView “Strategy Tester” to see backtesting results
---------------------------------------------------------------------------
NOTE: If Strategy Tester does not show any results with Date Ranged fully unchecked, there may be an issue where a script opens a trade, but there is not enough TradingView power to set the Take-Profit and Stop-Loss and somehow an open trade gets stuck and never closes, so there are “no trades present”. In such case you will need to manually check “Start”/“End” dates or use “Depp Backtesting” feature!
---------------------------------------------------------------------------
>>>>> Trading Schedule: This is where you can setup Intraday Session or any custom session schedule you wish. Turn it ON. Select trading hours. Select EOD (End of Day) setting (NOTE: If it will be OFF, the indicator will assume you are holding your position open until next day!).
>>>>> Trading System: 1) Open Until Closed by TP or SL – once the trade is open, it can only be closed by Take-Profit, Stop-Loss or at EOD (if turned on) ||| 2) OCA – Opposite Trade will Open Closing Current Trade – Same as 1), except that when and if an OPPOSITE signal is received > indicator will close current trade immediately (profit or loss) and open a new one(NOTE: This will only happen with an OPPOSITE direction trade!) ||| 3) Open Until Opposite Signal or EOD (if turned on) – This approach is the simplest one, there are no Take-Profits or Stop-Losses, the trade is open until an OPPOSITE signal is received or until EOD (if turned on).
Take-Profit, Stop-Loss and Multi-Profit Settings
>>>>> MULTIPROFIT | TP (Take-Profit) System: 1) Static – Once the trade is open, all Take-Profit target(s) are immediately calculated and set for the trade > once the target(s) is hit > trade will be partially closed (if candle bar closes beyond several Take-Profit targets > trade will be reduced accordingly to the amount of how many Take-Profit targets were hit) ||| 2) Dynamic – Once the trade is open, only the 1st Take-Profit target is calculated, once the 1st Take-Profit is hit > next Take-Profit distance is calculated based on the distance from trade Entry to where 1st Take-Profit was taken, once 2nd Take-Profit is taken > 3rd Take-Profit is calculated per same logic, these are good for price momentum as with price speeding up – profits increase as well!
NOTE: Below 2 settings, each correspond to only 1 setting of the TP (Take-Profit) System, please pay attention to the above TP system setting before changing SL settings!
>>>>> MULTIPROFIT | SL (Stop-Loss) System : 1) Static – Once the trade is open, Stop-Loss is calculated and set for the remaining of the trade ||| 2) Dynamic – At trade open, Stop-Loss is calculated and set the same way, however once 1st Take-Profit is taken > Stop-Loss is moved to Entry, reducing the risk.
>>>>> MULTIPROFIT | SL (Stop-Loss) System : 1) Static - Once the trade is open, Stop-Loss is calculated and set for the remaining of the trade ||| 2) Dynamic – At trade open, Stop-Loss is calculated and set the same way, however with each Take-Profit taken, Stop-Loss will be moved to previous Take-Profit (TP1 taken > SL:Entry | TP2 taken > SL:TP1 | TP3 taken > SL:TP2 | TP4 taken > SL:TP3 | TP5 taken > trade closed), this is basically a smart Stop-Loss trailing system!
>>>>> # of TPs (number of take profit targets): Just like it is named, this is where you select the number of Take-Profit targets for your trading system (NOTE: If “3) Open Until Opposite Signal or EOD (if turned on)” Trading System is selected, this setting won’t do anything, since there are no TP or SLs for that system).
>>>>> TP(s) offset: This is a special feature for all Take-Profit targets, where you can turn on a customizable offset, so that if the price is almost hitting the Take-Profit target, but never actually touches it > you will capture it. This is good to use with HHLL (Highest High Lowest Low), which is pretty much a Support/Resistance as often the price will nearly touch these strong areas and turn around…
---------------------------------------------------------------------------
Dynamic/Static Take-Profit and Stop-Loss visual examples:
1) Fully Dynamic Take-Profit and Stop-Loss setup for BTCUSD
See how Take-Profit distances increase with price momentum and how Stop-Loss is following the trade reducing the risk!
2) Static/Dynamic, Static Take-Profit and Dynamic Stop-Loss setup for SPY (S&P500 ETF TRUST)
You can see a static Take-Profit set at position open, while Stop-Loss is semi-dynamic adjusting to Entry once TP1 target is taken!
3) Fully Static Take-Profit and Stop-Loss setup for SPY (S&P500 ETF TRUST)
This one is a fully static setup for both Take-Profit and Stop-Loss, you can also observe how trade is closed right before the Power Hour (trade can be closed right before Power Hour or right before Market Closes or left overnight as you desire).
---------------------------------------------------------------------------
Trade Analysis and Cleanup Settings
>>>>> Candle Analysis | Candle Color signal confirmation: If closed candle bar color does not match the signal direction > no trade will be open.
>>>>> Candle Analysis | Skip opposite candle signals: If closed candle bar color will match the signal direction, but candle structure will be opposite (for example: bearish green hammer, long high stick on top of a small green square) > no trade will be open.
>>>>> Candle Analysis | Skip doji candle signals: If closed candle bar will be the uncertain doji > no trade will be open.
>>>>> Divergence/Oscillator Analysis | EWO (Elliot Wave Oscillator) signal confirmation: LONG will only be open if at signal, EWO is green or will be at bullish slope (you can select which setting you desire), SHORT if EWO is red or will be at bearish slope.
>>>>> Divergence/Oscillator Analysis | VWAP signal confirmation: LONG will only be open if at signal, the price will be above VWAP, SHORT if below.
>>>>> Divergence/Oscillator Analysis | Moving Average signal confirmation: LONG will only be open if at signal, the price will be above selected Moving Average, SHORT if below.
>>>>> Divergence/Oscillator Analysis | ATR signal confirmation: LONG will only be open if at signal, the price will be above ATR, SHORT if below.
>>>>> Divergence/Oscillator Analysis | RSI + MACD signal confirmation: LONG will only be open if at signal, RSI + MACD will be bullish, SHORT if RSI + MACD will be bearish.
===========================================================================
Alert Settings (you don’t have to touch this section unless you will be using TradingView alerts through a Webhook to use with trading bot)
---------------------------------------------------------------------------
Here is how a LONG OPEN alert looks like (each label is customizable + I can add up more items/labels if needed):
COIN: BTCUSD
TIMEFRAME: 15M
LONG: OPEN
ENTRY: 20000
TP1: 20500
TP2: 21000
TP3: 21500
SL: 19000
Leverage: 0
===========================================================================
Trade Open Signal SOURCE + Take-Profit/Stop-Loss SOURCE
---------------------------------------------------------------------------
>>> Customize your signal SOURCE, Take-Profit and Stop-Loss SOURCE as desired (NOTE: These are pre-configured and should be usable on majority of markets, however feel free to play around with these settings as there is nearly an infinite amount of setups out there!
===========================================================================
Adding Alerts in TradngView
---------------------------------------------------------------------------
-Right-click anywhere on the TradingView chart
-Click on Add alert
-Condition: Select this indicator by it’s name
-Alert name: Whatever you want
-Hit “Create”
-Note: If you change ANY Settings within the indicator – you must DELETE the current alert and create a new one per steps above, otherwise it will continue triggering alerts per old Settings!
===========================================================================
If you have any questions or issues with the indicator, please message me directly via TradingView.
---------------------------------------------------------------------------
Good Luck! (NOTE: Trading is very risky, so please trade responsibly!)

Moving Averages + BB & R.VWAP StDev (multi-tf)█ Moving Averages + Bollinger Bands and Rolling Volume Weighted Average Price with Standard Deviation Bands (Multi Timeframe)
Multiple moving averages can be independently applied.
The length , type and timeframe of each moving average are configurable .
The lines and colors are customizable too.
This script can display:
Moving Averages
Bollinger Bands
Rolling VWAP and Standard Deviation Bands
Types of Moving Averages:
Simple Moving Average (SMA)
Exponential Moving Average (EMA)
Smoothed Moving Average (SMMA)
Weighted Moving Average (WMA)
Volume Weighted Moving Average (VWMA)
Least Squares Moving Average (LSMA)
Hull Moving Average (HMA)
Arnaud Legoux Moving Average (ALMA)
█ Moving Average
Moving Averages are price based, lagging (or reactive) indicators that display the average price of a security over a set period of time.
A Moving Average is a good way to gauge momentum as well as to confirm trends, and define areas of support and resistance.
█ Bollinger Bands
Bollinger Bands consist of a band of three lines which are plotted in relation to security prices.
The line in the middle is usually a Simple Moving Average (SMA) set to a period of 20 days (the type of trend line and period can be changed by the trader, a 20 day moving average is by far the most popular).
The SMA then serves as a base for the Upper and Lower Bands which are used as a way to measure volatility by observing the relationship between the Bands and price.
█ Rolling VWAP
The typical VWAP is designed to be used on intraday charts, as it resets at the beginning of the day.
Such VWAPs cannot be used on daily, weekly or monthly charts. Instead, this rolling VWAP uses a time period that automatically adjusts to the chart's timeframe.
You can thus use the rolling VWAP on any chart that includes volume information in its data feed.
Because the rolling VWAP uses a moving window, it does not exhibit the jumpiness of VWAP plots that reset.
Based on the previous script :

Multi-Symbol Cross Indicator Template - Unleash Your Potential!Unlock your full trading potential with this powerful and versatile Multi-Symbol Cross Indicator Template! This script is designed to make you stand out from the crowd by enabling you to monitor multiple symbols on a single chart for specific events, such as a Golden Cross or Death Cross. With its high adaptability to include various technical indicators, you're in complete control of your trading decisions and market analysis.
By using the built-in request.security function, this template fetches data for your chosen symbols from the selected exchange and calculates the conditions (e.g., moving average crossovers) for each symbol. Although the current implementation focuses on Golden Crosses and Death Crosses, the sky is the limit when it comes to modifying the script to incorporate other technical indicators such as RSI, MACD, or Bollinger Bands.
You, as a discerning trader, can easily customize the script by selecting your preferred exchange and symbols through input options. This flexibility allows you to monitor your favorite markets without the need for any direct code modification, giving you the ultimate adaptability for various trading strategies and market analysis purposes.
Remember, this script is more than just an example or template; it's the key to unleashing your inner trading genius. While it's not intended to be a standalone trading strategy, it serves as the foundation for you to build upon and create your own customized multi-symbol indicators or strategies. You are awesome, and with this Multi-Symbol Cross Indicator Template, there's no doubt that you're on the path to achieving great success in your trading journey!

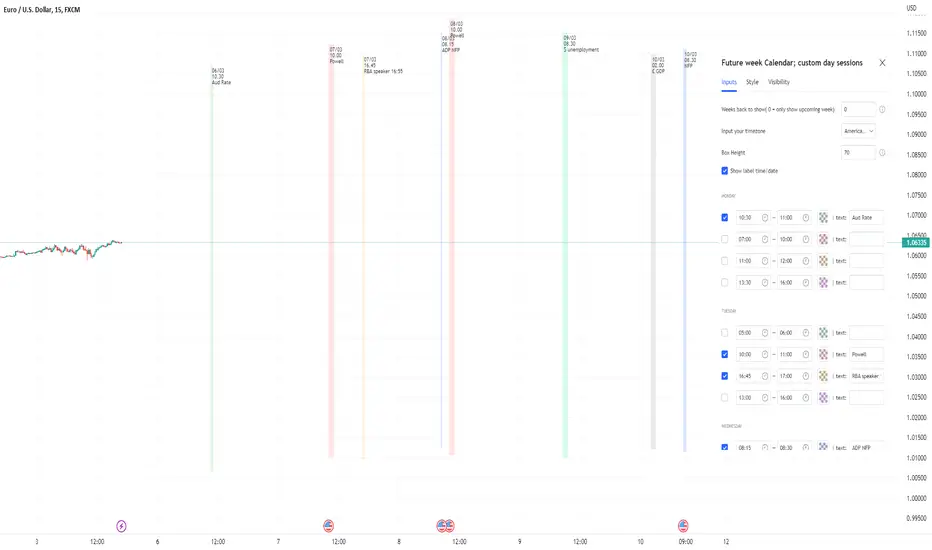
Future week Calendar; Each day's custom sessions & LabelsOn-Chart Calendar for the week ahead with 4x customizable intraday sessions (each day with it's own unique sessions)
-add your own text labels and optional time/date stamps to each session; for key events of the week.
-toggle on/off each individual session.
-Choose number of weeks of history to show (default is 0: only show upcoming week.
-Works on BTC too (includes Saturday/Sunday sessions).
//Notes//
~timestamps and labels anchor to the start of the session box
~when using with default 'weeks back to show' = 0; Session boxes will disappear as price passes through their right hand side.
~to remove the very long indicator status line (due to so many sessions): Go to chart settings >> status line, and under 'indicator' toggle off 'arguments'
Example usage: Each day's 4x custom sessions showing; only upcoming week; no labels
Example usage: Each day's 4x custom sessions showing; Showing 1 week of history too; no labels
Customizable Moving Average RibbonThis indicator is a highly customizable moving average ribbon with some unique features.
This script can utilize multiple unique sources, including a non-repainting renko closing price. Renko charts focus solely on price movement and minimize the impacts of time and the extra noise time creates. Employing the renko close helps smooth out the MA ribbon. Insignificant price movements will not cause a change in the plotted lines of the indicator unless a new threshold is breached or a "brick" is created. This is highly useful for quickly identifying consolidation areas or overall flat price movement.
There are two methods for selecting the box size when utilizing the renko source. Box size is critical for the overall function and efficacy of the plots you will visually see with this indicator. Box size is set automatically using the Average True Range "ATR" or manually using the "Traditional" setting. The simplest way to determine a manual box size is to take the ATR of the given instrument and round it to the nearest decimal place. As an example, if the ATR for the asset is 0.18, you would round that number to 0.2 and utilize this as your traditional box size.
The MA ribbon contains eleven adjustable moving average lines. Users can choose to turn off as many as they would like. Users can also adjust the length of the individual moving averages and the source for all moving averages. There are nine types of moving averages to choose from for the ribbon. The MA options are:
Exponential Moving Average = 'EMA'
Double Exponential Moving Average= 'DEMA'
Triple Exponential Moving Average = 'TEMA'
Simple Moving Average = 'SMA'
Relative Moving Average = 'RMA'
Volume Weighted Moving Average = 'VWMA'
Weighted Moving Average = 'WMA'
Smoothed Simple Moving Average = 'SSMA'
Hull Moving Average = 'HULL'
We believe that the ribbons features, including the line color change, help quickly identify trends and give users optimum customization. Users can select from five different color schemes including:
Green/Red
Purple/White
White/Blue
Silver / Orange
Teal/ Orange

Custom HTF candle overlay, ICT True Day-input your own session time for custom 'daily' or HTF candles to overlay on your lower time frame charts.
-based on ICT's notion of 'True Day'.
-customize the HTF candles to any start/end time.
-set lookback period/cutoff in days (i.e. backtesting vs only viewing recent price action).
-option to toggle on/off custom opening price line.
-works across all lower time frames.
~useful for visualizing the chunks of the day where the action tends to happen.
~useful for other session times intraday; to be visualized as a single custom HTF candle.

HTF Tool 2HTF Tool 2: Because the previous version was removed for being too powerful.
HTF Tool allows Users to display Higher Timeframe(HTF) Candles on their Chart with retracement lines drawn from the (High/Low) range of the HTF candle, as well as a live HTF MA.
This indicator perfectly handles Requested data to display a non-lagging HTF Moving Average(MA) by bridging a solid historical data stream with the live data stream.
This is done by offsetting plot data backwards to the middle of the last HTF candle, and then drawing a line from the last candle middle, to the live candle middle.
I have manipulated the data display to give the appearance that it consists of only 1 plot line, Whereas in reality, The HTF MA consists of 3 different processes:
- 1 historical plot value, to display the (correct) historical EMA with the same plot points you would see on the HTF chart from the same ema.
- 1 live line, re-drawn at every tick to mimic the way plot values move around while the bar is live.
- 1 live plot value, that is only displayed as a number on the status line and price scale to make it look like these are the outputs from the constantly redrawing line.
Because of this, This indicator displays the exact same way you would see this data on the requested timeframe's chart .
Note: You will see 2 values on the status line, these are the Historic MA, and Live MA values (Left, Right).
When hovering over historic values, a Historic MA value will only display in the middle of the HTF bars (same bar as the HTF wick)
This indicator include:
- HTF Candles, Drawn in the Traditional Candlestick Fashion.
- A User Adjustable HTF EMA / SMA , This Moving Average is accurate the the display you would see on a HTF chart.
- User Adjustable Retracement lines, up to 3 levels. These levels dynamically delete when price crosses them.
- Adjustable Display Range to display more or less HTF candles.
- Toggleable "Safe Mode" to keep the indicator display looking clean at all times.*
All Colors are Customizable to fit your layout style (Candle, Levels, HTF MA)
*Safe mode checks that your current chart's timeframe cleanly multiplies into your requested timeframe an odd number of times. This keeps the HTF candle wicks perfectly centered, and keeps the candle body width perfectly consistent.
If you choose to turn safe mode off here are some things to consider:
All Vertical data is consistent with the HTF requested , ONLY the horizontal alignment of the indicator will be thrown off.
When on low timeframes requesting other relatively low timeframes these issues are extremely more apparent than when requesting substantially larger timeframes.
Example: Safe Mode will likely need to be turned off for any 4h chart request, but as seen in the following image, the bars still look very normal.
Note: If you ONLY want to see the Levels and Moving Average... You ARE capable of requesting the current chart's timeframe. If you do this, the indicator will stop drawing the HTF candles, since your chart already shows that timeframe's candles.
Enjoy!
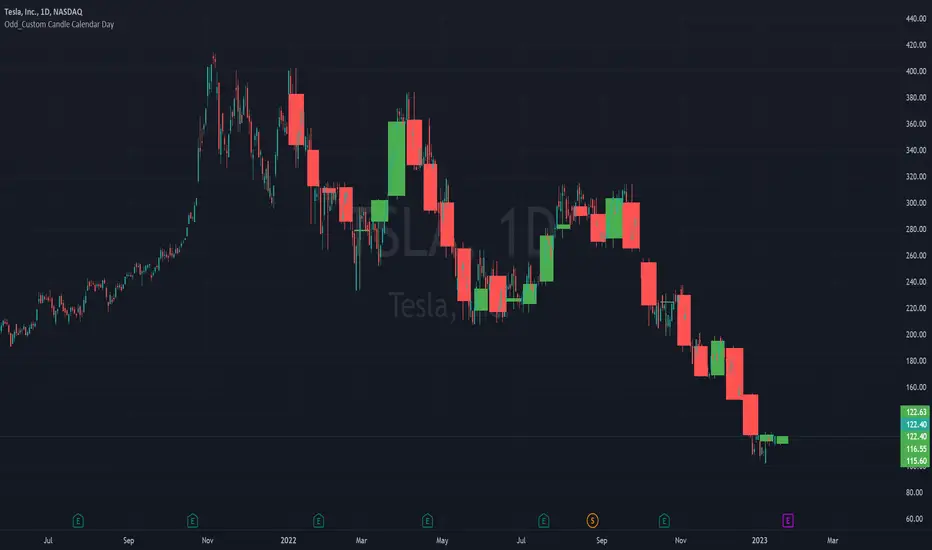
Odd_Custom Candle Calendar DayEver wonder how candles would look on a chart if they were tracked by calendar day instead of market days?
Option(s)-
📅Custom start date for candle formation
✖️Candle multiplier
🌈Up / Down Colors
Features-
📋Displays candle data with invisible plots
Use Move to Existing Pane to Overlay on chart.
Can only display a max of 500 candles!
Dynamic Highest Lowest Moving AverageSimilar to my last script, although this one uses the RSI value of
(highest high - price) / (price - lowest low)
to feed into the the logic creating the dynamic length. Choose how the length curve works by selecting either Incline, Decline, Peak or Trough.
Lastly select the moving average type to filter the result through to smoothen things out a bit
to find something that works for your strategy. This is useful as an entry/exit indicator along with other moving averages, or even just a standalone if you play with the settings enough.
Opening Range with Infinite Price TargetsOpening Range with Infinite Price Targets is an ORB indicator that automatically generates price targets into infinity based on a user-defined % of range.
This indicator includes many nice-to-have features missing from other indicators. Such as:
Price Target Labels with Price tooltip, want to know exactly what price pt3 is at? Hover over it and see.
Custom Defined Range time, Set your Range Start and end time to whatever you need, Doesn't have to be pinned to opening range!. Note: Time is in chart time.
Historical View (Default off), Tired of your chart looking messy with a ton of lines from historical data? No problem! You can choose to view or not view historical data.
Alerts for Range Breaks, First Range Breaks, and Discovery Price Target hits. As well as Exported Values for Range High, Low, and Mean to set your own alerts from custom sources.
Custom Price Targets, set your price targets to a % of the range based on your own strategy.
Last but not Least, Infinitely Generating Price Targets. They just keep building. New Targets will be generated when the price closes above/below the current farthest target.
Enjoy!

Tunable SWMADissected the standard SWMA function and added options for user to change just about every part of it. Weights ,Lookback ,Source can all be changed in the settings.
Green is the standard SWMA, Using the Input value selected.(MAs/LRC/VWAP)
Red is the tuned SWMA, with the option of applying a final Output filter (MAs/LRC/VWAP). Uses 8 datapoints instead of 4 for the default.
Customization can really help expand upon the standard SWMA I find. Enjoy tuning to your hearts content

Volume/Market ProfileVolume/Market Profile is a 2 in 1 Volume Profile and Market Profile Indicator.
This indicator is my own calculations for compiling a volume profile and market profile.
The profile is progressively calculated live as the chart develops.
I have made use of both Boxes AND Lines to allow me to display a finer granularity profile by displaying up to twice the max amount of lines allowed in tradingview.
I have spent a lot of time to make sure the values are getting appended exactly as intended so that I can assure this profile is operating as precisely as possible within the limitations of the data available.
To make my calculations easier to use in other places, I have made my volume profile a function that can be extracted and used whenever you need values from a volume profile.
Feel free to read through the script if you don't understand how this profile is developed. I have made a commentary of my volume profile function to help you understand what exactly happens to compile the profiles.
As mentioned before, This indicator doubles as a market profile. To view both at the same time you will need to add the indicator on your chart twice.
I have built in comprehensive customizations to allow you to display your profiles however fits your needs.
Timeframe: The aggregation period for profiles, to see a 1 week profile, change the timeframe to 1 week.
Note: You can add custom timeframes by adding a custom timeframe in your chart timeframe dropdown menu. When you add timeframes in this area, they appear as options within indicators with the timeframe input.
Sensitivity: Allows for greater or less granularity changes. The calculation method for granularity automatically changes depending on the range of your chart.
Note: Multiply this value by 100 and that will be the max range (in ticks) of your price before the indicator automatically adjusts to make the profile less granular. (ex. If price ranges $1, and 1 tick is $0.01, granularity will be 0.01 with a sensitivity of 1+)
Value Area %: % of total volume to display as the value zone. (_% of total profile values are contained within the value zone)
Calculate as Market Profile: Uses a 1 Instead of the candle volume, to display a Market Profile. (If selected POC -> TPOC)
Display Size: Sets the # of bars from the profile axis to the profile's max value. If set negative, profile will be displayed left of axis, if positive, profile will be displayed to the right of the axis.
Display Offset: Sets the # of bars in front(or behind) the current chart bar to set the axis of the profile. If negative, the axis will be to the left of the current chart bar, if positive the axis will be right of the current chart bar.
Display Historical POC/VAH/VAL: Choose to display historical poc,vah,val lines.
Colors: I'm not explaining colors.
Enjoy!

RSI Influenced AverageUsing a couple of different ways of calculating (User selectable) the standard rsi oscillator is merged with a moving average for a slight variation. Plenty of options in the settings to play with like changing rsi length, MA length, lookback lengths, MA type, and much more. For Use with other moving averages ideally, or as a standalone indicator.

Custom IndexEnables users to create their own custom Stock Index with up to 29 tickers! Has included optionality to include/exclude certain sectors, plot sectors individually and measure in gold. Good for having a look at how your favorite tickers have performed (with your modification of course). Also has option to show Moving Averages for your convenience.

Custom Price LineThis indicator lets you freely customize your price line. Choose between static or dynamic colors for falling/rising prices. In addition you can adjust the following:
Line style
Thickness
Length
Direction
It is also possible to mix different designs by using a single indicator.

Tick PlusTick Plus
Tick+ is an all-in-one market internals dashboard.
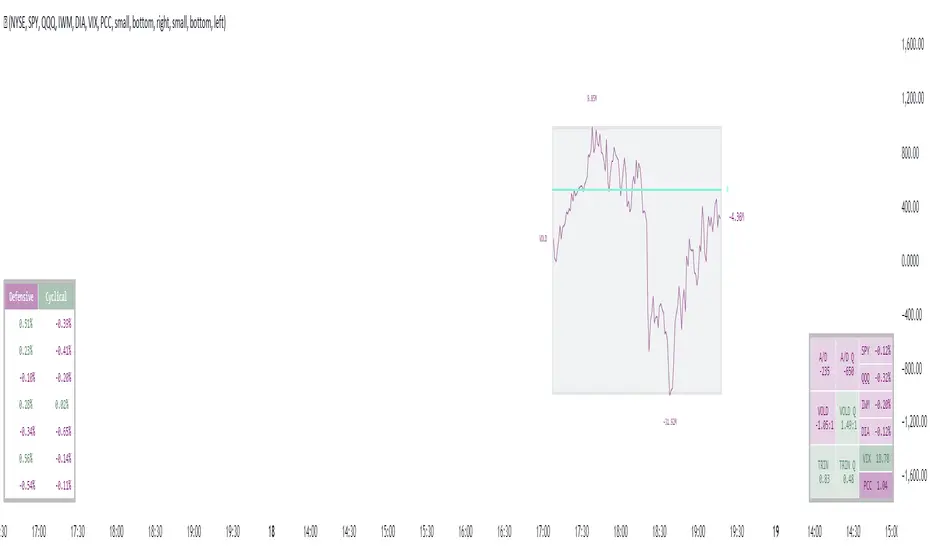
Tick+ features a real-time NYSE or NASDAQ Tick chart, a dynamic Advancers/Decliners vs. VOLD chart, a market internals table readout including both NYSE and NASDAQ instruments, defensive and cyclical sector’s, and daily inflow/out analysis. Also included are customizable symbols readouts, so you can keep an eye on securities that are important to you!
The Tick chart displays a candlestick TICK chart for your chosen exchange and keeps track of the current day's high tick and low tick. Drawn behind these are our Key Reversal Zones.
The Advancers/Decliners vs. VOLD chart dynamically scales both instruments together to easily detect divergences that are known to cut the noise from the market and give an accurate indication of the day's trend.
Market Sync Indicator
This is a small but powerful indicator that analyzes the inflow and outflow of each exchange's underlying securities. When all the markets are in harmony, it will print a green or red symbol below the tick chart. We have also included this signal within the internals table labeled “trending,” which is simply the same signal presented in a more apparent area. Alerts can also be set with these signals to take advantage of the system across tickers.
Note: A gray readout indicates that every market is not moving in the same direction at that moment.
This indicator has been made to be customizable to fit your individual layout style! You are able to stack the Tick & Comparison Charts, as well as display the tables vertically or horizontally!
Note: We are measuring % change of symbols from the daily open to current price, this is so you can make an analysis based on today's info.
All of the default settings are our recommended settings.
Please check the Author Instructions Below for how to gain access to our indicators.
Moving Averages System - DurbtradeMoving Averages System - Durbtrade
1 indicator... customizable.
Displays up to 4 independent Moving Averages (MA's) at once.
Each MA can be 1 of 6 "MA Types" : SMA, EMA, WMA, VWMA, HMA, or DEMA.
There are 7 individual fills...
4 "MA/Source Fills" and 3 "MA/MA Fills".
The "Source" is selectable,
and there is a "Source Plot" option
to display a plot of the source.
No max value for MA "Length".
Each MA has what I call a "Length Multiplier",
and each MA has its own "Offset".
The colors of each MA,
as well as the Source Plot,
can be up/down "Color-Changing", or solid.
"Line Thickness" is unlimited.
Each of the 3 "MA/MA Fills" allow you to select which 2 of the 4 MA's to fill between!
All 7 fills are customizable by above/below colors, and opacity.
All 7 fills include a "Color Swap" option,
in the case that you need to switch the display of the above-color to the below-color,
and the below-color to the above-color!
All plots are scripted to be drawn visually in front of all fills!
Lastly, you can turn off the display of the MA plots and the Source Plot...
allowing the display of only fills!
--------------------------------------------
--------------------------------------------
Let's take a more detailed look!
First, let's go through the settings, and how to use the Moving Averages System.
You can divide the Inputs tab of the indicator settings into 3 main sections...
1 - Moving Averages
2 - Source Plot, and MA/Source Fills
3 - MA/MA fills
Let's discuss the first section, which is where we set up our MA's.
Here, we see the parameters for our 4 Moving Averages :
All 4 MA's can be customized here in the following ways...
- Toggle ON/OFF by checking the checkbox
- Length
- Length Multiplier
- Type (SMA, EMA, WMA, VWMA, HMA, or DEMA)
- Up/Down Color Change ON/OFF
- Line Thickness
- Offset
(The Plot Styles, Up/Down/Solid Colors, and Opacities of all 4 MA's
are customizable under the Style tab of the indicator settings)
There are no maximum value limitations for Length, Line Thickness, and Offset.
Of note, the "Length Multiplier" multiplies the "Length" value by a chosen integer.
This can be used to incrementally scan a wide spectrum of lengths very quickly.
Or it can be used to maintain ratios while increasing the MA display lengths...
just multiply all lengths by the same number.
It can also be used to easily create a moving average ribbon
by using multiple Moving Average Systems all at once.
Or, it can be another method to set up higher-timeframe MA's on a lower-timeframe chart...
for example, if both the chart and indicator are on the 1Hour timeframe,
you can multiply all of your set lengths by 24
to see the 1Day MA's of those same lengths on the 1Hour chart.
Next, lets look at the second section of the Inputs tab of the indicator settings,
where we edit the "Source Plot" and "MA/Source Fills".
We can turn ON/OFF the "Source Plot" -
which plots a line of the "Source" that you have selected -
and edit the parameters :
Checking the "Source Plot" box turns the "Source Plot" ON/OFF.
You can turn Up/Down Color Change ON/OFF,
and adjust Line Thickness and Offset.
(The Plot Style, Up/Down/Solid Colors, and all Opacities of the Source Plot
are customizable under the Style tab of the indicator settings.)
Next is where you can turn ON/OFF and edit each "MA/Source Fill".
Checking the "MA#1/Source Fill" box turns on the fill between MA#1 and the source.
You can choose the color and opacity for the above-color and the below-color.
Need to switch the display of the two colors?... turn on "Color Swap" to easily do just that.
The remaining 3 MA/Source Fills work in the same exact way...
turning on a fill between the associated MA#, and the source.
In total, there are 4 MA/Source Fills... 1 for each MA.
Note that neither the Source Plot, nor any of the MA's, need to be turned on
in order to use the MA/Source Fills.
Finally, lets look at the third section of the Inputs tab of the indicator settings.
This is where we can edit the 3 "MA/MA Fills".
An MA/MA Fill allows you to select any 2 of the 4 MA's that you have set,
and fill the space between them with color :
Checking the MA/MA Fill box turns ON/OFF the associated MA/MA Fill.
Below each ON/OFF switch are 2 boxes where you can select the 2 MA's that you want to fill between.
Select the 2 MA's that you want to use according to their MA#'s.
Next, you have the Above/Below Color/Opacity for the associated MA/MA Fill,
and lastly, the Color Swap option.
The numerical order of the MA#'s that you select here is of no concern,
because each MA/MA Fill has that "Color Swap" option...
and, as before, this swaps the display of the above-color and the below-color.
Note that the MA's do not need to be turned on
in order to use the MA/MA Fills.
--------------------------------------------
Additional Notes :
All colors and opacities of this indicator can be customized.
All fills can have above/below colors, and all plots can have up/down colors.
All fills and plots can be one static color, too.
All plots can be 1 of 10 plot styles:
Line, Line with Breaks, Step Line, Step Line with Diamonds, Histogram,
Cross, Area, Area with Breaks, Columns, or Circles.
All plots use the same single "Source", which is selectable.
And don't forget... you can try applying this indicator to other indicators!
--------------------------------------------
Now, let's take a look at some examples of the Durbtrade Moving Averages System in action!
All 4 MA's plots on, MA Type is SMA, color-changing on, lengths 50, 100, 150, and 200 :
Add the Source Plot, and all 4 MA/Source Fills :
Add the 3 MA/MA fills :
Turn off candles visibility, and turn off MA color-change :
Turn off the MA plots :
Turn off the Source Plot :
...
Here are some other images using the Multi Moving Average Tool :
Here it is on the 1Second :
Here it is on the 3Day :
Here is your 1Day SMA DeathCross :
Use 3 Moving Average Systems at once to build your own EMA Ribbon :
Compare 4 different MA types, all with the same length :
--------------------------------------------
Script Stats :
Pinescript Version : 5
Code Length : 149 Lines
Total Plots : 16
- Visible Plots : 5 (4 MA Plots, 1 Source Plot)
- Invisible Plots : 11 (4 MA Plots, 1 Source Plot, 6 MA/MA Fill Plots)
Total Fills : 7 (4 MA/Source Fills, 3 MA/MA Fills)
Total Colors/Opacities : 29
Total Unique Variables : 92
- Input Variables : 69
- Unique Output Variables : 23
--------------------------------------------
Final Thoughts :
I'm excited to share the Durbtrade Moving Averages System!
I think that this indicator has a wide range of MA-related applications,
an easy-to-use interface with maximum customization, and unique fill features...
all in one indicator.
I feel that it is a quick and useful tool
whether you are just plotting a few moving averages...
or you are creating intense kaleidoscopic tidal waves of colored data!
Either way, I think it is pretty awesome,
and so, I wanted to share it with you...
I hope that you enjoy it and find it useful!
- Please feel free to comment your thoughts, critiques, or suggestions. They are all very helpful!
- Also, please feel free to comment any positive feedback, or awesome screencaps/ideas of the indicator in action!
- Check out my other Pinescript indicators if you like this one... they work well together.
- I hope that you find this script useful.
- Enjoy!
--------------------------------------------
// Durbtrade
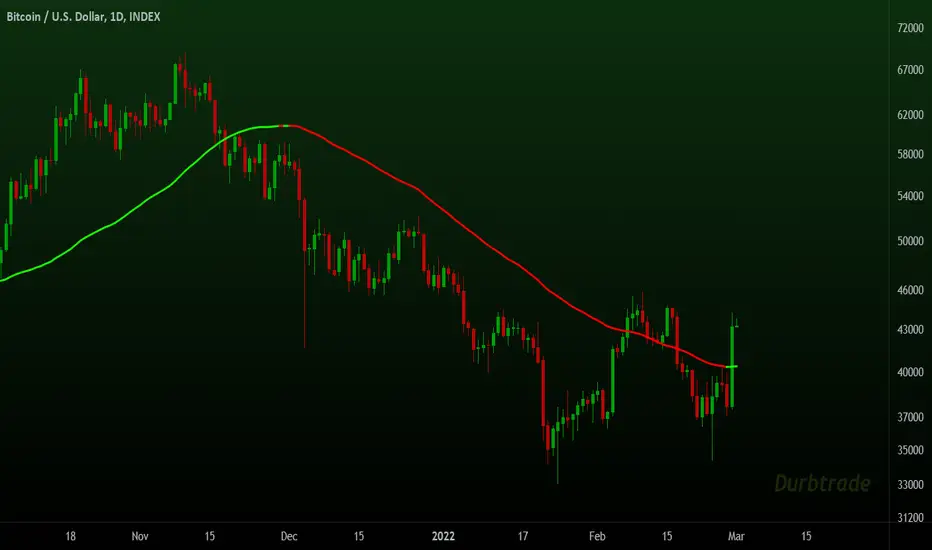
Display CaseDisplay Case is a customizable multiple Indicator package that is usable right out of the box or can be modified to include your favorite oscillators, moving averages, or anything else! The display case dimensions and colors can be user defined in the Settings menu, as well as the candle length and heights of each indicator so they can be stacked separately or together as desired. Finally, color matched labels are generated to easily reference each indicator and its value without having to clog the scale display or reference the Settings. This is a light resource indicator that won't bog your chart, but allow you to easily switch between some of the most popular indicators quickly and easily!
And, besides, what other indicator has a checkerboard floor?!
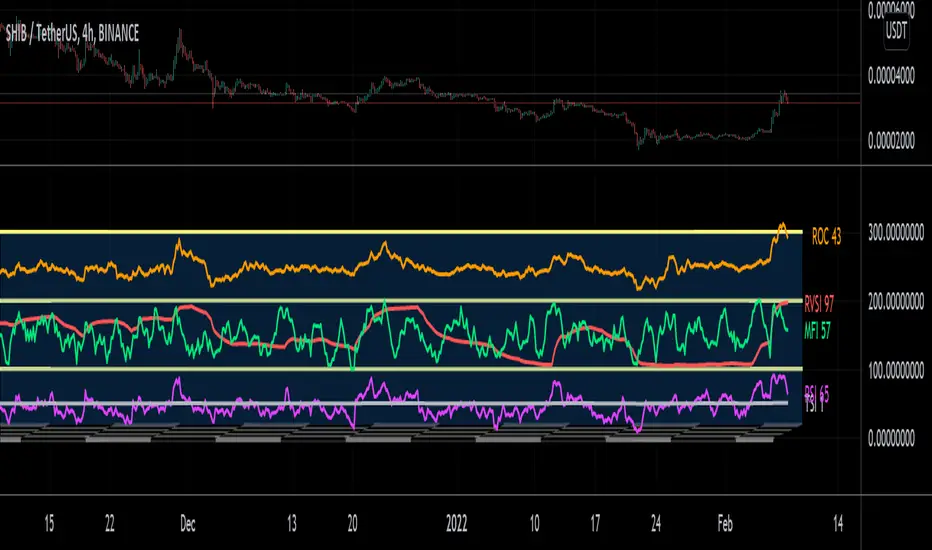
Customizable Gap Finder++█ OVERVIEW
Customizable Gap Finder by ProfessorZoom with a partial close of a gap
█ CONCEPTS
1 — Gaps bullish or bearish
2 — Gaps can be filled
3 — Gaps can be partially close
4 — Some display options
█ OTHER SECTIONS
Thanks to The rational investor for teaching me this and ProfessorZoom because he writes 99% of the script.
Did you know the percentage of gaps filled ? If not, I recommand you to follow his courses, and I have no conflicts of interest.