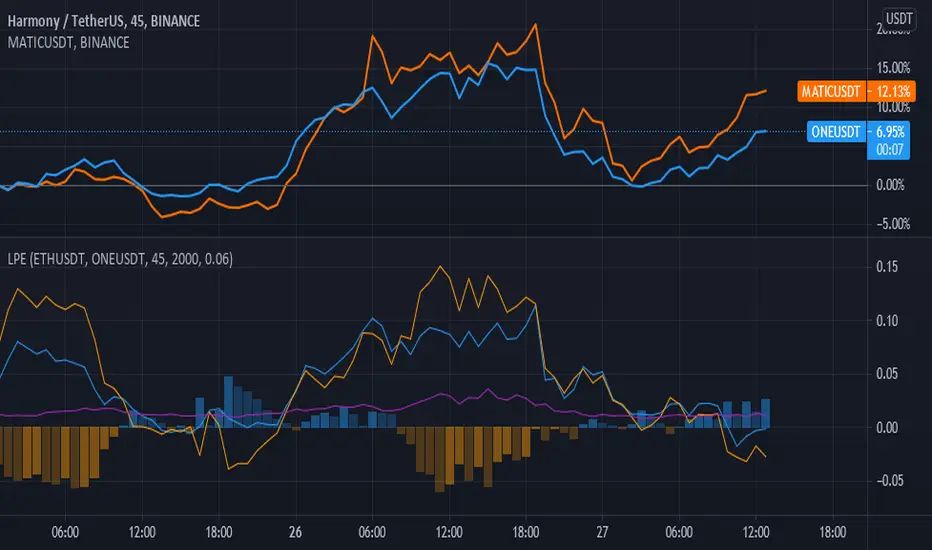
Liquidity Pair EvalWhile there are many tools for generating your impermanent loss in liquidity pools, depending on your choice of chain, I was mostly concerned about monitoring the creep between the pairs. This V0.1 attempt should give us a general comparison of the selected asset returns given your time period and also display the percent loss assuming the initial purchase price values are input correctly.
This is a work in progress and I am open to suggestions to make this even better.
Cripto
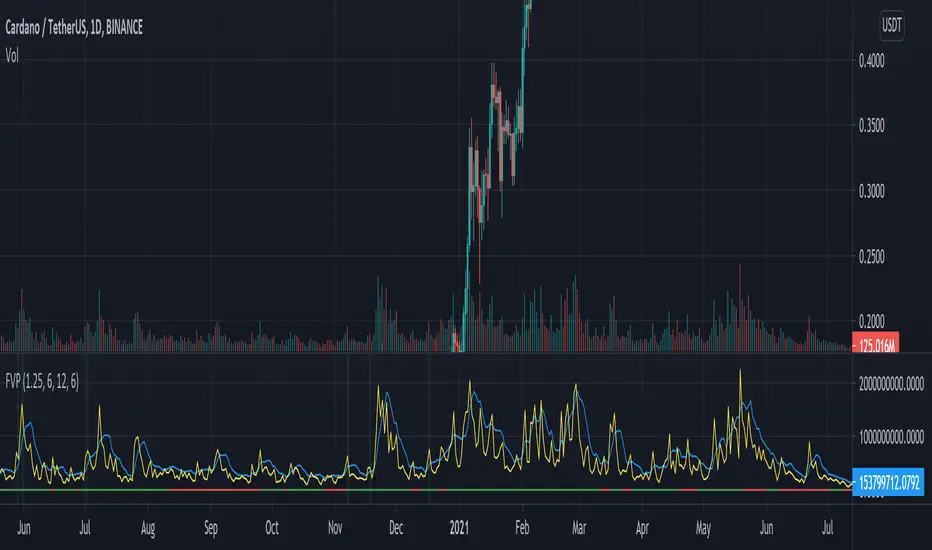
Kifier's ALT-COIN Failed Volume PressureGeneral Idea:
The basic idea is really simple - to detect during a bull-run, good mid-run entries or even predicting the start of a run, and the overcoming of the sell pressure, and I got this idea very naturally while looking back at my entries with ADA 6 months back. The indicator simply detects for you and alerts where volume reaches high reds but the actual price of the asset does not close lower than the previous open. This essentially shows a rejection of the selling pressure, and usually if either in a stagnant or bullish trend will just result in a bullish trend. It’s also great to detect entries into a bull-run mid way, which can happen quite often with cryptos. Due to the reliance of volume in this one, it’s probably best to stick with mid to low cap alt-coins, as BTC and even ETH at this point have a more complicated price action trends.
Usage:
It’s built ideally for long-term timeframes, so 1D is the minimum in my opinion, and it should be used in combination with other indicators to confirm entries and market conditions, plus fundamental analysis is VERY important when it comes to trading with volume as a leading indicator in lower cap alt-coins.
Structure:
The blue line is an average of the volume over a period while the yellow is the current volume, this makes it easy when a volume anomaly occurs and essentially a massive sell-off.
The green/red lines at the bottom unimaginatively is just a simple trend indicator based of two EMAs.
I also want to attempt to make a version for smaller time-frames as well, which needs to also account for market noise and a better trend detection but that’s for a future time.
It’d be great to hear feedback and even ideas on beneficial changes!
GMMAs v2.0 CRYPTO [badshah_e_alam]Hello Traders ,
The GMMAs v2.0 CRYPTO strategy stands for gap modified moving averages designed for cryptos. This is a non Repainting Indicator.
This strategy version is a advanced and modified to one of my previously published indicator named as "gap modified moving average".
I am using my Modified Moving Average indicator for a while. I always wanted to add some more information to moving
averages and made some modification to Moving averages.
The additional Information I have added to the Moving Average helps it to act more quickly based on the price of that
particular asset.
How is strategy gives signals?
when the GMMA'w cross over or cross under the GMMA'y than a trade is taken depending on the filter status.
Info about the settings :
The default setting is for 11m ETHUSD , it works with other cryptos and other timeframe as well . For other timeframes it need to be fine tuned and need little change.
The first category is for the selection of Moving average to be modified and the source to be used for that moving average .
I have added seven moving averages to choose between. SMA works good for me , you can choose and play with other MAs.
following are the option to choose MAs
1.EMA
2.SMA
3.HMA
4.RMA
5.WMA
6.VWMA
7.SWMA
Next option in setting is GMMA'y and GMMA'w :
these two settings define the length and lookback period of the MA you have choosed above.
The length is similar to the length of the moving average chosen to be modified.
The lookback option will look for that number of bars for the modification.
GMMA'w is more sensitive than the GMMA'y. So make sure that the setting input of the GMMA'y is significantly larger than the
GMMA'w.
FILTER:
I have added TradingView inbuilt SUPERTREND as a filter in the strategy, it works very good in filtering out false trades
you can enable/disable it in the settings.
EXIT strategy:
The exit Strategy is based on ATR, Take profit and SL are decided by the ATR in the SL/TP setting option. You can change the RR ratio in the setting.
The backtest settings are as follow:
Initial capital:10k
Initial Commission = 0.000
Initial Pyramiding = 0
Reference :
Thanks to pinecoders and Tradingview community.
my previous gap modified moving average version is :https://in.tradingview.com/script/e3WestBa-Gap-Modified-Moving-Average/
watermark added from:
color gradient framework picked from :https://in.tradingview.com/script/hqH4YIFa-Color-Gradient-Framework-PineCoders/
DISCLAIMER
Any and all liability for risks resulting from investment transactions or other asset dispositions carried out by the user based on information received or a market analysis is expressly excluded by me.
All the information made available here is generally provided to serve as an example only, without obligation and without specific recommendations for action. It does not constitute and cannot replace investment advice. We therefore recommend that you contact your personal financial advisor before carrying out specific transactions and investments.
Do your own research and Risk management before taking any trade.

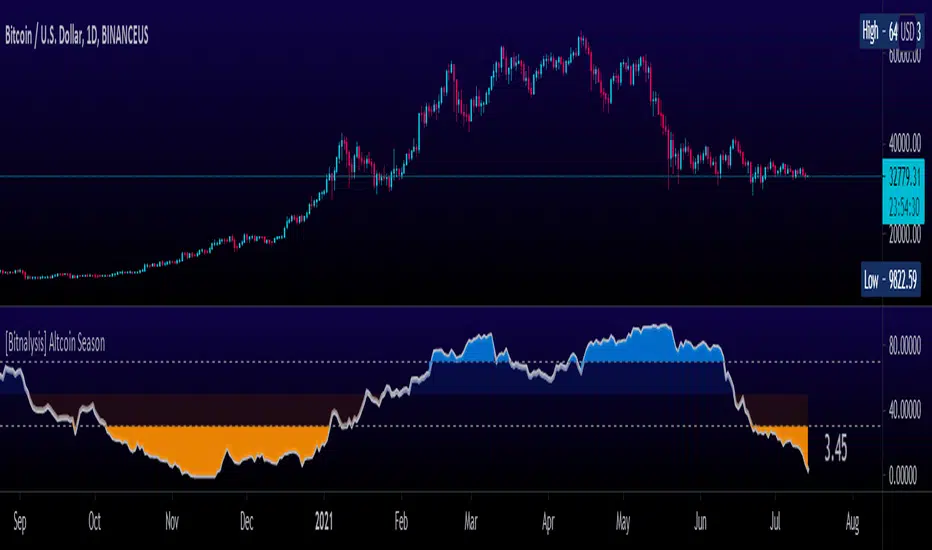
[Bitnalysis] Altcoin Season IndicatorThe Altcoin Season Indicator compares performance of Bitcoin with the performance of the top altcoins over a specified period. The indicator weights the results, giving greater weight to the first specified altcoins. By default, the larger market cap altcoins, such as ETH, BNB, ADA, etc., are included first and therefore given greater weight in the algorithm. To remove the weighting from the formula and consider the performance of all listed altcoins equally, set the weighting setting to "0".
The output shows to what extent altcoins are outperforming Bitcoin; the higher the number, the more altcoins are outperforming Bitcoin. This indicator helps traders predict when "altcoin season" is about to begin or end.
Fed Balance Sheet Growth Rate p.a.Plots the rate of change in the Fed Balance sheet.
Defaults to annual rate of change.
Option to plot the raw balance sheet data.

Value Area OscillatorThis is an oscillator version of the Value Area Indicator. The Value Area Indicator employs a custom, volatility-weighted moving average formula, which produces a moving average that becomes more reactive during volatile periods. The indicator then provides fibonacci channels above and below the main MA line. The fibonacci channels are sized based on the "golden ratio." This indicator may be helpful to show when the particular cryptocurrency or other instrument is oversold or overbought. If you are looking to add to your position, this indicator can help determine the best times to do so.

Value Area IndicatorThe Value Area Indicator employs a custom, volatility-weighted moving average formula, which produces a moving average that becomes more reactive during volatile periods. The indicator then provides fibonacci channels above and below the main MA line. The fibonacci channels are sized based on the "golden ratio." This indicator may be helpful to show when the particular cryptocurrency or other instrument is oversold or overbought. If you are looking to add to your position, this indicator can help determine the best times to do so.

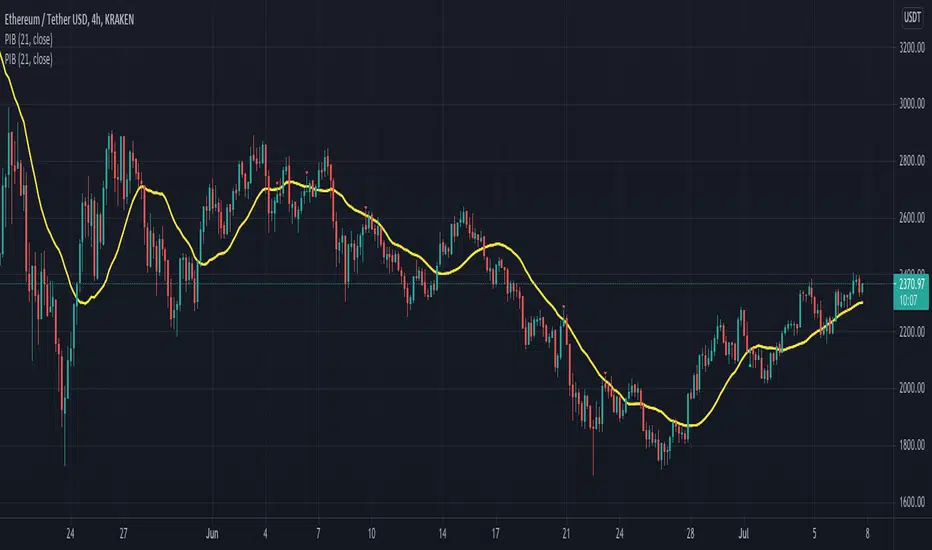
Pinbar-Rejection-IndicatorThis indicator allows you to filter noisy pin bar chart, with pin bars which have been rejected from dynamic support/resistance level also named as 21 Moving Average.
I would consider to work only on higher time frames like 1H and higher, so you really can find only best entries.
Have fun, write your feedback in the comments section:)
P.S This is the first version of the indicator, so be free to contribute, and soon I'm going to improve this indicator.
Crypto Scanner [MensaTrader]Market Scanner
By default set up to scan 7 Crypto Currencies on 3 different Time frames
Default assets are from Binance listing, but can be changed in settings.
First timeframe is set to Daily, (all timeframes can be changed in the settings), The RSI value for the Daily resolution is printed. The current conditions need it to be between the value of 40 and 50, If this condition is met then the box will light are green, if they are not they will stay red.
Second timeframe is set to 4 Hour, RSI for this timeframe and assset will also be printed here, the conditions for it are different though. Currently set up so if the RSI value is lower than 40 the box will light up green. This 40 value can be changed in the settings aswell.
Third timeframe is set to 1 Hour, This timeframe is looking for divergences. If a Divergence is found, the box will light up green and say "Bullish Divergence", This will stay green until either of the 2 invalidation conditions are met.
One condition is (For Bullish Divergence) to be cleared, If the recent Low where the divergence was formed gets taken out. Then the divergence sign will dissappear
Second condition is if the RSI Value climbs above 55, Then once again the Divergence sign will dissappear.
Use this to help scan multiple assets at once and find RSI values which suit your trading set ups.
I have tried to make as many options adjustable as possible including the Size of the Scanner, all in the settings.

Tickers PanelCONCEPT
It's a very straight forward panel with tickers for both BTC and ETH (you can switch in the settings).
The background colouring changes based on how individual markets are trading compared to a market average.
It shows green if a market is trading above the average price and it shows grey if it's trading below the average.
This makes it easy to spot which markets are cheap/expensive.
This is jus a random idea, but the source code is open so that you can make your own changes if you like.
FEATURES
Tickers for six different markets.
By default it shows BTC prices, but you can also choose for it to show ETH prices.
Sometimes it gets blocked by price.
So there's an option to put it at the bottom of the screen.
There's more possible, just look at the source code.
I use a widescreen so for me the size of the boxes is perfect, but if you're on different resolution it might look weird.
Also if you split your screen in half for example it probably won't perfectly fit anymore.
In the settings you can easily change the colours, width, height, border thickness, ...
So yeah, just a fun panel with some crypto tickers.
Have a look at the source code it's pretty easy to understand, have fun playing around with it.
The indicator is free so just add it to your favourites and you can start using it (you might have to refresh Tradingview before it works).
Cheers.

Binance Futures BasisCONCEPT
The futures basis for multiple coins based on the Binance coin margin quarterly futures contracts.
If you need a run down of what the futures basis is, check out this short educational post (click on the chart):
In short: the futures basis is the premium at which futures contracts are trading compared to the spot market.
FEATURES
Futures basis for the following coins:
BTC
ETH
LTC
BNB
ADA
DOT
BCH
LINK
There's also an average futures basis which is an average premium of all the coins I just listed.
As you can see there's also a zero line which you can turn on in the settings.
This is quite useful for when the futures start trading in or close to backwardation.
It's possible to show all the premiums at the same time.
This makes it easy to look for outliers.
You can choose the candle source too.
By default it's set on "close" which probably makes the most sense.
All data will be based on candle closes.
However if you're looking at higher timeframes sometimes crucial info is lost when you keep it on "close".
As you can see in this BTC futures basis example with "close" as a candle source you don't seen anything peculiar even though there were two violent liquidation cascades that temporarily had a huge impact on the futures basis.
If you then select "ohlc4" for example which uses an average value of each candle you can clearly see the impact that those drops had.
Basically when you're looking at most recent data I prefer candle close, but when looking at higher timeframes for historic data the ohlc4 option is more useful.
At the time of publishing this indicator it's using the September quarterly futures contracts (which is the closest expiration).
I'll update this every time the expiration happens.
However, in the settings you'll find the code for these futures contracts.
If you want to take a look at the next expiration for example, which is December right now, you can just fill in the Binance code of those contracts and it'll re-calculate everything and print the futures basis for the December futures.
This way you can also update the indicator yourself each time contracts expire (to make sure the indicator keeps working just in case I were to disappear or something).
The code for the current (September) contracts is U2021.
The code for the next expiration (December) is Z2021.
This will become out dated of course.
TRADING
You can find more info on how it's useful for trading in the educational post I linked.
Some short notes...
This premium works very similar to the perpetuals basis or funding.
Simply put a high premium could be a sign that the market is overbought and a very low premium could be a sign that the market is oversold.
Backwardation (below 0) is very rare and usually only happens after a violent crash. Historically those are good buying opportunities.
Divergences also often work really well.
If you want access send me a private message so we can discuss it.
Cheers.

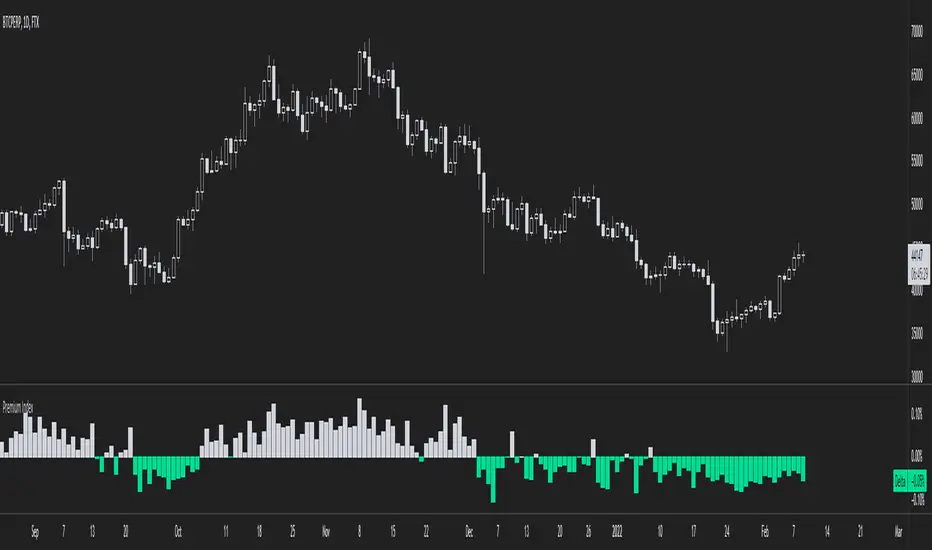
Binance Premium IndexCONCEPT
An indicator with official Binance premium index data for BTC and a bunch of altcoins.
The premium index is based on the difference in price between the perpetual swap contract last price and the price of a volume weighted spot index.
Simply put: it shows you for each coin whether the spot market is trading higher than the Binance perp or not.
FEATURES
Premium index for:
BTC
ETH
LTC
BNB
ADA
DOGE
DOT
UNI
SOL
LINK
There's also an average premium based on the premiums of all these coins combined.
You can also choose in the settings to display all the premiums at the same time.
This makes it easy to find outliers.
There are two extra features that need some explaining.
First of all: the clamp.
It doesn't happen often, but sometimes as a result of massive liquidation cascades there's temporarily a huge spot premium (or derivs premium, but usually spot premium).
In such a scenario the value of the premium dwarfs all other historical data and the indicator becomes nearly unreadable.
The clamp option allows you to put a cap on how extreme the values can get so that the indicator becomes easier to read again.
In the settings you can also change what you want the max value to be.
When you select the option that shows all premiums you'll definitely run into this problem as well.
But you can put a clamp on these too.
The second option is more straight forward: smoothing.
The premium can sometimes be a bit all over the place. It's possible to display the data as a smoothed moving average.
Here's an example of the raw data of the global average premium.
Now with smoothing. Looks a lot more clean.
TRADING
This premium index data is what the funding rate is based on.
Thus it has a direct impact on the perpetual swap contract.
If there's a spot premium (negative values in green) funding will be negative and shorts will have to pay longs.
If there's a derivatives premium (positive values in grey) funding will be positive and longs will have to pay shorts.
Simply put, a spot premium is usually bullish and a derivatives premium is usually bearish.
A lot of people look at this stuff when it comes to bitcoin, but for altcoins it's also definitely relevant.
So here's an indicator with the premium index for 10 different coins.
I don't use more than 10 coins because otherwise the indicator will become very slow.
If you want access to the indicator send me a private message so we can discuss it.
Cheers.
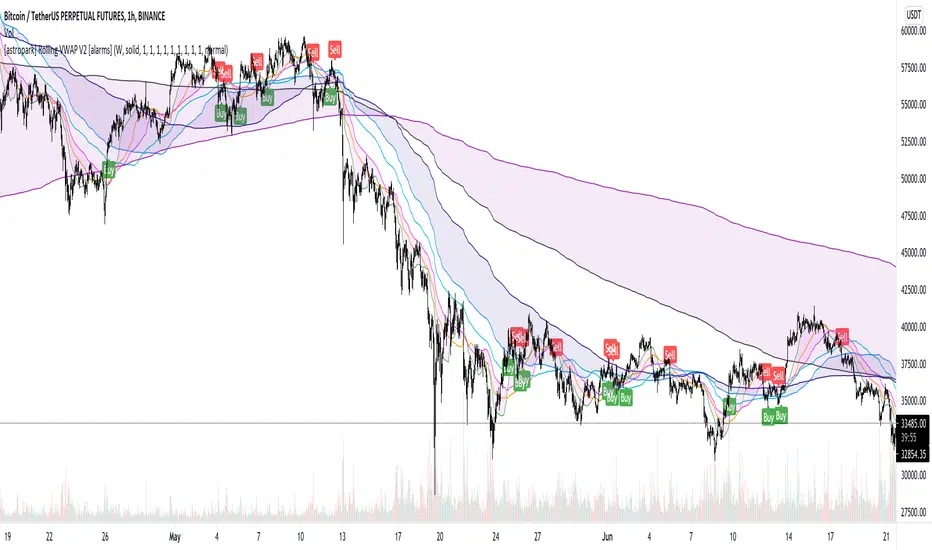
[astropark] Rolling VWAP V2 [alarms]Dear Followers,
today I'm glad to present you yet another awesome Analysis Tool and Strategy, that you may like to use in your trading journey: Rolling VWAP V2 !
This is an upgraded version of my "Progressive VWAP" analysis tool (progressive and rolling are synonymous for me), its description describes quite well what a progressive/rolling vwap is and why they are important to watch:
This indicator can print automatically for you many important Rolling VWAPs:
Daily (D)
2 days (2D)
3 days (3D)
4 days (5D)
Weekly (W)
2 weeks (2W)
Monthly (M)
Quarterly (Q)
Yearly (Y)
As an indicator it will let you:
enable/disable each rolling vwap, change its color and line style and thickness
enable/disable labels and/or price on labels, as well as change their size
As a strategy it will let you:
enable/disable buy/sell signals
choose which strategy to use (all based on rolling vwaps of course)
choose a starting date & time from which to start backtesting
enable/disable individually long and short setups in the backtesting
You should choose low timeframe rolling vwap strategy if you are on a low timeframe, while higher timeframe rolling vwaps are good on medium-high timeframes.
For example D-2D-3D rolling vwap strategies are good at 1h or below, the others on higher timeframes. Backtesting results will help you in understanting this point quite easily.
This indicator works on every timeframe, market and pair. By the way it must be said that, as a bot strategy it has been tested and designed mostly for Bitcoin trading and it works best on 1h or above.
As I always say, all tools are great if you use them correctly: this is not the "Holy Grail", so always use proper money and risk management strategies.
This indicator is the alarms version of the backtesting one you can see here below:
This is a premium indicator , so send me a private message in order to get access to this script.
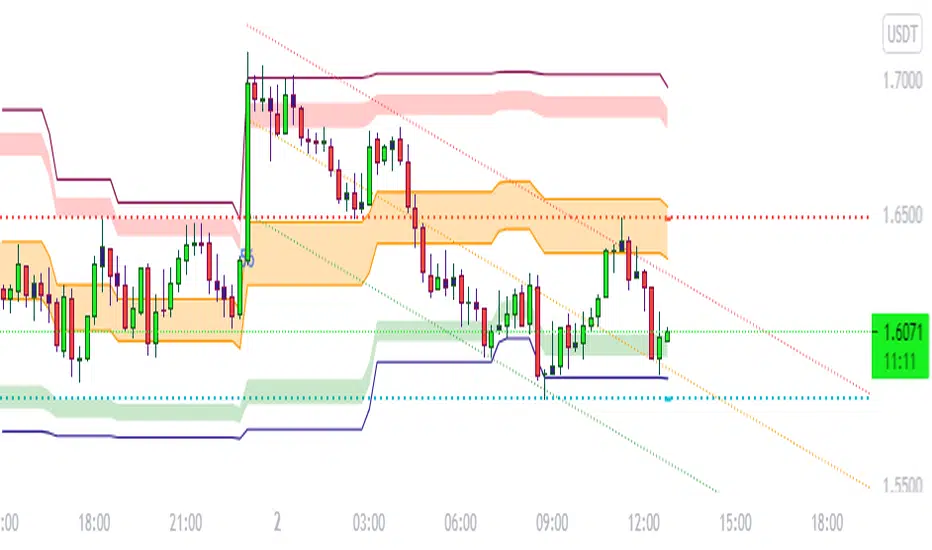
BULLSEYE BORDERS (Combined Price Action Follower)Developed for Crypto Currency Market! Use for 15 minutes period or more! Under 15 minutes, results are unpredictible.
This script had been orginized with Donchian Lines based on support and resistance levels.
Rules:
If the price is under top line, you will be ready for short position, and over the bottom line, long position.
When the price passes the red and green area you can take action and enter the trade!
Orange area refers the squeezed or floating position, so you can either stop or wait for price action!
If you see boring candles frequently, check out the last high and low levels.
If the price close to the last high, take long position. If not, short position.
Use ALMA , if you want to put and alert on script. It is identical to price line.
Thanks to @millerrh for 'Breakout Trend Follower'. Just used the last low and high features to complete the script. Combined with 'Boring Candles' from ©Prasad Raut, Modified on 20190811 (Updated to %30 full candle)
Trend Tip: You can use the script with Linear Channel so you can also see the trend. (not always)
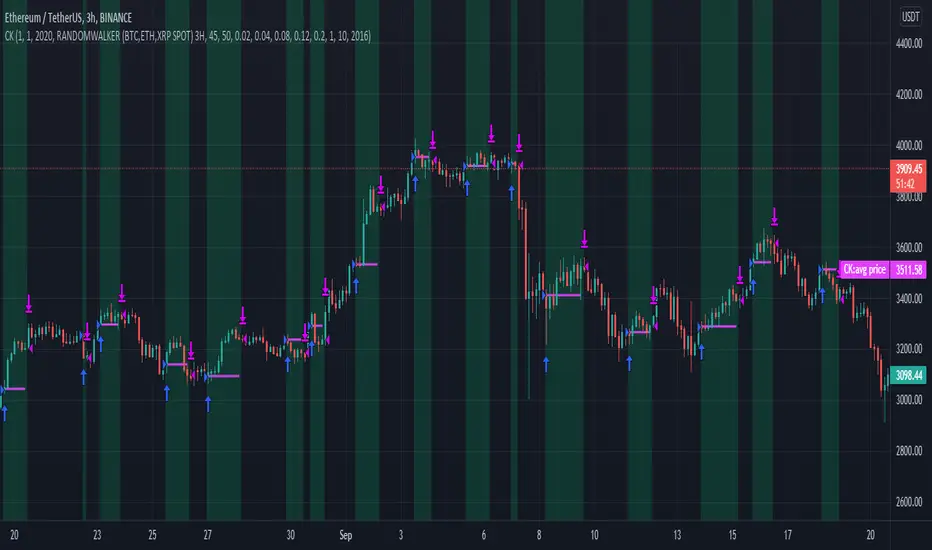
CryptoKillerCryptoKiller is a trend following trading system. It provides entry and exit points, a money management system and a trade management system.
The entry points (fuchsia line) are determined by CryptoKiller Oscillator (see other published script to understand how the oscillator works).
The trade management system provides the exit points in profit and in loss. This script works with multiple take profits (green lines), the initial position is liquidated little by little as the trend reaches the profit targets. Trade management also provides trailing stop exits to save the remaining profits.
Stop loss (red line) take into account the recent past of the chart to be determined, while take profits are fixed and have been calculated based on historical volatility.
The money management system is very simple, it plans to enter a position with a fixed percentage with respect to equity.
CryptoKiller, during an operation, also draws supports and resistances on the chart - determined by the oscillator (orange lines) these supports and resistances are used as a filter to understand where there is the greatest probability of trend development (some entry points provided by the oscillator will therefore not be considered by CryptoKiller as entry points, as in disagreement with the traced supports / resistances).
We know that an error appears in the backtest calculation, where the script is said to suffer from a bias, so the backtest calculation may not be accurate. Actually this happens in high times like H4 or daily, but CryptoKiller is not designed for these timeframes. it is a short-term strategy.
For more information read the author's instructions to contact us, we will send a PDF file with a more complete explanation of the strategy accompanied by screenshots.
Access to this script is granted along with access to CryptoKiller Oscillator.
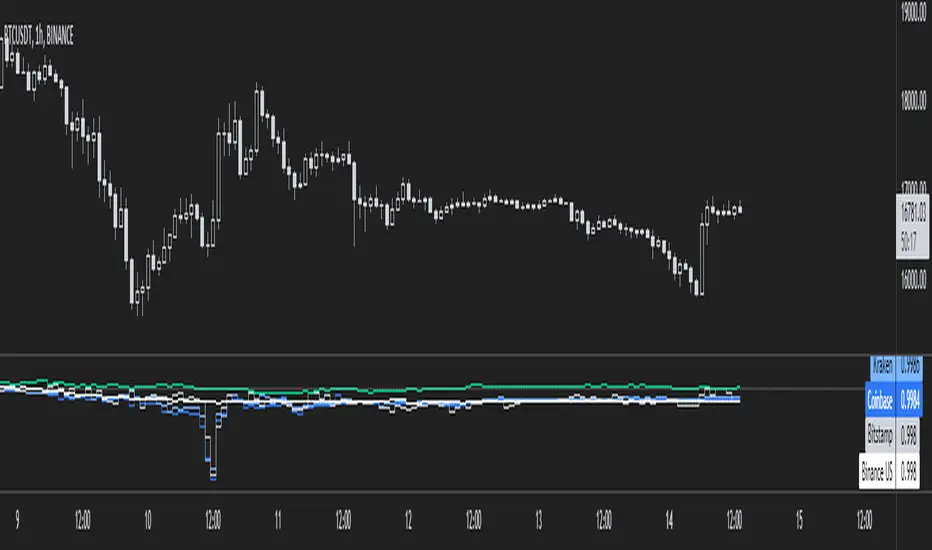
MarketsCONCEPT
This indicator gives a clean overview of how markets are trading relatively to each other.
The line in the middle represents a global market average price (a combination of spot and perpetuals).
The dots, which represent individual markets, float around that line.
This way you can easily tell which markets are more expensive (or cheaper) than others.
Markets used:
Coinbase spot (USD)
Bitfinex spot (USD)
Binance spot (USDT)
FTX spot (USDT)
Bitmex perp (coin margin)
Bybit perp (coin margin)
Binance perp (dollar margin)
FTX perp (dollar margin)
The indicator works for both BTC and ETH.
FEATURES
Markets
The main use is to see if spot exchanges are trading above or below derivatives exchanges.
You'll notice that usually when bottoms form it's when derivs start trading below the market average and spot above.
It's considered bearish when derivs trade way above the market average. It's quite normal that derivs trade a little bit above baseline but if they trade pretty far above spot it becomes worrisome.
I personally think it's most useful on lower timeframes like the 4h or 1h, but it works the same on all timeframes.
Distortion
There's also a distortion metric which shows how big the spread is between all exchanges.
Normally speaking all exchange prices trade very closely together, but sometimes the market gets more turbulent and then prices move apart.
The higher the distortion levels the more turbulent the market.
It's interesting to look at once in a while but it's probably not very useful for trading.
I have noticed though that high distortion usually happens after a violent drop and it often marks bottoms.
But then the obvious question is "what is high distortion" and I can't give you an answer because it varies.
In this screenshot I used ohlc4 for the candle source.
Both
You can also choose for the indicator to show both the markets and the distortion at the same time.
All spot markets are green and all derivatives are grey because that's just the theme I use, but you can change the colours in the settings.
You can choose the candle source as well. By default it's set on candle close prices (which makes the most sense in my opinion).
TRADING
Like I already mentioned, the indicator's main purpose is to show you how individual markets are trading relatively to the global market average price.
The most important aspect of it is to see if spot markets are trading higher than derivs. Spot trading above the average while derivs trade below is usually bullish.
Local bottoms often print when spot trading significantly above the rest.
You can also use the indicator to identify arbitrage opportunities because some times there's one market that suddenly starts trading way above or below every other market.
This is obviously a more niche use case of course.
If you want access to this indicator send me a private message so we can discuss it.
Cheers.

Aggregated Perpetuals VolumeCONCEPT
An aggregated crypto perpetual swap contracts volume indicator that works both for BTC and ETH.
The volume is denominated in USD.
FEATURES
It shows the combined perpetuals volume of 6 of the most prominent derivatives exchanges in crypto, which can be displayed in 4 different ways.
Exchanges used:
Binance (USDT)
Huobi (USD)
Bybit (USD)
FTX (USD)
Bitmex (XBT)
Deribit (USD)
In the settings you can choose to exclude certain exchanges and then that volume is removed from the calculation.
There are 4 different display modes.
stacked
Index
Normal
Delta
For more info check out the spot volume version of this indicator:
TRADING
This is indicator is pretty straight forward... It's volume .
The cool thing about this indicator is that it shows combined volume of a couple of the most important crypto exchanges and it can be displayed in multiple different ways and it works both for bitcoin and ethereum .
It's free so if you add it to your favourites you can start using it right away (it's possible that you'll have to refresh Tradingview before it actually works).
Cheers.

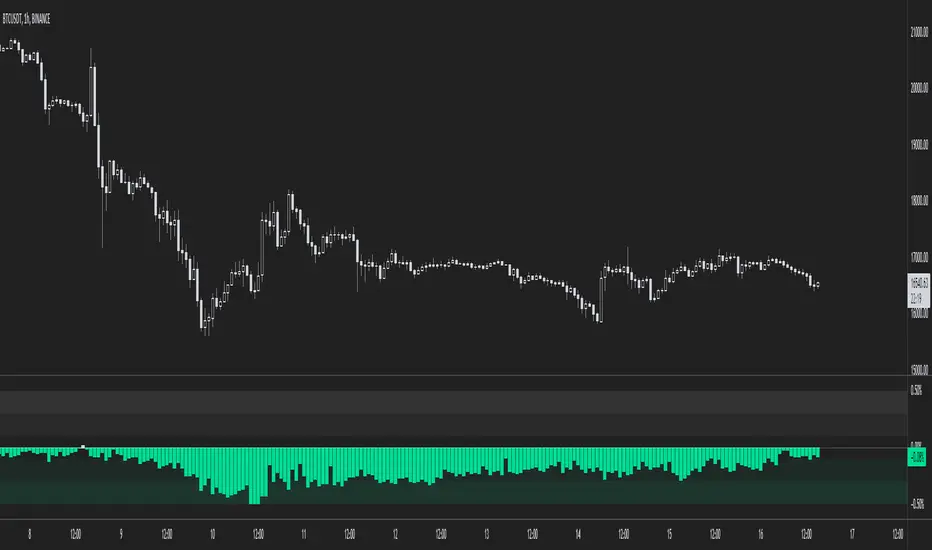
Aggregated Spot VolumeCONCEPT
An aggregated crypto spot volume indicator that works both for BTC and ETH.
FEATURES
It shows the combined volume of 6 of the most prominent exchanges in crypto, which can be displayed in 4 different ways.
Exchanges used:
Binance (USDT)
Okex (USDT)
Huobi (USDT)
Coinbase (USD)
Bitfinex (USD)
FTX (USD)
In the settings you can choose to exclude certain exchanges and then that volume is removed from the calculation.
There are 4 different display modes.
Stacked
This stacks the volume so that you can see exactly which portion of each volume bar each exchange is responsible for.
Index
The indexed format shows you percentage wise the volume of each exchange so that it's even more clear which exchanges are more dominant.
Normal
For the people who like classic volume bars, but still want to use aggregated volume.
Delta
The delta separates buy volume and sell volume.
It's a fun way to display the volume, but take this one with a grain of salt because on Tradingview we can't actually see the exact difference between market buys and sell.
This delta counts a positive candle close as "up" volume and a negative candle close as "down" volume.
TRADING
This is indicator is pretty straight forward... It's volume.
The cool thing about this indicator is that it shows combined volume of a couple of the most important crypto exchanges and it can be displayed in multiple different ways and it works both for bitcoin and ethereum.
It's free so if you add it to your favourites you can start using it right away (it's possible that you'll have to refresh Tradingview before it actually works).
Cheers.

Tether DataCONCEPT
A toolkit with a bunch of different metrics for the widely used stablecoin called tether (USDT).
It's very easy to use, just select in the settings what data you want to look at.
FEATURES
Value index.
The "index" setting shows a volume weighted index of different exchanges to give the most accurate average USDT/USD price.
Market cap.
Very straight forward. This shows you the current tether market cap.
Market cap changes.
This gives you a better visualization of increases (or sometimes decreases) in the tether market cap.
Dominance
This shows tether dominance in the market, same concept as bitcoin dominance.
It compares the USDT mcap to the total crypto mcap and then shows the dominance percentage wise.
It's considered bearish when USDT dominance goes up because it means people want to get out of coins and flee to something more stable.
BTC buying power.
This compares the tether market cap and compares it to the bitcoin market cap to give you an idea of how much BTC buying power has in theory.
The higher this ratio the more bitcoin could be bought with all the tether available.
You'll notice that this often looks very similar to the dominance metric.
Exchanges.
The tether price of multiple exchanges.
In the settings you can select which ones you want the indicator to show.
TRADING
I can't tell you exactly how useful this indicator is for trading, I don't have strong opinions on it.
Some people think a high tether price and dominance is bearish.
Some think the market cap increasing (because of new prints) is bullish.
The buying power metric can give you an idea of how much dry powder there is in the market.
The exchanges metric shows you where you can get the cheapest USDT...
Just some ideas.
This indicator is free so if you add it to your favourites you can start using it immediately (it's possible that you have to refresh Tradingview before it actually works).
Source code is visible for learning purposes.
Cheers.
Aggregated Perpetuals BasisCONCEPT
The aggregated perpetuals basis compares the prices of perpetual swap contracts in crypto (or "perps" for short) with the price of the spot market.
The idea behind this is that it can help you analyse whether the derivatives market is being overly bullish or bearish.
When the indicator shows positive values (grey colouring by default) it means that perps are trading at higher prices than spot.
Generally speaking we say this is bearish or at least not an ideal scenario to long yourself because most of the time this means that derivatives market participants are too aggressive (overbought territory).
Vice versa when the indicator shows negative values (green colouring by default) it means that there's a spot premium which is considered bullish.
A spot driven market is a healthy market. There could also be a spot premium because market participants that are trading perps are aggressively shorting which puts them at risk of getting short squeezed (again, bullish).
FEATURES
The indicator works for both BTC and ETH.
It's aggregated because it looks at the prices of multiple contracts and it's also volume weighted so that more important markets have a bigger impact.
There are three different types of premiums you can select: coin margin, dollar margin or the combined version.
In crypto there are two types of perpetual swap contracts. Contracts that work with coin margin and contracts that work with dollar margin, which is mostly USDT although FTX for example also accepts other collateral. Sometimes these contracts trade at slightly different prices and you'll notice that there's also a shift in bullishness and importance between these contracts from time to time.
However most of the time the values will be very similar for coin margin and dollar margin.
Markets used for the coin margin perps:
Binance
Bybit
Deribit
Markets used for dollar margin perps:
Binance
Bybit
FTX
The combined premium combines them all.
The spot indices used are:
BXBT (for BTC)
BETH (for ETH)
By default it uses "close" as candle source which means it looks at the premium as if the candle were to close right now.
If you're looking at higher timeframes I suggest using "ohlc4" because there's a lot that happens within one daily candle for example so you might want to use an average candle price (ohlc4 = open+high+low+close/4)
There's a "clamp" feature which puts a cap on extreme values.
Sometimes during capitulation events there's a massive spot premium which dwarfs all the other values and that makes the indicator unreadable.
In such cases the clamp helps to make the indicator useful again.
As you can see I created support and resistance zones (which you can turn off) that max out at 0.4% for bitcoin because by looking at historical data it seems that the premium almost never moves outside of those thresholds (except for those few exceptions during liquidation cascades).
There's also an option to smooth out the values.
TRADING
As discussed earlier, a spot premium is generally speaking considered bullish and a derivatives premium is considered bearish.
It doesn't give buy an sell signals, but it helps you with establishing a bias and gauging general market sentiment.
This in turn can help you with deciding what side of the trade to take and it shows if the conditions are still favourable for you to take the trade you want, because a spot premium for example usually leads to negative funding which makes it interesting to go long.
Send me a private message if you want access so we can discuss it.
Cheers.
Aggregated Futures BasisCONCEPT
An indicator that shows you the futures basis, which is the premium that classic futures contracts are trading at compared to the spot market.
By default its settings are for bitcoin quarterly contracts (closest expiration date), although there's a lot of customizing possible.
You could also use this indicator for other coins but then you'll have to change the inputs.
I'll manually update the contracts when they get close to expiration, but you could do this yourself as well (just in case I disappear for some reason and don't update it anymore).
For more info on what the futures basis is exactly check out this short educational post (click chart):
FEATURES
As previously mentioned, the default settings are for bitcoin.
The index used is the Bitmex BXBT index. It's a dynamic and volume weighted spot index which is perfect to get an average price of the spot market.
If you want to look at the ethereum futures basis for example then I suggest using the BETH Bitmex index, same concept as the BXBT chart but for ETH.
The futures used are quarterly contracts of the most prominent exchanges in crypto.
There's also an option to add an average plot (or only show the average: use the selection box) which calculates the average premium of all the futures contracts selected (you can also choose to exclude certain contracts).
The standard settings show you the premium in percentage terms, but there's also an options to show the annualized premium.
If I don't update the indicator when the contracts expire you'll have to fill in the tickers of the next quarterlies and you'll also have to change the expiration date to make sure this annualized premium still works.
There's a "zero line" you can add which is useful for when the futures get close to backwardation.
And you can set up bullish and bearish signals of your choosing. By default it shows a bull signal when the premium goes below zero and a bear signal when the premium goes above 10 (if you put it on annualized you'll want to change this threshold).
TRADING
The futures basis can be very useful to gauge market sentiment.
It can give you a better idea of how aggressive market participants are by looking at how much the futures are going up or down relatively to spot.
Divergences also often have an impact.
If you want access to this indicator send me a private message so we can discuss it.
Cheers.

Ichimoku Cloud Strategy Long Only [Bitduke]Slightly modificated and optimized for Pine Script 4.0, Ichimoku Cloud Strategy which, suddenly, good suitable for the several crypto assets.
Details:
Enter position when conversion line crosses base line up, and close it when the opposite happens.
Additional condition for open / close the trade is lagging span, it should be higher than cloud to open position and below - to close it.
Backtesting:
Backtested on SOLUSDT ( FTX, Binance )
+150% for 2021 year, 8% dd
+191% for all time, 32% dd
Disadvantages:
- Small number of trades
- Need to vary parameters for different coins (not very robust)
Should be tested carefully for other coins / stock market. Different parameters could be needed or even algo modifications.
Strategy doesn't repaint.

InvictusHello,
I introduce my strategy that provide signals for entering in the market and signal for exit.
This indicator attempts to show a trader when is the best time to open a long or short position. The calculations are partially based on volatility, SMA, EMA and predefined values depending on used timeframe.
We collect data from comparing the current price, calculating the average move of the market, top, bottom and close of the latest bars. The middle line is an adaptive moving average, which is the base of the signals and we also use it as a Trend Line to determine if we are in long or short "condition". The basic idea of this indicator is to show the best place to open a Long or Short position and when to close it.
It is very simple - there are 2 type of signals - LONG (in green) and SHORT (in red). You can close your position when a TP (Take profit) shows up or based on your calculations.
You can chose from several options which strategy you want (there is a "Strategy" select in the settings). The strategies that are proving better according to our tests are marked with a diamond.
Don't forget to always trade with caution, trading is dangerous don't trade more than you can afford to lose.
Please contact me via personal message if you want to test the strategy or for more information.
Thank you.
