MAD Supertrend [Alpha Extract]A sophisticated SuperTrend implementation that replaces traditional ATR calculations with Mean Absolute Deviation methodology for adaptive volatility measurement and band construction. Utilizing SMA baseline with MAD-based deviation bands and optional adaptive factor adjustments, this indicator delivers institutional-grade trend detection with strength-based filtering and dynamic visual feedback. The system's MAD approach provides superior noise reduction compared to ATR while maintaining responsiveness to genuine volatility changes, combined with momentum-based strength calculations for high-conviction signal generation.
🔶 Advanced MAD-Based Band Construction
Implements Mean Absolute Deviation calculation as volatility proxy, measuring absolute price deviations from mean and smoothing for stable band generation without ATR dependency. The system calculates SMA baseline, computes MAD from configurable lookback period, applies factor multipliers to create upper and lower bands, then implements classic SuperTrend ratcheting logic where bands only adjust when price violates previous levels or calculations warrant updates.
// Core MAD SuperTrend Framework
SMA_Value = ta.sma(src, SMA_Length)
Mean = ta.sma(src, MAD_Length)
Abs_Deviation = abs(src - Mean)
MAD_Value = ta.sma(Abs_Deviation, MAD_Length)
// Band Construction with Ratcheting
Upper_Band = SMA_Value + MAD_Factor * MAD_Value
Lower_Band = SMA_Value - MAD_Factor * MAD_Value
// Ratcheting logic prevents premature band adjustments
🔶 Adaptive Factor Adjustment Engine
Features optional adaptive multiplier system that modulates MAD factor based on normalized MAD magnitude relative to recent extremes, creating bands that automatically expand during high-volatility regimes and contract during consolidation. The system applies min-max normalization to MAD values over configurable lookback, multiplies by adaptation parameter, and adds to base factor for dynamic volatility sensitivity without manual recalibration.
🔶 Momentum-Based Strength Filter
Implements sophisticated strength calculation measuring price momentum relative to baseline divided by volatility-adjusted MAD bands, producing normalized 0-1 strength scores with exponential smoothing. The system calculates distance from SMA baseline, normalizes by MAD-derived band width, and applies configurable minimum threshold requiring sufficient momentum before trend signals activate, filtering weak or choppy market conditions.
🔶 SuperTrend Direction Logic
Utilizes classic SuperTrend methodology adapted for MAD bands where trend direction flips on opposite band violations with state persistence until confirmation. The system tracks whether price closes above upper band (bearish flip to bullish) or below lower band (bullish flip to bearish), maintains directional state until opposing violation occurs, and generates binary +1/-1 trend signals suitable for systematic position management.
🔶 Intelligent Candle Sticking System
Provides advanced line positioning option that anchors SuperTrend line to candle wicks or bodies rather than pure calculation values for enhanced visual clarity. The system supports two modes: Wick (positions at high/low extremes based on trend direction) and Body (constrains line between calculation and candle extremes), creating cleaner chart presentation while maintaining mathematical integrity of underlying signals.
🔶 Dynamic Gradient Visualization Framework
Implements color intensity modulation based on smoothed strength calculations, transitioning from muted to vivid hues as momentum conviction increases. The system applies gradient interpolation using strength ratio, creating visual feedback where strong trending moves display intense colors while weak or consolidating conditions show faded tones across trend line, channel bands, and candle coloring for immediate regime assessment.
🔶 MAD Channel Architecture
Features volatility-adjusted channel bands centered on baseline or candle-stuck line with configurable multiplier for support/resistance visualization. The system calculates upper and lower bounds using MAD values scaled by adaptive factors and channel multipliers, applies dynamic transparency based on trend strength, and creates filled regions that intensify during strong trends and fade during weak conditions.
🔶 Multi-Layer Glow Effect System
Provides sophisticated line rendering with triple-layer plot system creating glow effect through progressively wider and more transparent outer layers. The system plots core trend line at specified width with full color intensity, adds inner glow layer at +2 width with moderate transparency, and outer glow at +4 width with higher transparency, creating visual depth and emphasis without cluttering chart space.
🔶 Strength-Based State Management
Implements intelligent trend state logic requiring both directional signal and minimum strength threshold breach before confirming trend transitions. The system calculates raw SuperTrend direction, evaluates smoothed strength against configurable minimum, generates filtered trend state that can be bullish (+1), bearish (-1), or neutral (0), and maintains state persistence using hold logic that prevents oscillation during ambiguous conditions.
🔶 Comprehensive Alert Integration
Generates trend flip alerts when filtered state transitions from bearish to bullish or bullish to bearish with full confirmation requirements satisfied. The system detects state changes through comparison with previous bar, triggers single alert per transition rather than continuous notifications, and provides customizable message templates for automated trading system integration or manual notification preferences.
🔶 Performance Optimization Architecture
Utilizes efficient calculation methods with null value handling, nz() functions preventing errors during initialization bars, and optimized gradient calculations. The system includes intelligent state persistence minimizing recalculation overhead, streamlined MAD computation avoiding redundant mean calculations, and smooth visual updates maintaining consistent performance across extended historical periods.
This indicator delivers sophisticated SuperTrend analysis through Mean Absolute Deviation methodology providing superior statistical properties compared to traditional ATR-based approaches. MAD calculations offer more robust volatility measurement resistant to extreme outliers while maintaining sensitivity to genuine market regime changes. The system's adaptive factor adjustment, momentum-based strength filtering, and dynamic visual feedback make it essential for traders seeking reliable trend-following signals with reduced false breakouts during choppy conditions. The combination of MAD bands, candle-sticking options, gradient strength visualization, and comprehensive filtering creates institutional-grade trend detection suitable for systematic approaches across cryptocurrency, forex, and equity markets with clear entry/exit signals and comprehensive alert capabilities.
Crossover

Crypto MA Crossover indicator v0.1Research I conducted has shown that using moving average crossovers to determine when going long a cryptocurrency (or otherwise going to cash) performs better than both buy-and-hold as other similar strategies (e.g., going long when price crossover over moving averages).
Adaptive moving average strategy paper with full backtests
This indicator shows if a given cryptocurrency is in a state where the best-performing moving averages have crossed over. It also shows the specific moving average settings for each cryptocurrency.
Note: you will have to edit the script to update the coins and moving average settings manually.

Volume-Adjusted CCI Trend [Alpha Extract]A sophisticated trend identification system that combines dual EMA direction analysis with volume-weighted normalization and CCI momentum filtering for comprehensive trend validation. Utilizing Volume RSI integration and standard deviation-based bands that expand and contract with volume characteristics, this indicator delivers institutional-grade trend detection with multi-layered confirmation requirements. The system's volume adjustment mechanism modulates signal sensitivity based on participation strength while CCI thresholds prevent false signals during weak momentum conditions, creating a robust trend-following framework with reduced whipsaw susceptibility.
🔶 Advanced Dual EMA Direction Engine
Implements fast and slow exponential moving average comparison to establish primary trend direction bias with configurable period parameters for timeframe optimization. The system calculates trend direction as binary +1 (bullish when fast EMA exceeds slow EMA) or -1 (bearish when slow exceeds fast), providing foundational directional input that requires additional confirmation before generating actionable trend states.
🔶 Volume-Adjusted Normalization Framework
Features sophisticated normalization calculation that measures price deviation from basis EMA, scales by standard deviation, then applies volume-weighted adjustment factor for participation-sensitive signal generation. The system calculates Volume RSI to quantify relative volume strength, converts to ratio format, and multiplies normalized deviation by volume factor scaled by impact parameter, creating signals that strengthen during high-volume confirmations and weaken during low-volume moves.
// Volume-Adjusted Normalization
Vol_Ratio = Volume_RSI / 50
Vol_Factor = 1 + (Vol_Ratio - 1) * Vol_Impact
Dev = src - Basis_EMA
Raw_Normalized = Dev / (StdDev * Multiplier)
Vol_Adjusted_Norm = Raw_Normalized * Vol_Factor
🔶 CCI Momentum Filter Integration
Implements Commodity Channel Index threshold system with configurable upper and lower bounds to validate trend strength and filter sideways market conditions. The system calculates standard CCI with adjustable length, compares against asymmetric thresholds (default +100 bullish, -50 bearish), and requires CCI confirmation in addition to EMA direction and normalized deviation before transitioning trend states, ensuring only high-conviction signals generate entries.
🔶 Multi-Layer Trend State Logic
Provides intelligent trend state machine requiring simultaneous confirmation from EMA direction, volume-adjusted normalization threshold breach, and optional CCI momentum validation. The system maintains persistent trend state that only transitions when all three conditions align, preventing premature reversals during temporary retracements or low-volume fluctuations while capturing genuine trend changes with institutional-grade confirmation requirements.
🔶 Dynamic Volume Band Architecture
Creates volatility-adjusted bands around basis EMA using standard deviation multiplied by volume factor, producing channels that widen during high-volume periods and contract during low-volume consolidations. The system applies identical volume adjustment to band calculations as normalization metric, ensuring visual envelope consistency with underlying signal logic and providing intuitive reference boundaries for trend-following price action.
🔶 Gradient Strength Visualization System
Implements color intensity modulation based on normalized signal strength relative to threshold requirements, creating visual feedback that communicates trend conviction. The system calculates strength ratio by dividing absolute normalized value by threshold, caps at 1.0, and applies gradient interpolation from muted to vivid colors, instantly conveying whether current trend exhibits marginal or strong characteristics through line and candle coloring.
🔶 Volume RSI Calculation Engine
Utilizes RSI methodology applied to volume series rather than price to quantify relative participation strength with normalization to 0.5-1.5 range for factor multiplication. The system processes volume through standard RSI calculation, divides by 50 to center around 1.0, and produces ratio values where readings above 1.0 indicate above-average volume and below 1.0 suggest below-average participation for signal adjustment purposes.
🔶 Asymmetric Threshold Configuration
Features separate positive and negative normalization thresholds with independent CCI upper and lower bounds enabling optimization for bullish versus bearish signal generation characteristics. The system defaults to symmetric normalized thresholds (±0.2) but asymmetric CCI levels (+100/-50), recognizing that bullish momentum often requires stronger confirmation than bearish reversals in typical market structures.
🔶 Comprehensive Visual Integration
Provides multi-dimensional trend visualization through color-coded basis line, volume-adjusted bands with gradient fills, trend-synchronized candle coloring, and transition signal labels. The system enables selective display toggling for each visual component while maintaining consistent color scheme and strength-based intensity across all elements for cohesive chart presentation without overwhelming information density.
🔶 Alert and Signal Framework
Generates trend change alerts when state transitions occur with all confirmation requirements satisfied, providing notifications for bullish (transition to +1) and bearish (transition to -1) signals. The system implements state change detection through comparison with previous bar trend state, ensuring single alert per transition rather than continuous notifications during sustained trends.
🔶 Performance Optimization Architecture
Employs efficient calculation methods with null value handling for Volume RSI initialization and nz() functions preventing calculation errors during early bars. The system includes intelligent state persistence maintaining previous trend during ambiguous conditions and optimized gradient calculations balancing visual quality with computational efficiency across extended historical periods.
🔶 Why Choose Volume-Adjusted CCI Trend ?
This indicator delivers sophisticated trend identification through multi-layered confirmation combining directional EMA analysis, volume-weighted normalization, and momentum validation via CCI filtering. Unlike traditional trend indicators relying solely on price-based calculations, the volume adjustment mechanism ensures signals strengthen during high-participation moves and weaken during low-volume drifts, reducing false breakouts and choppy market whipsaws. The system's requirement for simultaneous EMA direction, normalized threshold breach, and CCI momentum confirmation creates institutional-grade signal quality suitable for systematic trend-following approaches across cryptocurrency, forex, and equity markets. The volume-adjusted bands provide dynamic support/resistance references while the gradient strength visualization enables instant assessment of trend conviction for position sizing and risk management decisions.

MACD Matrix: Angle & SettlementThis indicator is a comprehensive Multi-Timeframe (MTF) Dashboard designed for technical traders who rely on MACD not just for crossovers, but for Momentum Angle and Settlement (Hooks).
Instead of cluttering your screen with 5 different MACD charts, this Matrix calculates the math in the background and presents a clean "Heads-Up Display" of the MACD state across your specific timeframes (Default: 3m, 15m, 1h, 4h, 16h).
The Concept: "Angle Settlement"
Standard MACD indicators only show you when a cross happens. By then, the move is often halfway over. This script focuses on the Angle (Slope) of the MACD line to predict turns before they happen:
Steep Angle: Momentum is accelerating. (Strong Trend)
Settling Angle: The slope is flattening out. The MACD line is "hooking." (Reversal/Cross Imminent)
Dashboard Columns Explained
TF (Timeframe): Auto-formats your settings into readable text (e.g., "240" becomes "4h").
Zone:
> 0 (Green): MACD is above the Zero Line (Bullish Trend context).
< 0 (Red): MACD is below the Zero Line (Bearish Trend context).
Cross:
PCO (Green): Positive Crossover (MACD > Signal).
NCO (Red): Negative Crossover (MACD < Signal).
Deg (°):
The calculated mathematical angle of the MACD line.
Positive (+): Momentum is rising.
Negative (-): Momentum is falling.
State (The Strategy):
STEEP (Bright Color): The angle is increasing. Do not trade against this momentum.
SETTLE (Dim Color): The angle is decreasing compared to the previous bar. The momentum is "cooling off," often signaling a "Hook" or an upcoming crossover.
Settings & Customization
Custom Timeframes: You can freely change TF-1, TF-2, etc., in the settings. The table labels will auto-update (e.g., if you change 4h to 1D, the table will display "1D").
MACD Lengths: Fully customizable (Default 12, 26, 9).
Angle Sensitivity: A multiplier to calibrate the "Degrees" to your specific asset class (Crypto, Forex, or Indices). If angles look too small, increase this value.

Predictive ZLEMA NavigatorThis is an advanced trend-following indicator that combines Zero-Lag Exponential Moving Averages (ZLEMA) with predictive crossover analysis to identify high-probability trade entries with exceptional timing precision.
Key Features:
1. Zero-Lag Technology
Utilizes ZLEMA calculation to eliminate the inherent lag found in traditional EMAs
Provides faster response to price movements while maintaining smooth trend identification
Default periods (34/89) align with Fibonacci sequence for natural market rhythm detection
2. Predictive Crossover System
Unique algorithm forecasts upcoming Golden Cross and Death Cross events before they occur
Displays estimated bars until next crossover, giving traders advance preparation time
Helps avoid late entries by signaling trend changes up to 200 bars in advance
3. Visual Direction Arrows
Color-coded projection arrows show the momentum trajectory of both fast and slow ZLEMAs
Adjustable projection length allows customization for different trading timeframes
Instantly identifies whether trends are strengthening or weakening
4. Multi-Layer Signal Confirmation
Clear crossover points marked with circles and confirmation ticks
Dynamic fill coloring between MAs for instant trend bias recognition
Bullish signals (green/blue) and bearish signals (orange/red) prevent confusion
Performance Characteristics:
Strengths:
Reduced Whipsaws: ZLEMA's lag reduction minimizes false signals in ranging markets
Early Detection: Predictive algorithm provides 10-50 bar advance warning of trend changes
Versatile Application: Works across all timeframes (1-minute to daily) and asset classes
Visual Clarity: Clean interface prevents information overload while maintaining comprehensive data
Optimal Use Cases:
Swing trading on 4H-Daily timeframes
Trend confirmation for breakout strategies
Portfolio rotation timing based on momentum shifts
Works exceptionally well on trending assets (crypto, indices, trending stocks)
Trading Approach:
Enter long on Golden Cross confirmation with upward direction arrows
Exit or reverse on Death Cross with downward momentum projection
Use prediction labels to scale into positions before actual crossover
Combine with volume analysis for enhanced confirmation
Built-in Alert System: Automated notifications for both bullish and bearish crossovers ensure you never miss a trading opportunity.
This indicator bridges the gap between reactive and predictive trading, giving you the speed of ZLEMA with the foresight of trend projection analysis.
DISCLAIMER: This information is provided for educational purposes only and should not be considered financial, investment, or trading advice.Happy Trading

SMA MAD Trend [Alpha Extract]A sophisticated trend identification system that combines Simple Moving Average with Mean Absolute Deviation methodology to create adaptive Super Trend-style bands with advanced strength filtering and gradient visualization. Utilizing ADX-based trend strength validation and slope analysis for signal quality enhancement, this indicator delivers institutional-grade trend detection with dynamic ATR-based ribbon visualization and comprehensive strength measurement. The system's dual-filter architecture eliminates false signals during weak or choppy market conditions while maintaining sensitivity to genuine trend establishment and reversal events.
🔶 Advanced SMA-MAD Band Construction
Implements innovative Mean Absolute Deviation calculation around Simple Moving Average baseline to create volatility-adaptive bands with ratcheting logic for trend persistence. The system calculates MAD by measuring absolute price deviations from the mean, then applies configurable multipliers to generate upper and lower bands that adjust to changing market conditions while preventing premature band violations.
// Core SMA-MAD Framework
SMA_Value = ta.sma(close, SMA_Length)
Mean = ta.sma(close, MAD_Length)
Abs_Deviation = abs(close - Mean)
MAD_Value = ta.sma(Abs_Deviation, MAD_Length)
// Adaptive Bands
Upper_Band = SMA_Value + MAD_Factor * MAD_Value
Lower_Band = SMA_Value - MAD_Factor * MAD_Value
🔶 Intelligent Dual-Filter System
Features comprehensive trend validation using ADX strength measurement and slope analysis to eliminate low-conviction signals during ranging or consolidating markets. The system calculates normalized slope strength using ATR scaling and combines with ADX threshold analysis, generating filtered trend states that distinguish genuine trends from temporary price fluctuations.
🔶 Dynamic Trend Strength Engine
Implements sophisticated strength calculation combining slope intensity and ADX readings to produce normalized 0-100% strength scores with gradient colour intensity modulation. The system normalizes slope by minimum threshold and ADX by configurable level, multiplying factors to create composite strength measurement that drives visual feedback intensity across all indicator elements.
🔶 Super Trend-Style Direction Logic
Utilizes classic Super Trend methodology adapted for SMA-MAD bands, where trend direction flips occur on opposite band violations with persistent state maintenance. The system tracks previous band levels with ratcheting behaviour that adjusts bands only when price movement or new calculations warrant changes, preventing oscillation during normal volatility.
🔶 ATR-Based Ribbon Visualization
Provides dynamic ribbon overlay using ATR-scaled width around the trend line with opacity modulation based on trend strength for intuitive conviction assessment. The system creates upper and lower ribbon bounds at configurable ATR multiples, filling the channel with gradient-adjusted transparency that increases during strong trends and fades during weak conditions.
🔶 Multi-Dimensional Visual Architecture
Provides complete chart integration through trend line overlay, ATR ribbon fills, candle colouring, background glow, and transition signal labels with configurable visibility toggles. The system enables traders to customize display density from minimal (trend line only) to comprehensive (all visual elements) while maintaining consistent colour scheme and strength-based intensity across components.
🔶 Slope Strength Validation
Calculates ATR-normalized slope over configurable lookback periods to measure trend line momentum and filter sideways price action. The system compares absolute slope against minimum threshold requirements, preventing trend signals when price movement relative to the trend line lacks sufficient directional conviction regardless of band position.
🔶 Signal Generation Framework
Generates trend change signals when filtered direction state transitions from bearish to bullish or vice versa, with label placement and alert integration. The system implements state persistence that maintains previous trend until both ADX and slope filters confirm directional change, reducing whipsaw signals while capturing genuine reversals with minimal lag.
🔶 Performance Optimization Framework
Utilizes efficient calculation methods with optimized variable management and configurable parameters for balance between responsiveness and stability. The system includes intelligent state tracking with NA handling for initial bars and smooth gradient calculations that maintain performance across extended historical periods and real-time updates.
This indicator delivers sophisticated trend identification through Mean Absolute Deviation methodology combined with dual-strength filtering for superior signal quality. Unlike traditional Super Trend indicators that rely solely on ATR bands, the SMA-MAD approach uses statistical deviation measurement while incorporating ADX strength and slope validation to eliminate false signals during choppy conditions. The system's gradient-based visual feedback, ATR ribbon visualization, comprehensive dashboard, and multi-dimensional filtering make it essential for traders seeking reliable trend-following approaches with clear conviction measurement across cryptocurrency, forex, and equity markets. The combination of adaptive bands, strength-based transparency, and intelligent filtering creates an institutional-grade trend system suitable for systematic trading strategies.

Filtered TEMA CrossoverFiltered Dual TEMA Crossover
This indicator is a trend-following tool based on the classic Dual Triple Exponential Moving Average (TEMA) Crossover strategy, enhanced with two robust filters: the Chop Index and the Average Directional Index (ADX).
The TEMA is known for its low lag and high responsiveness, making the crossover an effective signal for trend reversals. However, trading TEMA crossovers during sideways, choppy markets often leads to false signals. This is where the filters come in.
Key Features
▪️Dual TEMA Crossover: Plots two customizable TEMA lines (Fast and Slow) for clear visualization of the primary trend direction.
▪️Intelligent Signal Filtering: Buy and Sell signals are generated only when the market confirms it is in a trending state, thanks to two integrated filters:
➖Chop Index Filter: Blocks signals when the market is detected as sideways or consolidating (Chop Index reading above a user-defined threshold).
➖ADX Filter: Ensures signals are only taken when the trend strength is sufficient (ADX reading above a user-defined minimum threshold).
▪️Customizable Signals: Full control over the signal shapes (Arrows, Triangles, etc.), colors, text, and size.
How to Use It
Use the Filtered Dual TEMA Crossover to enter positions on trend continuation or reversal while dramatically reducing exposure to low-quality, whipsawing signals common in non-trending environments.
Before the filters:
After the filters:
Minimize Noise. Maximize Clarity. Trade the Trend.

9/21 EMA Trend TOP rIGHT CORNER INDICATORCrossover indicator for the 9 & 21 EMA. Buy Sell for cross up or down respectively. Daily, weekly and Monthly trend.

VWAP TrendSignalVWAP TrendSignal
VWAP (Volume-Weighted Average Price) is the market’s true fair value — the benchmark institutions use to see when price is balanced, extended, or trending with real intent.
Price often snaps back when it moves too far (mean reversion), and only shows genuine strength when it holds above or below VWAP.
VWAP TrendSignal makes this insight effortless by color-coding VWAP direction:
Yellow = VWAP rising → bullish pressure
Red = VWAP falling → bearish pressure
No bands. No noise. Just pure directional clarity.
Anchor VWAP to the Session, Week, Month, Quarter, or Year, and tailor the Slope Smoothing Filter to your timeframe:
1–2 smoothing → fast & reactive (1–5m scalping)
3–5 smoothing → clean & stable (5–15m intraday)
6–10 smoothing → slow flips (1H–4H swings)
10–15 smoothing → macro bias only (Daily/Weekly)
The line adapts to how you trade.
How to Use It
Mean Reversion
When price stretches far from VWAP, expect pullbacks or snapbacks.
Trend Direction
Yellow supports long bias, red supports short bias.
Simple, reliable, instantly visible.
Balance Zones
Price sitting near VWAP = compression, buildup, or chop.
A perfect signal to wait or prepare for a breakout.
Why It Works
VWAP TrendSignal distills institutional logic into a clean, single-line tool.
It shows fair value, trend slope, and balance all at once — making your chart clearer and your decisions faster.
Once you get used to reading it, trading without it feels blind.

Portfolio Strategy TesterThe Portfolio Strategy Tester is an institutional-grade backtesting framework that evaluates the performance of trend-following strategies on multi-asset portfolios. It enables users to construct custom portfolios of up to 30 assets and apply moving average crossover strategies across individual holdings. The model features a clear, color-coded table that provides a side-by-side comparison between the buy-and-hold portfolio and the portfolio using the risk management strategy, offering a comprehensive assessment of both approaches relative to the benchmark.
Portfolios are constructed by entering each ticker symbol in the menu, assigning its respective weight, and reviewing the total sum of individual weights displayed at the top left of the table. For strategy selection, users can choose between Exponential Moving Average (EMA), Simple Moving Average (SMA), Wilder’s Moving Average (RMA), Weighted Moving Average (WMA), Moving Average Convergence Divergence (MACD), and Volume-Weighted Moving Average (VWMA). Moving average lengths are defined in the menu and apply only to strategy-enabled assets.
To accurately replicate real-world portfolio conditions, users can choose between daily, weekly, monthly, or quarterly rebalancing frequencies and decide whether cash is held or redistributed. Daily rebalancing maintains constant portfolio weights, while longer intervals allow natural drift. When cash positions are not allowed, capital from bearish assets is automatically redistributed proportionally among bullish assets, ensuring the portfolio remains fully invested at all times. The table displays a comprehensive set of widely used institutional-grade performance metrics:
CAGR = Compounded annual growth rate of returns.
Volatility = Annualized standard deviation of returns.
Sharpe = CAGR per unit of annualized standard deviation.
Sortino = CAGR per unit of annualized downside deviation.
Calmar = CAGR relative to maximum drawdown.
Max DD = Largest peak-to-trough decline in value.
Beta (β) = Sensitivity of returns relative to benchmark returns.
Alpha (α) = Excess annualized risk-adjusted returns relative to benchmark.
Upside = Ratio of average return to benchmark return on up days.
Downside = Ratio of average return to benchmark return on down days.
Tracking = Annualized standard deviation of returns versus benchmark.
Turnover = Average sum of absolute changes in weights per year.
Cumulative returns are displayed on each label as the total percentage gain from the selected start date, with green indicating positive returns and red indicating negative returns. In the table, baseline metrics serve as the benchmark reference and are always gray. For portfolio metrics, green indicates outperformance relative to the baseline, while red indicates underperformance relative to the baseline. For strategy metrics, green indicates outperformance relative to both the baseline and the portfolio, red indicates underperformance relative to both, and gray indicates underperformance relative to either the baseline or portfolio. Metrics such as Volatility, Tracking Error, and Turnover ratio are always displayed in gray as they serve as descriptive measures.
In summary, the Portfolio Strategy Tester is a comprehensive backtesting tool designed to help investors evaluate different trend-following strategies on custom portfolios. It enables real-world simulation of both active and passive investment approaches and provides a full set of standard institutional-grade performance metrics to support data-driven comparisons. While results are based on historical performance, the model serves as a powerful portfolio management and research framework for developing, validating, and refining systematic investment strategies.

AI Bot Regime Feed (v6) — stableThis indicator generates real-time, structured JSON alerts for external trading bots or automation systems.
It combines multiple technical layers to identify market regimes and high-probability buy/sell events, and sends them to any webhook endpoint (e.g., a FastAPI or Zapier listener).

MAxRSI Signals [KedArc Quant]Description:
MAxRSI Indicator Marks LONG/SHORT signals from a Moving Average crossover and (optionally) confirms them with RSI. Includes repaint-safe confirmation, optional higher-timeframe (HTF) smoothing, bar coloring, and alert conditions.
Why combine MA + RSI
* The MA crossover is the primary trend signal (fast trend vs slow trend).
* RSI is a gate, not a second, separate signal. A crossover only becomes a trade signal if momentum agrees (e.g., RSI ≥ level for LONG, ≤ level for SHORT). This reduces weak crosses in ranging markets.
* The parts are integrated in one rule: *Crossover AND RSI condition (if enabled)* → plot signal/alert. No duplicated outputs or unrelated indicators.
How it works (logic)
* MA types: SMA / EMA / WMA / HMA (HMA is built via WMA of `len/2` and `len`, then WMA with `sqrt(len)`).
* Signals:
* LONG when *Fast MA crosses above Slow MA* and (if enabled) *RSI ≥ Long Min*.
* SHORT when *Fast MA crosses below Slow MA* and (if enabled) *RSI ≤ Short Max*.
* Repaint-safe (optional): confirms crosses on closed bars to avoid intrabar repaint.
* HTF (optional): computes MA/RSI on a higher timeframe to smooth noise on lower charts.
* Alerts: crossover alerts + state-flip (bull↔bear) alerts.
How to use (step-by-step)
1. Add to chart. Set MA Type, Fast and Slow (keep Fast < Slow).
2. Turn Use RSI Filter ON for confirmation (default: RSI 14 with 50/50 levels).
3. (Optional) Turn Repaint-Safe ON for close-confirmed signals.
4. (Optional) Turn HTF ON (e.g., 60 = 1h) for smoother signals on low TFs.
5. Enable alerts: pick “MAxRSI Long/Short” or “Bullish/Bearish State”.
Timeframe guidance
* Intraday (1–15m): EMA 9–20 fast vs EMA 50 slow, RSI filter at 50/50.
* Swing (1h–D): EMA 20 fast vs EMA 200 slow, RSI 50/50 (55/45 for stricter).
What makes it original
* Repaint-safe cross confirmation (previous-bar check) for reliable signals/alerts.
* HTF gating (doesn’t compute both branches) for speed and clarity.
* Warning-free MA helper (precomputes SMA/EMA/WMA/HMA each bar), HMA built from built-ins only.
* State-flip alerts and optional RSI overlay on price pane.
Built-ins used
`ta.sma`, `ta.ema`, `ta.wma`, (HMA built from these), `ta.rsi`, `ta.crossover`, `ta.crossunder`, `request.security`, `plot`, `plotshape`, `barcolor`, `alertcondition`, `input.*`, `math.*`.
Note: Indicator only (no orders). Test settings per symbol. Not financial advice.
⚠️ Disclaimer
This script is provided for educational purposes only.
Past performance does not guarantee future results.
Trading involves risk, and users should exercise caution and use proper risk management when applying this strategy.

Trend ChannelThis Trend Channel is designed to simplify how traders view trends, while also keeping track of potential shifts in trends with signals. It is designed for traders that prefer less over more.
The indicator can be used for trend following, trend reversals and confirmation in combination with price or other indicators.
At the core is one EMA and a smoothed volatility based channel around it.
The purpose of the channel is to avoid false signals on trend reclaim or trend loss and instead identify trend deviations.
The indicator also incorporates long and short EMA cross-over signals to recognize possible shifts in trend without having to overlay multiple EMAs and keep the chart cleaner.
Additionally the indicator fires warnings for potential false signals on golden/death crosses with a letter "W" above/below the signal candle. Those warnings are based on the distance between price and the crossover. When the distance is above a certain threshold the indicator fires a warning that price might mean revert.
Traders can customize all inputs in the settings.

RMA Smoothed RSIRMA Smoothed RSI
Description:
An enhanced RSI built for cleaner intraday and swing reads. It applies RMA smoothing to damp noise.
How It Works
RSI (RMA-Smoothed):
Computes classic RSI from price changes and smooths the result with an additional RMA (user-controlled 3–7, where 5 is the sweet spot). This reduces whipsaw while preserving shifts in momentum.
How to Interpret
50 Midline = Bias Filter: Above 50 favors strength; below 50 favors weakness.
RSI vs RSI-MA Crosses: Cross up can precede thrust or mean-revert toward 50; cross down the opposite.
Inputs
Length: RSI period (default 14).
Source: Price source for RSI (default Close).
Smoothing: RMA smoothing length on RSI (3–7; default 3; 5 sweet spot).
Calculate Divergence: Toggle to compute pivots/divergences and enable alerts.
Moving Average Type: None, SMA, EMA, WMA, VWMA (default EMA).
MA Length: Length of the RSI-based MA (separate from RSI length).
Best For
Traders who want a cleaner RSI read without losing responsiveness.
Scalpers timing momentum shifts around the 50 line and MA crosses.
Swing traders using divergences as early reversal context.
Pro Tips
For fast intraday charts, start with Length 14, Smoothing 3–5, and EMA as the RSI-MA.
Use 50 reclaims/rejections as a simple regime filter.
Combine divergence labels with volume surges, key S/R, or volatility tools (e.g., BBW/TTM squeeze) to time entries.
Divergence alerts fire only if Calculate Divergence is enabled—keep it on if you rely on signals.

[GrandAlgo] Moving Averages Cross LevelsMoving Averages Cross Levels
Many traders watch for moving average crossovers – such as the golden cross (50 MA crossing above 200 MA) or death cross – as signals of changing trends. However, once a crossover happens, the exact price level where it occurred often fades from view, even though that level can be an important reference point. Moving Averages Cross Levels is an indicator that keeps those crossover price levels visible on your chart, helping you track where momentum shifts occurred and how price behaves relative to those key levels.
This tool plots horizontal line segments at the price where each pair of selected moving averages crossed within a recent window of bars. Each level is labeled with the moving average lengths (for example, “21×50” for a 21/50 MA cross) and is color-coded – green for bullish crossovers (short-term MA crossing above long-term MA) and red for bearish crossunders (short-term crossing below). By visualizing these crossover levels, you can quickly identify past trend change points and use them as potential support/resistance or decision levels in your trading. Importantly, this indicator is non-repainting – once a crossover level is plotted, it remains fixed at the historical price where the cross occurred, allowing you to continually monitor that level going forward. (As with any moving average-based analysis, crossover signals are lagging, so use these levels in conjunction with other tools for confirmation.)
Key Features:
✅ Multiple Moving Averages: Track up to 7 different MAs (e.g. 5, 8, 21, 50, 64, 83, 200 by default) simultaneously. You can enable/disable each MA and set its length, allowing flexible combinations of short-term and long-term averages.
✅ Selectable MA Type: Each average can be calculated as a Simple (SMA), Exponential (EMA), Volume-Weighted (VWMA), or Smoothed (RMA) moving average, giving you flexibility to match your preferred method.
✅ Auto Crossover Detection: The script automatically detects all crosses between any enabled MA pairs, so you don’t have to specify pairs manually. Whether it’s a fast cross (5×8) or a long-term cross (50×200), every crossover within the lookback period will be identified and marked.
✅ Horizontal Level Markers: For each detected crossover, a horizontal line segment is drawn at the exact price where the crossover occurred. This makes it easy to glance at your chart and see precisely where two moving averages intersected in the recent past.
✅ Labeled and Color-Coded: Each crossover line is labeled with the two MA lengths that crossed (e.g. “50×200”) for clear identification. Colors indicate crossover direction – by default green for bullish (positive) crossovers and red for bearish (negative) crossovers – so you can tell at a glance which way the trend shifted. (You can customize these colors in the settings.)
✅ Adjustable Lookback: A “Crosses with X candles” input lets you control how far back the script looks for crossovers to plot. This prevents your chart from getting cluttered with too many old levels – for example, set X = 100 to show crossovers from roughly the last 100 bars. Older crossover lines beyond this lookback window will automatically clear off the chart.
✅ Optional MA Plots: You can toggle the display of each moving average line on the chart. This means you can either view just the crossover levels alone for a clean look, or also overlay the MA curves themselves for additional context (to see how price and MAs were moving around the crossover).
✅ No Repainting or Hindsight Bias: Once a crossover level is plotted, it stays at that fixed price. The indicator doesn’t move levels around after the fact – each line is a true historical event marker. This allows you to backtest visually: see how price acted after the crossover by observing if it retested or respected that level later.
How It Works:
1️⃣ Add to Chart & Configure – Simply add the indicator to your chart. In the settings, choose which moving averages you want to include and set their lengths. For example, you might enable 21, 50, 200 to focus on medium and long-term crosses (including the golden cross), or turn on shorter MAs like 5 and 8 for quick momentum shifts. Adjust the lookback (number of bars to scan for crosses) if needed.
2️⃣ Visualization – The script continuously checks the latest X bars for any points where one MA crossed above or below another. Whenever a crossover is found, it calculates the exact price level at which the two moving averages intersected. On the last bar of your chart, it will draw a horizontal line segment extending from the crossover bar to the current bar at that price level, and place a label to the right of the line with the MA lengths. Green lines/labels signify bullish crossovers (where the first MA crossed above the second), and red lines indicate bearish crossunders.
3️⃣ On Your Chart – You will see these labeled levels aligned with the price scale. For example, if a 50 MA crossed above a 200 MA (bullish) 50 bars ago at price $100, there will be a green “50×200” line at $100 extending to the present, showing you exactly where that golden cross happened. You might notice price pulling back near that level and bouncing, or if price falls back through it, it could signal a failed crossover. The indicator updates in real-time: if a new crossover happens on the latest bar, a new line and label will instantly appear, and if any old cross moves out of the lookback range, its line is removed to keep the chart focused.
4️⃣ Customization – You can fine-tune the appearance: toggle any MA’s visibility, change line colors or label styles, and modify the lookback length to suit different timeframes. For instance, on a 1-hour chart you might use a lookback of 500 bars to see a few weeks of cross history, whereas on a daily chart 100 bars (about 4–5 months) may be sufficient. Adjust these settings based on how many crossover levels you find useful to display.
Ideal for Traders Who:
Use MA Crossovers in Strategy: If your strategy involves moving average crossovers (for trend confirmation or entry/exit signals), this indicator provides an extra layer of insight by keeping the price of those crossover events in sight. For example, trend-followers can watch if price stays above a bullish crossover level as a sign of trend strength, or falls below it as a sign of weakness.
Identify Support/Resistance from MA Events: Crossover levels often coincide with pivot points in market sentiment. A crossover can act like a regime change – the level where it happened may turn into support or resistance. This tool helps you mark those potential S/R levels automatically. Rather than manually noting where a golden cross occurred, you’ll have it highlighted, which can be useful for setting stop-losses (e.g. below the crossover price in a bullish scenario) or profit targets.
Track Multiple Averages at Once: Instead of focusing on just one pair of moving averages, you might be interested in the interaction of several (short, medium, and long-term trends). This indicator caters to that by plotting all relevant crossovers among your chosen MAs. It’s great for multi-timeframe thinkers as well – e.g. you could apply it on a higher timeframe chart to mark major cross levels, then drill down to lower timeframes knowing those key prices.
Value Clean Visualization: There are no flashing signals or arrows – just simple lines and labels that enhance your chart’s storytelling. It’s ideal if you prefer to make trading decisions based on understanding price interaction with technical levels rather than following automatic trade calls. Moving Averages Cross Levels gives you information to act on, without imposing any bias or strategy – you interpret the crossover levels in the context of your own trading system.

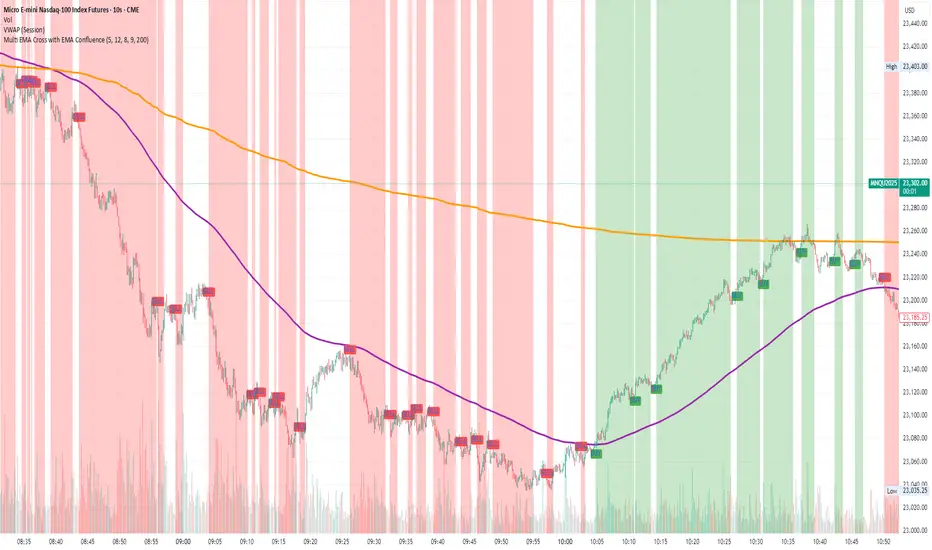
Multi EMA Cross with EMA ConfluenceMulti EMA Cross with EMA Confluence
This indicator combines the power of multiple EMA crossovers with a higher-timeframe confluence filter to help traders visualize potential bullish and bearish conditions on their charts.
Two groups of EMAs work together to establish alignment:
Group 1 (Fast / Slow Pair) – Shorter-term momentum shifts
Group 2 (Fast / Slow Pair) – Broader trend confirmation
On top of that, an optional Confluence EMA (default 200 EMA) acts as an additional filter, ensuring that signals align with the larger market trend.
Key features:
Customizable EMA lengths, colors, and confluence settings
Background highlighting when conditions align bullish or bearish
Clear buy/sell labels when new conditions trigger
Flexible enough to adapt across timeframes and trading styles
This tool is designed to enhance chart clarity and help you stay aligned with momentum and trend. It is not meant to replace your own analysis but rather to complement it.
Disclaimer: This script is for educational and informational purposes only. It is not financial advice. Trading involves risk, and you should always do your own research or consult with a licensed financial professional before making investment decisions.
Cnagda Trading ToolCnagda Trading Tools - complete set of intraday trading
1. Trendline breakout based On ATR.
2. Live RSI, volume/candle average 20 Periods, trend direction last 34 periods, and some useful dashboard features.
3. Ma Scalp Line provide trend support and resistance + Where Line More Flat Previous Time You Also Use That Range As Support And Resistance
4. RSI based POC ( Point Of Control) indicate high Volume Area like fixed Range Volume profile
5. London session breakout with buy/sell Signal and NewYork session opening half hour range breakout with Buy/sell signal
Ma Scalp Buy And Sell Signal For Short term Scalping ( 5 Min Timeframe) Based on Ema And Wma Crossover
I hope these tools will improve your trading, but you should trade only after proper research, this indicator is not responsible for any loss.

EMA 9/21 Crossover Alert (BerryRight)This indicator gives entry signals through EMA crossover and the gives the opportunity to set up alerts. I will update this indicator with exits in the future. it's written in Pinesctipt v5

Wavelet-Trend ML Integration [Alpha Extract]Alpha-Extract Volatility Quality Indicator
The Alpha-Extract Volatility Quality (AVQ) Indicator provides traders with deep insights into market volatility by measuring the directional strength of price movements. This sophisticated momentum-based tool helps identify overbought and oversold conditions, offering actionable buy and sell signals based on volatility trends and standard deviation bands.
🔶 CALCULATION
The indicator processes volatility quality data through a series of analytical steps:
Bar Range Calculation: Measures true range (TR) to capture price volatility.
Directional Weighting: Applies directional bias (positive for bullish candles, negative for bearish) to the true range.
VQI Computation: Uses an exponential moving average (EMA) of weighted volatility to derive the Volatility Quality Index (VQI).
Smoothing: Applies an additional EMA to smooth the VQI for clearer signals.
Normalization: Optionally normalizes VQI to a -100/+100 scale based on historical highs and lows.
Standard Deviation Bands: Calculates three upper and lower bands using standard deviation multipliers for volatility thresholds.
Signal Generation: Produces overbought/oversold signals when VQI reaches extreme levels (±200 in normalized mode).
Formula:
Bar Range = True Range (TR)
Weighted Volatility = Bar Range × (Close > Open ? 1 : Close < Open ? -1 : 0)
VQI Raw = EMA(Weighted Volatility, VQI Length)
VQI Smoothed = EMA(VQI Raw, Smoothing Length)
VQI Normalized = ((VQI Smoothed - Lowest VQI) / (Highest VQI - Lowest VQI) - 0.5) × 200
Upper Band N = VQI Smoothed + (StdDev(VQI Smoothed, VQI Length) × Multiplier N)
Lower Band N = VQI Smoothed - (StdDev(VQI Smoothed, VQI Length) × Multiplier N)
🔶 DETAILS
Visual Features:
VQI Plot: Displays VQI as a line or histogram (lime for positive, red for negative).
Standard Deviation Bands: Plots three upper and lower bands (teal for upper, grayscale for lower) to indicate volatility thresholds.
Reference Levels: Horizontal lines at 0 (neutral), +100, and -100 (in normalized mode) for context.
Zone Highlighting: Overbought (⋎ above bars) and oversold (⋏ below bars) signals for extreme VQI levels (±200 in normalized mode).
Candle Coloring: Optional candle overlay colored by VQI direction (lime for positive, red for negative).
Interpretation:
VQI ≥ 200 (Normalized): Overbought condition, strong sell signal.
VQI 100–200: High volatility, potential selling opportunity.
VQI 0–100: Neutral bullish momentum.
VQI 0 to -100: Neutral bearish momentum.
VQI -100 to -200: High volatility, strong bearish momentum.
VQI ≤ -200 (Normalized): Oversold condition, strong buy signal.
🔶 EXAMPLES
Overbought Signal Detection: When VQI exceeds 200 (normalized), the indicator flags potential market tops with a red ⋎ symbol.
Example: During strong uptrends, VQI reaching 200 has historically preceded corrections, allowing traders to secure profits.
Oversold Signal Detection: When VQI falls below -200 (normalized), a lime ⋏ symbol highlights potential buying opportunities.
Example: In bearish markets, VQI dropping below -200 has marked reversal points for profitable long entries.
Volatility Trend Tracking: The VQI plot and bands help traders visualize shifts in market momentum.
Example: A rising VQI crossing above zero with widening bands indicates strengthening bullish momentum, guiding traders to hold or enter long positions.
Dynamic Support/Resistance: Standard deviation bands act as dynamic volatility thresholds during price movements.
Example: Price reversals often occur near the third standard deviation bands, providing reliable entry/exit points during volatile periods.
🔶 SETTINGS
Customization Options:
VQI Length: Adjust the EMA period for VQI calculation (default: 14, range: 1–50).
Smoothing Length: Set the EMA period for smoothing (default: 5, range: 1–50).
Standard Deviation Multipliers: Customize multipliers for bands (defaults: 1.0, 2.0, 3.0).
Normalization: Toggle normalization to -100/+100 scale and adjust lookback period (default: 200, min: 50).
Display Style: Switch between line or histogram plot for VQI.
Candle Overlay: Enable/disable VQI-colored candles (lime for positive, red for negative).
The Alpha-Extract Volatility Quality Indicator empowers traders with a robust tool to navigate market volatility. By combining directional price range analysis with smoothed volatility metrics, it identifies overbought and oversold conditions, offering clear buy and sell signals. The customizable standard deviation bands and optional normalization provide precise context for market conditions, enabling traders to make informed decisions across various market cycles.

Pucci Trend EMA-SMA Crossover with TolerancePucci Trend EMA-SMA Crossover with Tolerance
This indicator helps identify market trends and generates trading signals based on the crossover between an Exponential Moving Average (EMA) and a Simple Moving Average (SMA) with an adjustable tolerance threshold. The signals work as follows:
Buy Signal (B) -> Triggers when the EMA crosses above the SMA, exceeding a user-defined tolerance (in basis points). Optionally, a price filter can require the high or low to be below the EMA for confirmation.
Sell Signal (S) -> Triggers when the SMA crosses above the EMA, exceeding the tolerance. The optional price filter may require the high or low to be above the EMA.
The tolerance helps reduce false signals by requiring a minimum distance between the moving averages before confirming a crossover. The price filter adds an extra confirmation layer by checking if price action respects the EMA level.
Important Notes:
1º No profitability guarantee: This tool is for analysis only and may generate losses.
2º "As Is" disclaimer: Provided without warranties or responsibility for trading outcomes.
3º Use Stop Loss: Users must determine their own risk management.
4º Parameter adjustment needed: Optimal MA periods and tolerance vary by timeframe.
5º Filter impact varies: Enabling/disabling the price filter may improve or worsen performance.

Hull MA Channel with Filtered CrossoversI've created an indicator that let's you create a HMA channel with 2 displaced HMA (A/B). As well as a HMA crossover set (C/D).
Here's how it works:
The HMA crossovers from C and D will not signal unless they are outside of the channel of A and B. As a matter of fact, NO buy signal whatsoever will occur above the channel and NO sell signal will occur below the channel.
The crossover HMA pair (C/D) can have their lengths adjusted to the 0.00 decimal point for VERY fine tuning of the crossovers.
(edit-it doesn't fine tune to the .00. This must not be a feature that is able to be utilized. I tried) The length adjustment still works to the nearest whole number. The .00 are mute :(
In keeping with that same logic, you can adjust the displacement of the channel independently to the 0.00 decimal, again for VERY fine tuning.
This is great for reversals while eliminating noise from false signals, keeping the chart nice and clean. Should be used in combination with other indicators for the best confirmations.
RSI-EMA-Crossing with Donchian-Stop-LossThe Donchian RSI Indicator is a visual tool that combines momentum and trend analysis to identify high-quality long opportunities based on RSI crossovers, price action, and Donchian channel dynamics.
How It Works
Momentum Signal: A bullish RSI crossover is detected when the RSI crosses above its moving average.
Trend Filter: A signal is only valid if the crossover occurs while the price is above its moving average – filtering out entries against the prevailing trend.
Signal Candle: The high of the crossover candle is stored.
Entry Trigger: A valid signal occurs when a later candle closes above that signal high.
Stop-Loss (Visual Only)
The lower band of the Donchian Channel acts as a visual reference for a dynamic stop-loss level.
Features
Customizable RSI, Donchian Channel, and moving average lengths
Selectable MA types: SMA, EMA, WMA, VWMA, HMA
Signal candle highlighted (yellow background)
Entry points labeled on the chart
Price MA and Donchian Channel plotted
Trend filter improves signal quality by confirming upward bias
Use Case
Designed for swing and position traders
Optimized for use on daily or 4H charts

MTF RSI & SMA Crossover [OB/OS Filtered Signals]MTF RSI & SMA Crossover
This custom indicator combines the power of Multi-Timeframe (MTF) RSI, Simple Moving Average (SMA), and overbought/oversold (OB/OS) conditions to provide precise buy and sell signals based on the crossovers of the RSI and its SMA. The indicator includes the following features:
MTF RSI: The Relative Strength Index (RSI) is calculated on a customizable timeframe, giving traders the ability to analyze price momentum across different timeframes.
SMA of RSI: The RSI is smoothed using a Simple Moving Average (SMA), helping to filter out market noise and identify clearer trend reversals.
Overbought/Oversold Filter: Signals are only triggered when the RSI has been in an overbought (above 70) or oversold (below 30) condition, improving the reliability of potential trend reversals.
Buy/Sell Signals:
Buy signals occur when the RSI crosses above its SMA after being oversold, indicating potential upward momentum.
Sell signals occur when the RSI crosses below its SMA after being overbought, indicating potential downward momentum.
Customizable Label Colors: Choose your own colors for the "BUY" and "SELL" labels to match your chart's design and preferences.
Alerts: Set alerts for buy and sell signals, ensuring you don't miss a potential trade.
This indicator is ideal for traders who want to capture trend reversals and momentum shifts while filtering out false signals by using overbought and oversold conditions. Customize the settings to suit your trading style and strategy.
