Session Range and Breakout Summary
This script presents the session range and post session movements relative to that range of all the majors and crosses on a single page. You can also set it to a daily range and weekly range (beta). It will even show you the pip value of the range. I made the indicator to easily stay on top of market movements at london open relative to the Asia session range. Its very easy to see which entire currency group is breaking its asia range WHIST ITS HAPPENING. Focus on NZD in the examples as it was the market lead today - I was able to get some of it when I saw the entire group breaking its range
Showing all the majors and crosses relative to the Asia range (00:00 - 07:00 GMT)
Active 'show on chart' to verify the indicator is measuring the range correctly. Compare below to the NZD box above - you can see how NZD had control of the market this morning and all NZD pairs broke out of their ranges.
'PIP MODE' - active pip mode to see what the pip range was of the session
Notes
The information is presented RELATIVELY - this means that all the ranges and movements are scaled to be the same size. You are therefore seeing the movements relative to their ranges. When you see a breakout it relative to the size of the range - for example, if GBPJPY had a range of 50pips and breaks out of the range by 100 pip and GBPEUR has a range of 20 pips and breaks out by 40 pips they have both broken out double the range and will be displayed as the same distance.
The indicator will show the movements whilst the range is forming. I did this so I can see what the groups are doing before Europe open and be ready - such as lingering at the top end of its INCOMPLETE asia range. Be aware through that if the lines are flat at the top of the range WHILST THE RANGE IS STILL FORMING this does not mean price was flat, it means that price was pushing up and growing the range. (Price can't breakout until the range has formed at the end of the session)
The currency pairs are organised to show the strength or weakness of the selected group - this means that the base currency is always the select group. This is to present the data with currencies moving in the same direction rather than some reversed but meaning the same in relation to currency strength. In the NZD example:
NZDAUD (not AUDNZD )
NZDCAD
NZDCHF
NZDEUR (not EURNZD )
NZDGBP (not GBPNZD )
NZDJPY
NZDUSD
I hope its useful. This is the most powerful indicator I've managed to write yet. It was difficult to make the code efficient enough to fit into the pinescript limit and still do everything.
Correlation

Divergence Indicator [Nic]This divergence indicator can track the correlation between one or more symbols. I use it to track the divergences between the VIX volatility index, gold, bonds, as well as other market leading indicators.
When using with Vix, lower coefficients can lead to false signals. When in a high vix bear market signals, there is more noise and more false (or missing) signals can occur. Please use with other technical tools.

Voss Predictor (A Peek Into the Future) - Dr. John EhlersI have been sitting on this for over a year, but I now present this "Voss Predictive Filter" multicator employing PSv4.0 upon initial release, originally formulated by the great and empowering Dr. John Ehlers for TASC - August 2019 Traders Tips. This is a slightly modified version of the original indicator John Ehlers designed. My improved implementation is an all-in-one combination of three indicators, consisting of Ehlers' 2-pole bandpass filter, fed into the Voss predictor, and my Correlation Color. I also purposefully attempted to make this indicator work on both "Light" and "Dark" charts equally well.
You can search for this indicator's white paper, entitled "A PEEK INTO THE FUTURE By John Ehlers", on his site in the educational reference section. It's VERY important that you fully grasp how this indicator works and when it doesn't during trending price movements. According to "TV House Rules", I can't link directly to his white paper on his web site. Technically he's a vendor, even though it has been divulged to me, that he is intending to retire after his last and final wØℾk$#Øp, where he is publicly disseminating the bulk of his unpublished proprietary code that drives his other website VERY SOON.
I love John Ehlers in a respectfully appreciative manner and he is my hero in life! I simply don't revel about pretended celebrities and supposed rock stars. I will never be able to adequately explain to you how much he has influenced me AND this website as it currently exists AND what is in store for the future of the ever evolving "Power of Pine". His inspiring legacy of code poetry shall forever be immortally enshrined here on TV and influence it.
Back to the topic of interest, this script originating from John Ehlers' mind... This indicator helps to anticipate cyclic turning points via negative group delay. It is NOT a predictive crystal ball. Do not become cluelessly disillusioned by it's title. I need to explain.
For example, this indicator could not have anticipated that the bold faced lie of "15 Days to Slow the Spread" of the CHImeravirus "plandemic" in the USA, would turn into our factual reality of multi state mandated orders demanding months of unconstitutional prison cell styled lockdowns with closures and the absurd criminalization of not wearing a mouth mask made from underwear while not being evidently ill, additionally combined with 24/7 black magick mass hypnosis spoon feeding non-scientific fear based psychological propaganda from the world's "finest" epidemiological data analysts and misleaders, eventually decimating the world's markets into zombie economies with abhorrent results of long term massive unemployment and financial hardship on a chart scale never before witnessed. Yep, it's NOT capable of predetermining any of that. I just wanted to make that very clear by example in a metaphorical manner many people can relate to concerning Voss' ability to anticipate.
The indicator consists of a bandpass filter coupled to the Voss predictor. Also, one thing about the Voss predictor, it can catch minute turning points or even false ones as explained in the white paper. So... I included my Correlation Color as a fitting companion to aid you in filtering out false signals during trending price movements. The Voss Predictive Filter should never be used alone, be forewarned!
Features List Includes:
Dark Background - Easily disabled in indicator Settings->Style for "Light" charts or with Pine commenting
AND a few more... Why list them, when you have the source code to explore!
When available time provides itself, I will consider your inquiries, thoughts, and concepts presented below in the comments section, should you have any questions or comments regarding this indicator. When my indicators achieve more prevalent use by TV members , I may implement more ideas when they present themselves as worthy additions. Have a profitable future everyone!

VIX CorrelationIndicator tracks the 10 day correlation with VIX. I prefer to use this with SPY. Can be a great way to flag tops/melt-ups.
Default settings are set to when the correlation is above 0.2, bars turn red, but you can change this.

AutocorrelogramFast estimation of an autocorrelogram, more commonly called autocorrelation function (ACF). The script sets the maximum lag as 10*log10(N)-1 and sets the autocorrelation at lag 0 to 1.
Length controls the number of past observations of Src to use as input, while Differentiate Src perform first order differencing to Src before calculating the autoccorelations.
The ACF can return a lot of information, for technical analysis, the ACF can be used to determine whether the market is trending or ranging. Without prior processing, we expect trending prices to have a slowly decaying ACF with significant autocorrelation at each lag, while ranging prices will have an ACF that decay faster toward 0.
I won't post a lot on this profile, I'll post most of my future work on the LuxAlgo profile instead, link in the signature.

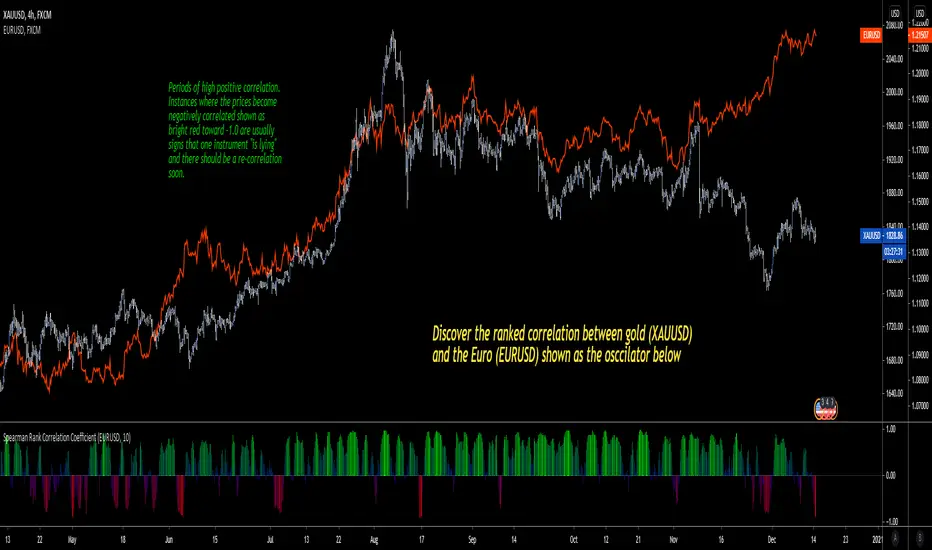
Spearman Rank Correlation CoefficientI'm pleased to introduce this script in honor of the new array functions introduced to PineScript version 4.0. This update is a long time coming and opens the door to amazing scripting possibilities!
Definition
Named after Charles Spearman and denoted by the Greek letter ‘ ρ ’ (rho), the Spearman rank correlation coefficient is the nonparametric version of the Pearson correlation coefficient . Use the Spearman rank correlation when you have two ranked variables, and you want to see whether the two variables covary. That is, as one variable increases/decreases, the other variable tends to increase/decrease respectively.
It is best used to discover if two variables (and in this first version of the indicator, two ticker symbols) increase and decrease together. There are advantages to using this version of correlation vs. the Pearson R.
Interpretation
The value oscillates between +1 and -1.
A value of +1 means the two variables are perfectly correlated, that is they are increasing and decreasing together in perfect harmony.
A value of -1 means the two variables exhibit a perfect negative correlation, that is they increase and decrease oppositely.
A value of zero means the two variables are not correlated at all (noise).
Neglected Volume by DGTVolume is one piece of information that is often neglected, however, learning to interpret volume brings many advantages and could be of tremendous help when it comes to analyzing the markets. In addition to technicians, fundamental investors also take notice of the numbers of shares traded for a given security.
What is Volume?
The volume represents all the recorded trades for a security that occurs in a given time interval. It is a measurement of the participation, enthusiasm, and interest in a given security. Think of volume as the force that drives the market. Volume substantiates, energizes, and empowers price. When volume increases, it confirms price direction; when volume decreases, it contradicts price direction.
In theory, increases in volume generally precede significant price movements. However, If the price is rising in an uptrend but the volume is reducing or unchanged, it may show that there’s little interest in the security, and the price may reverse.
A high volume usually indicates more interest in the security and the presence of institutional traders. However, a rapidly rising price in an uptrend accompanied by a huge volume may be a sign of exhaustion.
Traders usually look for breaks of support and resistance to enter positions. When security break critical levels without volume, you should consider the breakout suspect and prime for a reversal off the highs/lows
Volume spikes are often the result of news-driven events. Volume spike will often lead to sharp reversals since the moves are unsustainable due to the imbalance of supply and demand
note : there’s no centralized exchange where trades are recorded, so the volume data represents what happens at a particular exchange only
In most charting platforms, the volume indicator is presented as color-coded bars, green if the security closes up and red if the security closed lower, where the height of the bars show the amount of the recorded trades
Within this study, Relative Volume , Volume Weighted Bars and Volume Moving Average are presented, where Relative Volume relates current trading volume to past trading volume over long period, Volume Weighted Bars presents price bars colored based on short period past trading volume average, and Volume Moving Average is average of volume over shot period
Relative Volume is presented as color-coded bars similar to regular Volume indicator but uses four color codes instead two. Notable increases of volume are presented in green and red while average values with back and gray, hence adding ability to emphasis notable increases in the volume. It is kind of a like a radar for how "in-play" a security is. Users are allowed to change the threshold, default value is set to Fibonacci golden ration standard deviation away from its moving average.
Volume Weighted Bars, a study of Kıvanç Özbilgiç, aims to present if price movements are supported by Volume. Volume Weighted Bars are calculated based on shot period volume moving average which will reflect more recent changes in volume. Price actions with high volume will be displayed with darker colors, average volume values will remain as they are and low volume values will be indicated with lighter colors.
Volume Moving Average, Is short period volume moving average, aims to display visually the volume changes. Please not that Relative Volume bars are calculated based on standard deviation of long volume moving average.
What Else?
Apart from the volume itself, your ability to assess what volume is telling you in conjunction with price action can be a key factor in your ability to turn a profit in the market. It makes little sense to analyze the volume alone. To correctly interpret the volume data, it shall be seen in the light of what the price is doing. there are a lot of other indicators that are based on the volume data as well as price action. Analysing those volume indicators has always helped traders and investors to better understand what is happening in the market.
Here are the ones adapted with this study. Some of them used as a source for our aim, some adapted as they are with slight changes to fit visually to this study and please note that the numerical presentation may differ from their regular use
• On Balance Volume
• Divergence Indicator
• Correlation Coefficient
• Chaikin Money Flow
Shortly;
On Balance Volume
The On Balance Volume indicator, is a technical analysis indicator that relates volume flow to changes in a security’s price. It uses a cumulative total of positive and negative trading volume to predict the direction of price. The OBV is a volume-based momentum oscillator, so it is a leading indicator — it changes direction before the price
Granville, creator of OBV, proposed the theory that changes in volume precede price movements in a measurable way. He believed that volume was the main force behind major market moves and thought of OBV’s prediction of price changes as a compressed spring that expands rapidly when released.
It is believed that the OBV shows the interactions between the institutional and retail traders in the market
If the price makes a new high, the OBV should also make a new high. If the OBV makes a lower high when the price makes a higher high, there’s a classical bearish divergence — indicating that only the retail traders are buying. Another type of bearish divergence occurs when the price remains relatively quiet and fails to make a higher high but the OBV soars higher than the previous high — indicating that the institutional traders are accumulating short positions. On the other hand, if the price makes a lower low and the OBV makes a higher low, there is a classical bullish divergence, showing that the institutional traders don’t believe in that move
With this study, Momentum and Acceleration (optional) of OBV is calculated and presented, where momentum is most commonly referred to as a rate and measures the acceleration of the price and/or volume of a security. It is also referred to as a technical analysis indicator and oscillator that is able to determine market trends.
Additionally, smoothing functionality with Least Squares Method is added
Divergences especially, should always be noted as a possible reversal in the current trend, so the divergence indicator is adapted with this study where the Momentum of OBV is assumed as Oscillator with similar usages as to RSI. Divergence is most often used to track and analyze the momentum in an asset’s price and the odds of a price reversal within the current trend. The divergence indicator warns traders and technical analysts of changes in a price/volume trend, oftentimes that it is weakening or changing direction.
Correlation Coefficient
The correlation coefficient is a statistical measure of the strength of the relationship between the relative movements of two variables. A correlation of -1.0 shows a perfect negative correlation, while a correlation of 1.0 shows a perfect positive correlation. A correlation of 0.0 shows no linear relationship between the movement of the two variables. In other words, the closer the Correlation Coefficient is to 1.0, indicates the instruments will move up and down together as it is mostly expected with volume and price. So the Correlation Coefficient Indicator aims to display when the price and volume (on balance volume) is in correlation and when not. With this study blue represent positive correlation while orange negative correlation. The strength of the correlation is determined by the width of the bands, to emphasis the effect horizontal lines are drawn with values set to 0.5 and -0.5. the values above 0.5 (or below -0.5) shows stronger correlation.
Chaikin Money Flow , provide optionally as a companion indicator
The Chaikin money flow indicator (CMF) is a volume indicator that measures the money flow volume over a chosen period. The money flow volume is a measure of the volume and where the price closed relative to the trading session’s range. It comes from the idea that buying pressure is indicated by a rising volume and recurrent closes in the upper part of the session’s price range while selling pressure is demonstrated by an increasing volume and repeated closes in the lower part of the price range.
Both buying and selling pressures are accompanied by an increase in volume, but the location of the closing prices are in accordance with the direction of price
Special thanks to @InvestCHK and @hjsjshs , who have enormously contributed while preparing this study
related studies:
Disclaimer:
Trading success is all about following your trading strategy and the indicators should fit within your trading strategy, and not to be traded upon solely
The script is for informational and educational purposes only. Use of the script does not constitute professional and/or financial advice. You alone have the sole responsibility of evaluating the script output and risks associated with the use of the script. In exchange for using the script, you agree not to hold dgtrd TradingView user liable for any possible claim for damages arising from any decision you make based on use of the script

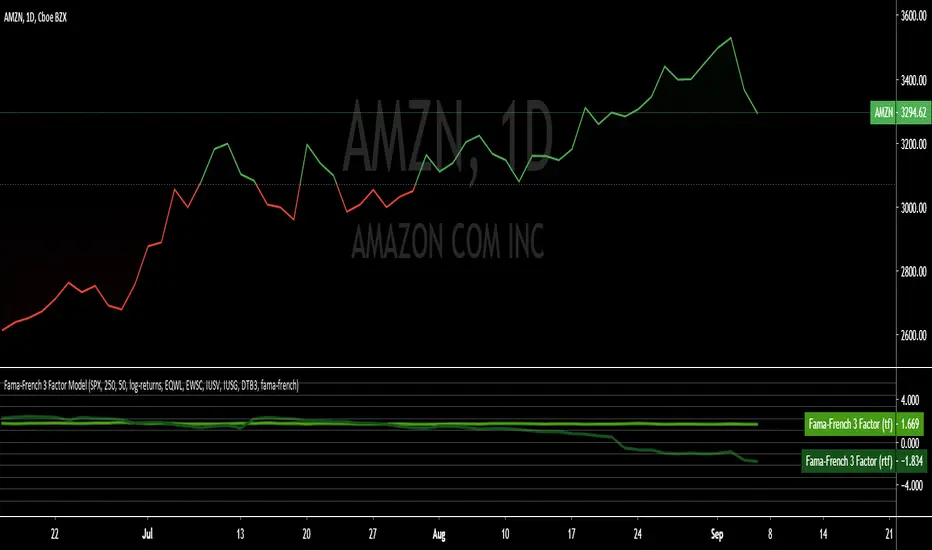
Fama-French 3 Factor ModelFama-French 3 Factor Model
Extension of the Capital Asset Pricing Model (CAPM)
CAPM
Ra = Rfr +
where,
Ra = Return of the Asset
Rfr = Risk-Free Rate
βa = Beta Coefficient of the Asset
Rm - Rfr = Market Risk Premium
Fama-French 3 Factor
r = rf + β1*(rm - rf) + β2(smh) +β3(hml)
r = Expected rate of return
rf = Risk-free rate
ß = Factor’s coefficient (sensitivity)
(rm – rf) = Market risk premium
SMB (Small Minus Big) = Historic excess returns of small-cap companies over large-cap companies
HML (High Minus Low) = Historic excess returns of value stocks (high book-to-price ratio) over growth stocks (low book-to-price ratio)
Small is set to $EWSC
Invesco S&P SmallCap 600® Equal Weight ETF
Big is set to $EQLW
Invesco S&P 100 Equal Weight ETF
High is set to $IUSV
iShares Core S&P US Value ETF
Low is set to $IUSG
iShares Core S&P US Growth ETF
returns selections
'returns'
'logarithmic returns' (use for realized (historical) returns)
'geometric returns' (compounded returns)
risk-free rate selections:
$DTB3
$DGS2
$DGS5
$DGS10
$DGS30
tf = primary time-frame
rtf = reference time-frame
Risk Metrics: Crypto VersionRisk Metrics for Crypto.
Market can be set to BTCUSD, BTCEUR, BTCCHF, BTCGBP, BTC1!, BTC2!, SPX, and DTB3
Beta
Correlation
Standard Deviation
Variance
R-squared

Portfolio: alpha, beta, stdev, variance, mean, max drawdown...Portfolio Metrics **New**
'returns'
'log returns'
'geometric returns'
portfolio alpha
portfolio beta
portfolio,market correlation
portfolio standard deviation
portfolio variance
mean portfolio returns
maximum drawdown
maximum gain

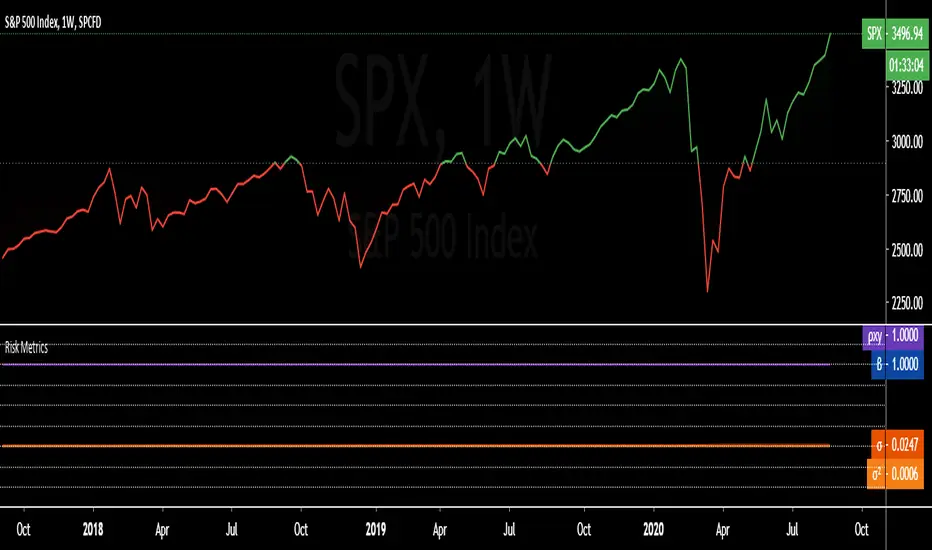
Risk Metrics: beta 'β', correl 'ρxy', stdev 'σ', variance 'σ²'Portfolio Risk Metrics (Part I):
beta 'β'
The beta coefficient can be interpreted as follows:
β =1 exactly as volatile as the market
β >1 more volatile than the market
β <1>0 less volatile than the market
β =0 uncorrelated to the market
β <0 negatively correlated to the market
excerpt from the Corporate Finance Institute
correlation coefficient 'ρxy'
The correlation coefficient is a value that indicates the strength of the relationship between variables.
The coefficient can take any values from -1 to 1. The interpretations of the values are:
-1: Perfect negative correlation. The variables tend to move in opposite directions
(i.e., when one variable increases, the other variable decreases).
0: No correlation. The variables do not have a relationship with each other.
1: Perfect positive correlation. The variables tend to move in the same direction
(i.e., when one variable increases, the other variable also increases).
excerpt from the Corporate Finance Institute
standard deviation 'σ'
68% of returns will fall within 1 standard deviation of the arithmetic mean
95% of returns will fall within 2 standard deviations of the arithmetic mean
99% of returns will fall within 3 standard deviations of the arithmetic mean
excerpt from Corporate Finance Institute
variance 'σ²'
In investing, variance is used to compare the relative performance of each asset in a portfolio.
Because the results can be difficult to analyze, standard deviation is often used instead of variance.
In either case, the goal for the investor is to improve asset allocation.
excerpt from Investopedia
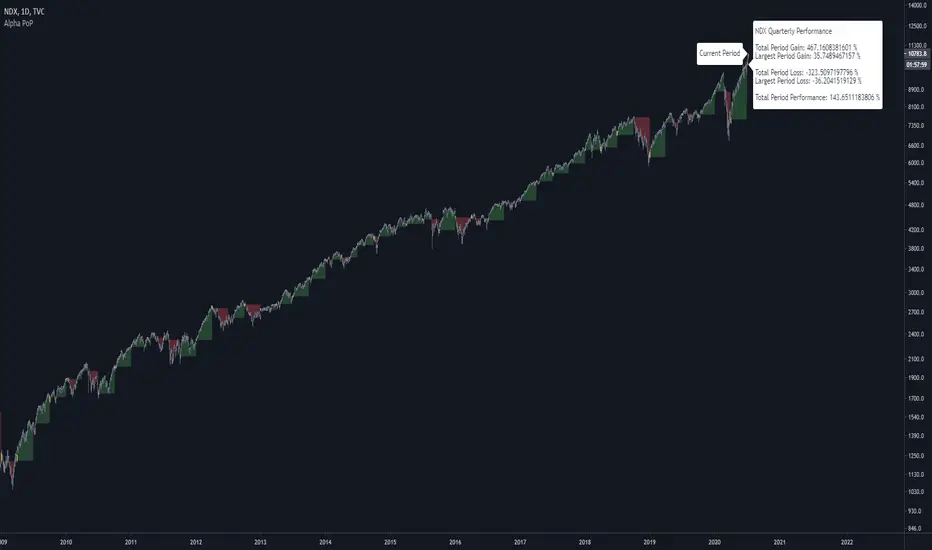
Alpha Performance of PeriodAlpha Performance of Period (PoP) produces a visualization of returns (gains and losses) over a quarterly, monthly, or annual period. It also displays the total % gain and loss over any length of days, months, and years as defined by the user.
Performance of Period (PoP) can be used to understand the performance of an asset over multiple periods using a single chart layout, and to compare the performance of different assets by using a multi-chart layout.
This can, for example, be used to compare the NASDAQ, S&P, and DJI over the past 20 years to create a dow vs. nasdaq vs. s&p performance chart. This can help you understand a comparison of historical returns by showing which performs the best month-over-month, quarter-to-quarter, year-to-year, throughout any custom period of days/months/years.
The ability to get a visualization of the % gain/loss can help to better understand how markets have performed over time and which markets have historically performed the best.
Check out the up and coming Educational Idea we will be releasing soon after this is live to see an example of how we use this tool.
Current Period Label
-----
Current Period : This label shows the current period's performance only when you hover over it.
(This label is located to the left of the current period's open candle and at the current candles close price)
TICKER "Time Period" Performance Label
-----
Total Period Gain : The total of all % gain periods from the start to end date.
Largest Period Gain : The biggest % gain period from the start to end date.
Total Period Loss : The total of all % loss periods from the start to end date.
Largest Period Loss : The biggest % loss period from the start to end date.
Total period Performance : The total % performance, the difference between the total gain and total loss.
NOTE : The "Current Period" performance is excluded from ALL five of the above-mentioned figures. This was done to avoid giving inaccurate comparison figures due to the period not being finished yet.
Inputs
-----
Current Script Version + Info : A drop-down list of instructions for the user to refer to.
Dark Mode Labels : Toggle on for Dark Mode. This is done since Labels text and background color can not be adjusted separately within the visual inputs so this is the best fit solution.
Time Period of Returns : Pick the period of performance you would like to emulate monthly/quarterly/annual.
Start Date : The day to start tracking performance.
Start Month : The month to start tracking performance.
Start Year : The year to start tracking performance.
End Date : The day to stop tracking performance.
End Month : The month to stop tracking performance.
End Year : The year to stop tracking performance.
As always if you have any feedback let us know in the comments and leave a like if you enjoy this tool :)
WaveTrend [LazyBear] vX by DGTDGT interpreted version of LazyBear's WaveTrend, visualizing on Price Chart
Original Author : LazyBear
Crosses above or below threshold are emphasized with bigger labels
- crosses above threshold : probable short indications with a bigger label and relativly small label for probable long indications
- crosses below threshold : probable long indications with a bigger label and relativly small label for probable short indications
All rest crosses within threshold boundaries with relatively small labels for both long and short probable indications

Time Range StatisticsA good amount of users requested a text box showing various price statistics, the following script returns various of these stats in a user-selected range, and include classical ones such as a central tendency measurement (mean), dispersion (normalized range) and percent change, but also include less common statistics such as average traded volume and number of gaps. The script also calculates the correlation between the closing price and another user-selected instrument.
The script is currently the longest one I ever made and took some efforts, as I wasn't satisfied with the statistics to be originally included. Big thx to Gael for the enormous feedback and the idea of the normalized range, to user @Cookiecrush for the feedback ( without ya I would have posted something bad you know umu ? ), and Lulidolce for the support, friendship is magic!
Selected Range
The setting Start determine the bar at which the range starts, while End determine at which bar the range end. To help you select these values, the current bar number (bar index) is displayed at the right of the indicator title in blue.
The setting evaluate to last bar will use a range starting at Start and ending at the last bar, as such you can use a full range by using Start = 0 and select evaluate to last bar
The range is highlighted by an area on the chart. By default Start = 9000 and End = 10000, you might not have this amount of data in your chart, as such use the displayed bar index to select Start and End, then set the settings as default.
Displayed Statistics
The statistics panel is displayed on the right side of the last bar, the panel has 3 sections, a title section who shows the symbol ticker, timeframe, and overall trends represented by a chart emoji, the overall trends are determined by comparing the number of higher highs with the number of lower low.
Below are displayed the date ranges with time format: year/month/day/hour:minute.
The second section shows the general statistics. The first one is the mean, also represented by the orange line in the chart, the blue line displayed represent the highest price value in the range, while the red one represents the lowest price value.
The second stat is the normalized range, and determine how spread is the price in the user-selected range, why not the standard deviation? Because the standard deviation might return results varying widely depending on the scale of the closing price, you could get measures such as 0.0156 or 16 or even 56 depending on the instrument, as such using a normalized range can be more appropriate as it lays in a range of (0,1). Lower values indicate a low degree of price variation. Note that I still want to find another measure in the future.
The percentage change (or relative change) indicates at which percentage the price has increased or decreased, and is calculated by subtracting the closing at bar Start with the price at bar End , divided by the price at bar End , the result is then multiplied by 100.
The average traded volume calculate the mean of the volume in the selected range, I used the same format used by the original volume indicator for clarity.
Finally, the last stats of the section is the number of gaps, this stat is by default hidden. An up gap is detected when the open price is superior to the previous high, while a down gap is detected when the open price is inferior to the previous low, this allow to only retain significant gaps.
The last section of the indicator panel shows the correlation between the closing price and another instrument, by default GOOG, this correlation is also calculated within the user-selected range. Positive values indicate a positive relationship, that is the two instruments tend to move in the same direction. Negative values indicate a negative relationship, both instruments tend to move in a direction opposite to each other. Values closer to 1 or -1 indicate a stronger relationship, while values closer to 0 indicate no relationship.
In Summary
The script shows various stats, each calculated within a user-selected range, in general one would be more interested in how these stats might evolve with time, but checking them in a custom range can be quite interesting.
Thx for reading. umu

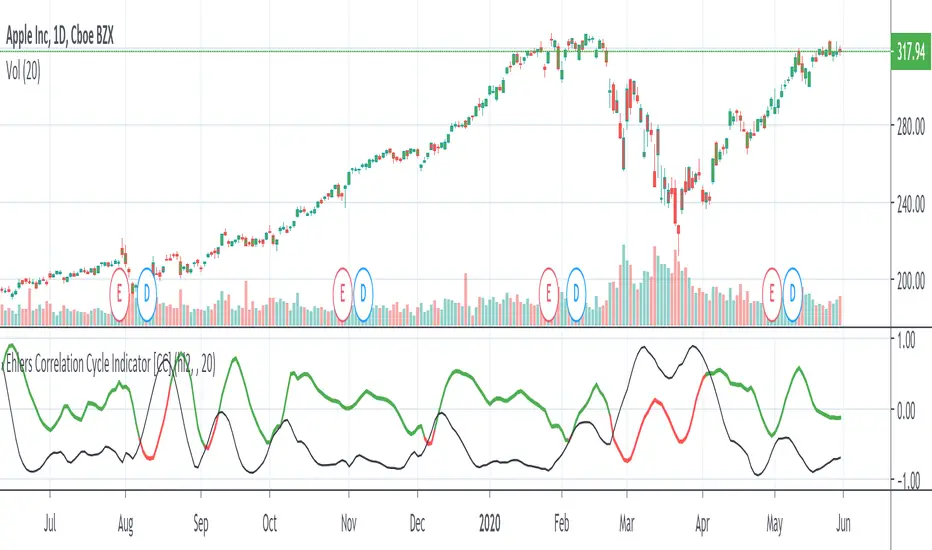
Ehlers Correlation Cycle IndicatorThe Correlation Cycle Indicator was created by John Ehlers (Stocks & Commodities V. 38:06 (8–15)) and this is technically part of three indicators in one so I'm splitting each one to a separate script. This particular indicator was designed for trend direction and trend strength and simply buy when it is green and sell when it turns red. Also keep in mind that the higher the indicator is above the signal then the stronger the trend and when they are close together, conditions get choppy.
Let me know if you would like to see me publish other scripts or if you want something custom done!
Borsa İstanbul Correlation Analysis&Center of Gravity IndicatorFormula Used :
COG = SUM of closing prices Pn x (n+1) / Sum of closing prices Pn

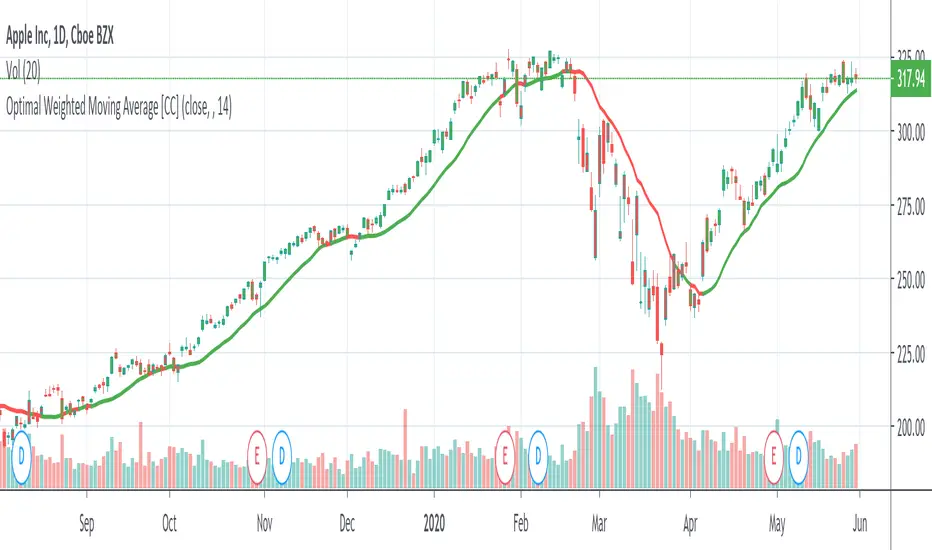
Optimal Weighted Moving AverageThe Optimal Weighted Moving Average was created by Thomas Hutchinson and Peter G. Zhang, Ph.D. (Stocks & Commodities V. 11:12 (500-505)) and it is very similar to a classic weighted moving average but it uses the correlation between the input and the optimal weighted moving average output to use as the weights. Buy when the line turns green and sell when it turns red.
Let me know if you would like to see me publish any other scripts or if you want something custom done!
Correlation Cycle, CorrelationAngle, Market State - John EhlersHot off the press, I present this "Correlation Cycle, CorrelationAngle, and Market State" multicator employing PSv4.0, originally formulated by Dr. John Ehlers for TASC - June 2020 Traders Tips. Basically it's an all-in-one combination of three Ehlers' indicators. This power packed triplet indicator, being less than a 100 line implementation at initial release, is a heavily modified version of the original indicator using novel techniques that surpass John Ehlers' original intended design.
This is also a profound script in numerous ways. First of all, these three indicators are directly from the illustrious mastermind himself Dr. John Ehlers. Secondarily, this is my "50th" script published on TV, which makes it even more significant. I'm especially proud of this script to "degrees" of imagination I once didn't know was theoretically possible in code. My intellect has once again been mathemagically unlocked pondering new innovations with this code revelation. Thirdly, this PSv4.0 script shows the empowering beauty and elegance of hacking the stock markets with TV's ultra utilitarian Pine Editor(PE) in a common browser! Some of you may be wondering if I worked on this for days... nope! This only took a few hours, followed by writing this description for another hour plus.
I have created many of Ehlers' indicators in PE, a few of which I have published in my profile, but I wanted to show how programming with Pine Script can be an artistic form of craftsmanship and poetry. None of this would be possible without the ingeniously minded Tradingview staff revolutionizing algorithmic trading at it's finest. If you should ever encounter them by chance, ponder humbly thanking these computing wizards for their diligence and dedication. They are providing, and shall award to us members, some of the most fascinating conceptualized tech imaginable in the coming future. I can assure you, much, much more is yet to be unveiled for us TV members/enthusiasts. Thank you TV and all you offer to this community.
As always, I have included advanced Pine programming techniques that conform to proper "Pine Etiquette" by example. There are so many Pine mastery techniques included, I don't have an abundance of time to elaborate on all of them. For those of you are code savvy, you may have notice I only used one "for" loop for increased server efficiency, instead of the two "for" loops in the original formulation. For those of you who are newcomers to Pine Script, this code release may also help you comprehend the immense "Power of Pine" by employing advanced programming techniques while exhibiting code utilization in a most effective manner. This is commonly what my dense intricate code looks like behind the veil. If you are wondering why there is hardly any notes, that's because the notation is primarily in the variable naming.
Features List Includes:
Dark Background - Easily disabled in indicator Settings->Style for "Light" charts or with Pine commenting
AND a few more... Why list them, when you have the source code!
The comments section below is solely just for commenting and other remarks, ideas, compliments, etc... regarding only this indicator, not others. When available time provides itself, I will consider your inquiries, thoughts, and concepts presented below in the comments section, should you have any questions or comments regarding this indicator. When my indicators achieve more prevalent use by TV members, I may implement more ideas when they present themselves as worthy additions. As always, "Like" it if you simply just like it with a proper thumbs up, and also return to my scripts list occasionally for additional postings. Have a profitable future everyone!

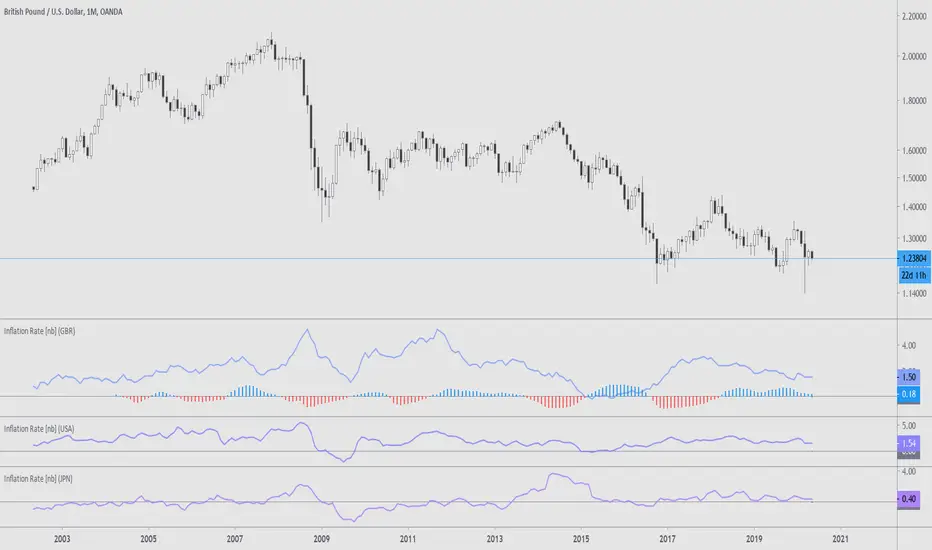
Many Inflation RateThis is a assortment of countries' inflation rates, sourced by Quandl. The countries are represented by their ISO 3166-1 alpha-3 codes in the options, and at the moment include:
ARG, AUS, CAN, CHE, DEU, EUR, FRA, GBR, ITA, JPN, NZL, RUS, USA
Included is a correlation to the current chart and the selected inflation rate. The correlation compares the monthly moving averages of YOY inflation and the chart closes over a period of two years. At the moment this doesn't seem to be the most efficient method of correlation/comparison, should there be one to begin with.
More information:
www.ons.gov.uk
www.bls.gov
voxeu.org
en.wikipedia.org
See here for a different version:
Autocorrelation PlotA tool to plot auto correlation of time series, this is useful in identifying periodicity in a time series or signal.
Due to the limits of Pine Script you'll need to add it multiple times if you want autocorrelation beyond 55 periods. I have added it 4 times here for 220 periods.
For more information on Autocorrelation see: en.wikipedia.org
Note: There are 1 bar gaps every 55 because I wanted the labels to remain every 5, but you don't have to have gaps....

Crypto Market CorrelationThis script utilized some new functions in Pine Script, which compares the correlation between the current symbol to a basket of crypto indexes that are listed on the FTX exchange.
By tracking these indexes we can gauge the reaction across markets that have a different market cap. By that I mean we can have a better idea about where the money is flowing into a specific market.
This script uses data from FTX:BTCPERP, FTX:ALTPERP, FTX:MIDPERP, FTX:SHITPERP, FTX:EXCHPERP, FTX:DRGNPERP.
A value closer to 1 equals to more correlation, closer to 0 equals to less correlation.

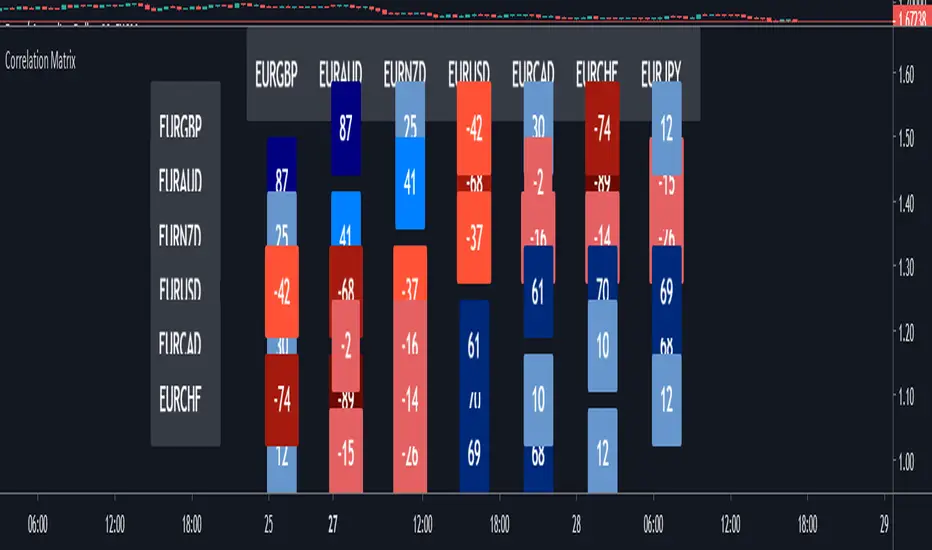
Correlation MatrixIn financial terms, 'correlation' is the numerical measure of the relationship between two variables (in this case, the variables are Forex pairs).
The range of the correlation coefficient is between -1 and +1. A correlation of +1 indicates that two currency pairs will flow in the same direction.
A correlation of -1 indicates that two currency pairs will move in the opposite direction.
Here, I multiplied correlation coefficient by 100 so that it is easier to read. Range between 100 and -100.
Color Coding:-
The darker the color, the higher the correlation positively or negatively.
Extra Light Blue (up to +29) : Weak correlation. Positions on these symbols will tend to move independently.
Light Blue (up to +49) : There may be similarity between positions on these symbols.
Medium Blue (up to +75) : Medium positive correlation.
Navy Blue (up to +100) : Strong positive correlation.
Extra Light Red (up to -30) : Weak correlation. Positions on these symbols will tend to move independently
Light Red (up to -49) : There may be similarity between positions on these symbols.
Dark Red: (up to -75) : Medium negative correlation.
Maroon: (up to -100) : Strong negative correlation.
Correlation Trend Indicator - Dr. John EhlersHot off the press, I present this "Correlation Trend Indicator" employing PSv4.0, originally formulated by Dr . John Ehlers for TASC - May 2020 Traders Tips. John Ehlers might describe it's characteristics as being a mean reverting trend identification oscillator range bound to +/-1.0 irregardless of any timeframe or asset. I could have finessed this indicator with all kinds of bells and whistles, but I wanted to keep it simple and handy enough for novice Pine programmers or Tradingview newcomers to use. This algorithm, in a slightly modified form, is actually a small portion of the base code for John Ehlers' highly complex Autocorrelation Periodogram and his Convolution SwamiChart.
Some members may have notice that I published a very similar script last month. That is correct. It's sole intention was completely different, having more diverse versatility and complexity, but with slightly reduced computational performance. While they seem eerily similar, they are genetically different. This function only has only one required "series" parameter and the correlation is calculated using the period, not bar_index. Correlating with bar_index or period yields identical results either way. Bottom line, this indicator is elegantly simplistic, yet highly utilitarian and easy to use.
Features List Includes:
Dark Background - Easily disabled in indicator Settings->Style for "Light" charts or with Pine commenting
AND a few more... You have the source!
The comments section below is solely just for commenting and other remarks, ideas, compliments, etc... regarding only this indicator, not others. When available time provides itself, I will consider your inquiries, thoughts, and concepts presented below in the comments section, should you have any questions or comments regarding this indicator. When my indicators achieve more prevalent use by TV members, I may implement more ideas when they present themselves as worthy additions. As always, "Like" it if you simply just like it with a proper thumbs up, and also return to my scripts list occasionally for additional postings. Have a profitable future everyone!
