Tertiary Oscillator CloudA centered oscillator, with three distinguishing features:
1) Tertiary logic is used to generate an oscillation signal
2) Multiple oscillation signals are displayed at the same time (a cloud of wavy, translucent bands)
3) A single oscillation signal shows the sum total of the individual oscillations
See the comments at the beginning of the script for a complete description.
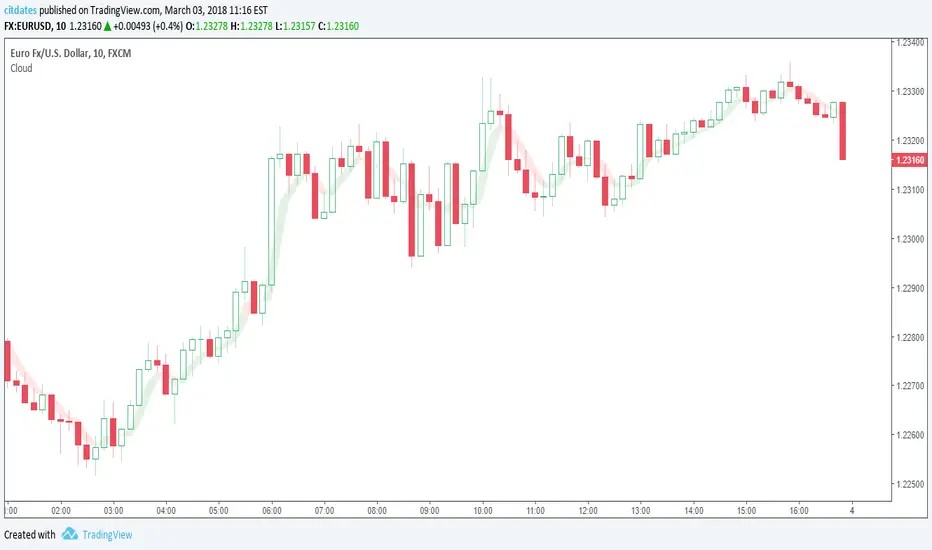
Cloud

Tensor Toolbox Overlay BetaThis purpose of this script is to test new features we might want to implement in Tensor Cloud (See: . Also, to work towards a full, all-in-one indicator solution (Tensor Toolbox). In this first version of Tensor Toolbox Overlay, we propose two new features for Tensor Cloud:
The Veil.
Ichimoku Weight/Smoothing.
The Veil is an RSI filter. The Ichimoku smoothing takes Ichimoku and averages it with Tensor Cloud. The Ichimoku feature will probably not make it into Tensor Cloud but Veil might. Tensor Cloud should remain as pure as possible. It's all up to your feedback. Initial features of Tensor Toolbox Overlay:
Tensor Cloud.
Support & Resistance.
MACD background.
Long & Short potentials.
Tensor Toolbox Overlay needs a lot more features yet to remain elegant. A second edition called Tensor Toolbox Oscillator is coming as well (Can only fit so much on the chart). The goal with both is to have a suite that takes the best of all indicators and provides easy decision making, for those who like to keep control. For Overlay, I also intend to duplicate the functionality of MTPredictor at a fraction of the cost. Feedback appreciated.
Enjoy :)

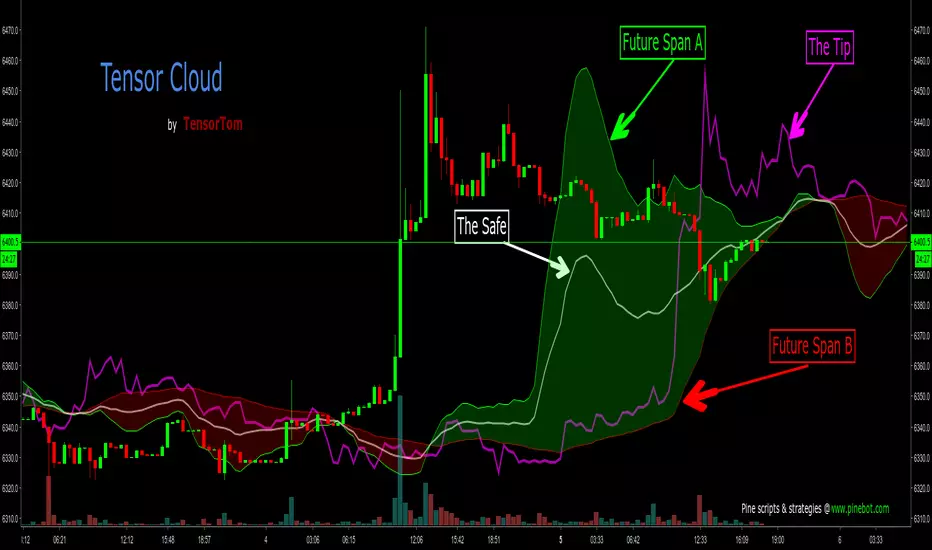
Tensor CloudIntroducing the Tensor Cloud. This is probably the best indicator I've come up with so far. I'm really proud of it. Ichimoku is a brilliant system. It's been around for over half a century and I praise Goichi Hosoda for his brilliant work. However, it's time for something new. I love math and this indicator really showcases that. The Tensor Cloud is an indicator of its own. It is not related to Ichimoku at all. The only thing they have in common is that they both form clouds. The maths in Tensor Cloud are 100% apart.
The Tensor Cloud is mostly comprised of some special forms of linear regression. Let's do a rundown.
Future Span A (Green)
This is one predictor using a linear regression technique. Future Span A is one of the two lines that makes up a Tensor Cloud. From here on out it will traditionally be colored green. It can be used as both a predictor on its own and comprising the Tensor Cloud. This can also be viewed as sort of a long signal when crossing up Future Span B. This line can also be used to help identify levels of support and resistance.
Future Span B (Red)
This is another form of linear regression meant specifically to work alongside Future Span A. This is the second line that comprises a Tensor Cloud. From here on out it will traditionally be colored red. It can be used both as a predictor on its own and comprising the Tensor Cloud. This can also be viewed as sort of a short signal when crossing down through Future Span A. This line can also be used to help identify levels of support and resistance.
Safe (White)
The Safe is a moving average taken of Future Span A and Future Span B. It is highly predictive. From here on out it will traditionally be colored white.
Tip (Fuchsia)
This is yet another form of regression and is highly predictive. The Tip can also be used to help judge trend strength and probability of reversal. More study is of course needed. More on that later in this description. From here on out it will traditionally be colored fuchsia. This line can also be used to help identify levels of support and resistance.
The Tensor Cloud
The space between Future Span A and Future Span B is shaded in green or red, depending on which Future Span is on top. If Future Span A is on top, the Tensor Cloud will be green. This is considered a long signal. If Future Span B is on top, the Tensor Cloud will be colored red. This is a short signal. Attention should also be given to other factors such as:
The position of price in relation to the Tensor Cloud (Under, inside or above).
The position of Tip in relation to the Tensor Cloud.
Crosses of Future Span A and Future Span B.
Tensor Twist
Whenever Future Span A and Future Span B cross (In either direction), this is called a Tensor Twist. If Future Span A is crossing up, this is a long Tensor Twist. If Future Span B is crossing up, this is a short Tensor Twist.
Closing Summary
Much study needs to be done. This is a brand new technique. It's up to all of you to help figure out the best ways to use it. I may still add other components to this indicator but it's pretty solid as is. You will notice that the two integer inputs are set to 27. Twenty-seven is a very important number in mathematics. The details of that are beyond the scope of this description but from here on out, the traditional setting for those will be 27. You will notice that I am not yet releasing the source code to this indicator. For now, it will remain protected. Once I have enough feedback and we're all happy with the final result, I will release the code for the world to have. I have no wish of keeping this closed-source (As profitable as that might be). I just want it to help as many people as possible.
Please share this on social media so we can attract as many testers to give feedback as possible. For publishing this for free, that's all I ask in return. That way it will be as solid as possible when I release the source code.
Enjoy!
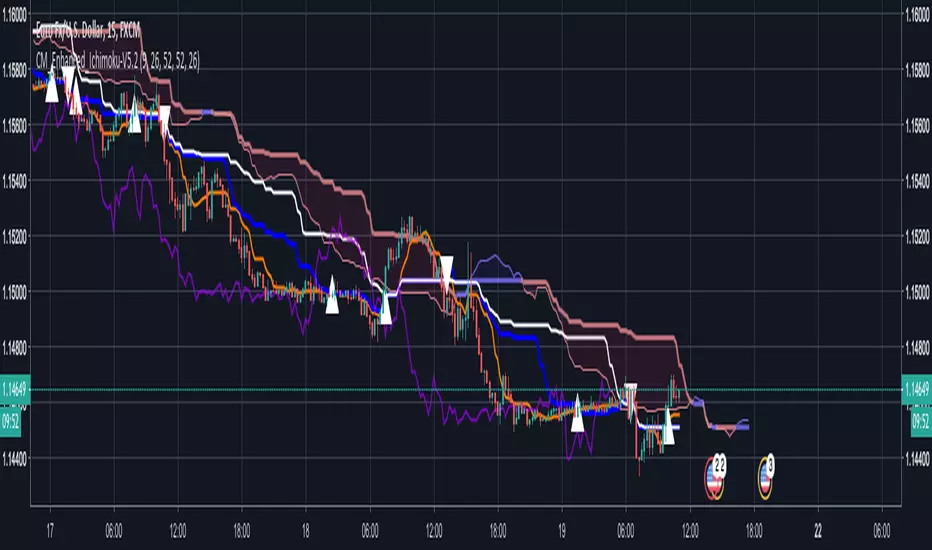
SSABU MTF Ichimoku Cloud✅ MTF Ichimoku Cloud (multi-time frame Ichimoku cloud) is an indicator.
This indicator is a supplementary indicator for viewing the cloud profile of a high-frame burst in a low-frame burst.
If you set the indicator instead of entering the time directly, you can set 1/3/5/13/30/45 minutes 1/2/3 / hour 1 day 1 day in Cloud MTF Set (Minute).
The default setting is 4H.
The screenshot above shows the Ichimoku Cloud with a 4-hour bar on a 15-minute chart.
Clouds of 4 hours seen from 15 minutes of sky blue, cloud of 15 minutes of blue
✅ MTF Ichimoku Cloud (멀티 타임 프레임 이치모쿠 클라우드) 지표입니다.
본 지표는 낮은 프레임의 분봉에서 높은 프레임의 분봉의 구름대 모습을 볼 수 있는 보조지표 입니다.
직접 시간을 입력 하는 건 아니고 지표를 설치하시면 Cloud MTF Set(Minute)에서 1/3/5/13/30/45분 1/2/3/시간 1일 1주로 설정이 가능합니다.
기본설정은 4H으로 되어있습니다.
위의 스크린샷은 15분봉의 차트에서 4시간봉의 Ichimoku Cloud를 적용한 모습입니다.
하늘색이 15분봉에서 보는 4시간봉의 구름, 파란색이 15분봉에 해당하는 구름
✅ Other indicators to help you trade
✅ 매매에 도움되는 다른 보조지표
Basel major 2.2

Hull Moving Average Cloud v2Hull Moving Average Cloud, is not the normal Hull crossover, instead opens orders at cross of price and alternative Hull MA configuration (stretches/shrinks with momentum)
Has history settings, Commission already included in result. Only looks into past, should be no repaint (im sure the trolls will correct me if im wrong, thankyou trolls i can always count on you)
Source code open, if you find improvement please share thankyou

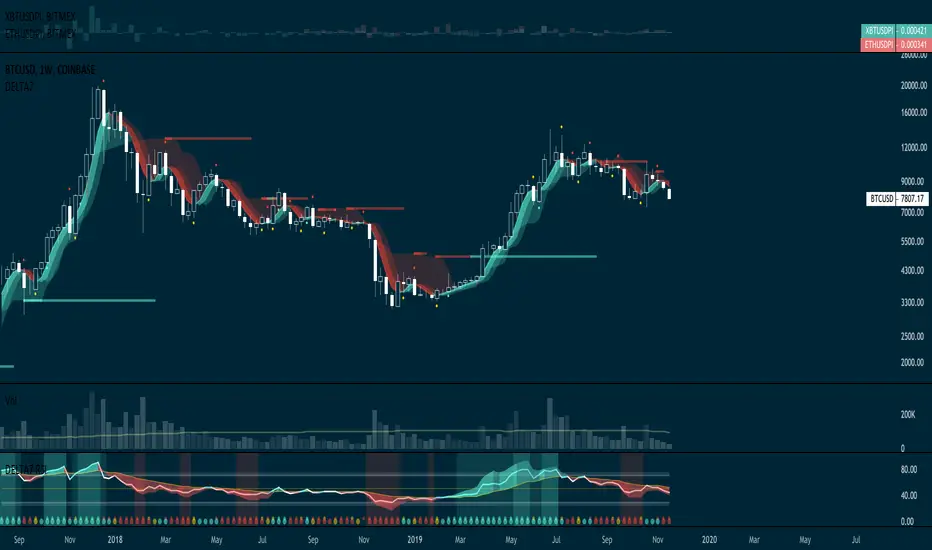
RSI 𝝙 MapRSI 𝝙 Map is a on-chart application of signals produced by the original RSI 𝝙 Indicator.
RSI 𝝙 is a full study system of several RSI analysis that can be used on different timeframes and adapt strategy to trending markets or trading ranges.
Default Settings:
RSI: 13
Linear Regression of RSI: 34
Signal RSI: 5
Long RSI: 55
RSI 𝝙 Histogram: Delta between RSI and Long RSI based on Signal RSI_Length.
Activate Vertical Bar Highlights and/or Signal Candle Flags for:
- RSI Oversold/Overbought. (Default: Highlight Bar)
- Signal RSI Oversold/Overbought. (Default: Highlight Bar)
- RSI crossing its Linear Regression . (Default: Signal Candle Flag)
- RSI crossing its Long RSI . (Default: Off)
- Signal RSI crossing its RSI . (Default: Off)
- Signal RSI crossing its Long RSI . (Default: Off)
- RSI 𝝙 Histogram crossing baseline. (Default: Off)
Users can also do extra tuning in Style Section of Format options.
The market behaves differently when the pacing changes, volatility changes and when it trends or when it ranges. Develop an understanding of it with the help of this study.
Avoid risking more than 1% per trade. Be responsible for always making a priority about protecting capital and risk management. Develop emotional control and use this RSI study to develop a more complete trading system without any need for extra indicators other than Price and Volume .
👆active signals:
RSI Overbought/Oversold
Signal RSI Overbought/Oversold
RSI crossing Linear Regression
👆active signals:
RSI Overbought/Oversold
Signal RSI Overbought/Oversold
Signal RSI crossing RSI
Signal RSI crossing Long RSI
👆active signals:
RSI Overbought/Oversold
Signal RSI Overbought/Oversold
RSI crossing Linear Regression
RSI crossing Long RSI
Signal RSI crossing RSI
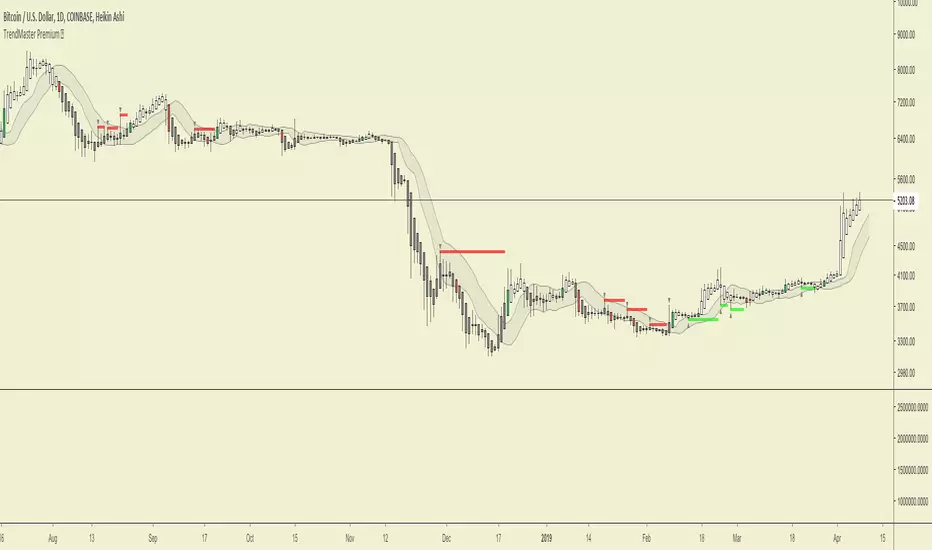
TrendMaster Premium ©Trendmaster Premium©
We are proud to release the final version of Trendmaster Premium©. This indicator is the result of months of development between @TrendmasterTM and @Crypto_C00kie.
Trendmaster Premium© is a Trend following system that provide entries, exits and stop loss placement. It is extremely simple to follow and we have experienced outstanding results.
When purchasing Trendmaster Premium© you will receive access to the indicator suite and access to our private members discord group.
Discord: The discord channel is a place where traders can discuss ideas and share content.
It includes
Bots – The discord channel currently has two bots that constantly scan Binance for signals. They will alert you by notification of any BTC pair that has printed a signal candle. Currently the bots report D1 and H4 signals as these are the time frames the indicator is designed for. These are designed to alert you to possible trades and should NOT be blindly traded from.
Chat – Several chat servers offering educational resources, guidance on how to use the indicator and chart/idea sharing.
The mandatory Legal bit:
@IchimokuScholar and @Crypto_C00kie wish you the best of luck in achieving your trading goals. Please apply appropriate risk management.
Any form of trading has large potential rewards but also large potential risks. The Purchaser must be aware of those risks and be willing to accept them. Don't trade with money that you, the Purchaser cannot afford to lose. No representation is being made that you are guaranteed positive results. The past performance of any trading methodology is not necessarily indicative of future results. Trading involves high risks. Neither @TrendmasterTM or @Crypto_C00kie are responsible for any trades that you, the Purchaser take. All trades taken are entirely at the Purchasers own risk. Refunds are neither offered nor implied.
ripple cloudsripple cloud is another trend indicator which shows the both trend and range of volatility

Moving average cloud strategyHi folks!
Here a script uses the moving average cloud. A sma (50, aqua) and a sma (200, olive) are plotted on the cart. When both sma go up the cloud is green. When both sma go down the cloud is red. When sma (200, olive) goes down and sma (50, aqua) goes up the cloud is orange. When sma (200, olive) goes up and sma (50, aqua) goes down the cloud is lime.
There three entry points in this strategy.
Long
Aggressive: When the cloud turns orange and price closes above the sma (200).
Neutral: When the both sma make the golden cross.
Cautious: When the cloud is green and price closes sma (200) after searching for support. So not when there's a great distance between them.
In case you missed the entry point you can jump in when price CLOSES above sma (50). So after it searched for support on that line. The cloud has to be green at that moment.
Short
Aggressive: When the cloud turns lime and price CLOSES below the sma (200).
Neutral: When the both sma make the death cross.
Cautious: When the cloud is green and price is above the sma (200).
In case you missed the entry point you can jump in when price CLOSES above sma (50). So after it searched for support on that line.
There are also two exit points in this strategy.
Cautious: When price closes on the other side of the sma (50).
Neutral: When the cloud changes color.
Aggressive: When price closes on the other side of the sma (200). There's always the opportunity that the price searches for support at the sma (200) line and goes from that moment in the direction you want.
Don't wait for the cross of the both sma. Very usually you give a huge part of your profit away at that point.
Remember: Above the cloud is bullish area, never go short there. Below the cloud is bearish area, never go long there.
Remember 2: When the clouds changes rapidly from color we're not in a trend. The sma (200) will be almost flat at those situations. It's a sign not to go into a trade since the market doesn't know in which direction it will go.

Moving cloud avarage Two simple moving avarages are plotted. With a green color when bullish and red when bearish. Periods are 100 and 200, but very easy to change in the pine editor.

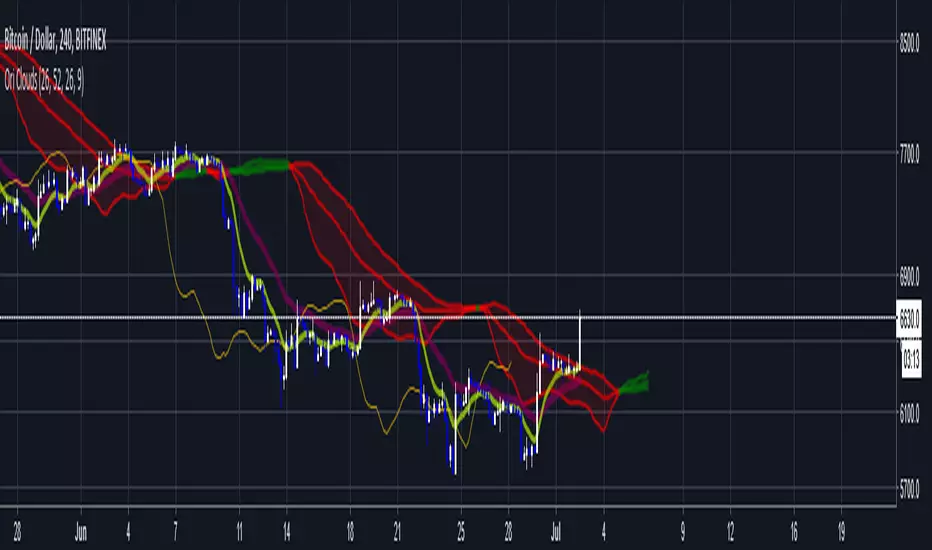
Ori Clouds (Better Ichimoku)Logic is similar to ichimoku . Last cloud color is also important for trend confirmation. Cloud lines important. There is a 3 line cloud which is different from ichimoku .
Logic is same but all calculations are different from ichimoku so be careful this is not the same indicator.
Here is classic Ichimoku for comparison
Linear Regression Cloud [R1984]TradingView Pine script to compare fast vs slow linear regression lines measured in days.
This indicator compares fast and slow linear regression lines, and that's it!
The fast line crossing above the slow line is generally bullish. The fast line crossing below the slow line is generally bearish. The lines and the space between them tend to act as resistance and support relative to the price movement against them.
30 days as the fast line and 60 days as the slow line appear to work well for BTC/USD. Check out multiples of that too: 15/30, 45/90, and 60/120.
Source code available here: github.com

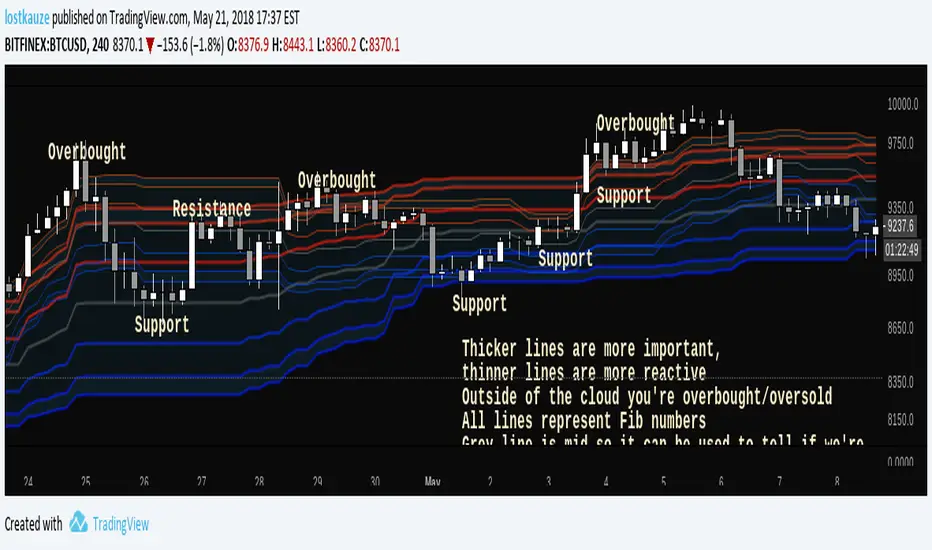
Fibonacci CloudInspired by Ichimoku Fibonacci Hybrid , this indicator is for those who don't mind a lot of lines. All lines represent Fib ratios: thicker lines are fibs for a longer period, while thinner lines are fibs for a shorter period.
- Dynamic S/R
- Overbought/Oversold zones
- Trend indicator
- Customisable periods
- Fast/Slow crossovers
See what works for you!
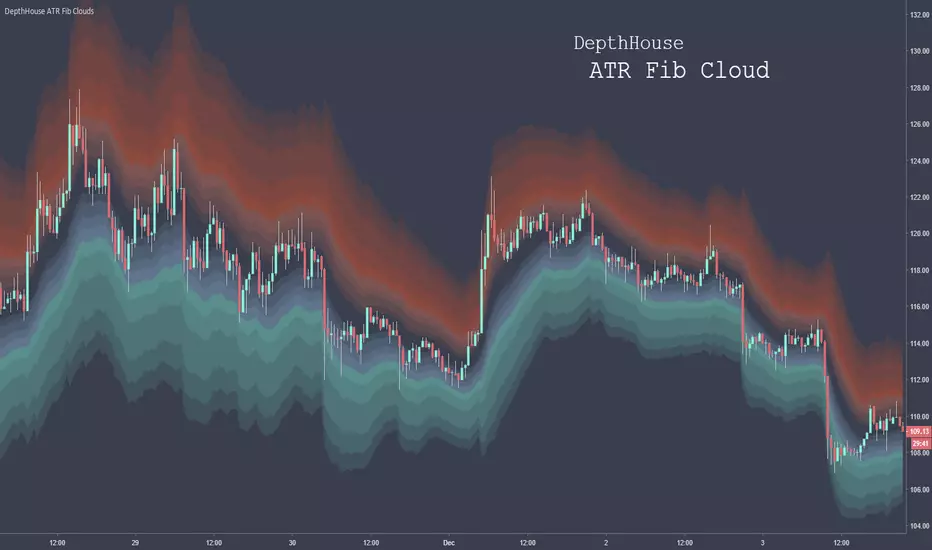
DepthHouse - ATR Fib CloudsDepth House ATR Fib Clouds is used to help traders spot dynamic support, resistance, retracement zones, and over-extensions.
Here is a video which I give a brief overview and show it in action:
youtu.be
Based on the zoning colors above:
Red and Blue zones represent common retracement zones.
Green and Orange zones represent possible over-extension zones, and trend changes.
This tool can also help differentiate between bull and bear markets on larger time frames. Trending markets tend to stick within the bottom or top of the loud zones.
Please Note: There are NOT trading signals. Each colored candle represents nothing other than a possibility of which way the trend may go. Be sure to use your own adequate analysis. Use at your own financial risk.
How to get:
As you can see this is an invite only script. In the coming months this indicator, along with many others will become pay to use only. (website on my profile page)
However all my indicators will be FREE until May 1, 2018. So please try them out!
To take advantage of this FREE trial :
1. Subscribe to my YouTube channel. I have many more videos to come! Maybe even leave a comment of what you would like to see next!
2. Comment on this indicator post! Maybe even give me a follow :D
I hope you all enjoy!!
Indicator website: depthhouse.com
My Ichimoku indicator & Strategyhello I'm a beginner in trading, but I try to learn how to code strategies.
I recoded the Ichimoku indicator, and created my personnal strategy based on it.
The backtesting is done from 1/1/2017 to today in 45 min Time Unit for candles, with a 1 000 € equity.
The trades are all Long Entries and Exits with no pyramiding, no short trades at all.
/!\ Exchanges commission fees are not calculated and can in reality easily divide by 2 the total profit (am I right guys?) /!\
A buy signal is triggered upon these conditions:
- close is above the Kuma (cloud)
AND
- close crosses over Kijunsen AND Kijunsen is not flat (calculated with rising and falling with input "Kijunsen Lag")
OR
- Close crosses over ChikouSpan AND there was a sell signal in the last 8 candles
Sell signal is the same but reversed.
I appreciate your feedback ! Maybe I will update this later if I get better results.

Ichimoku Cloud (Log-Space) - perfect trend areaLog space ichimoku cloud which display perfect bearish trend and perfect bullish trend.

Crypto IchimokuIchimoku Cloud with settings recommended for crypto by trader IAmSatoshi. Includes a handy checkbox to double inputs, and alerts that can be set for when the price crosses the bottom or top of the cloud.
This script also includes an ichimoku signal count. The signal count is an UNWEIGHTED sum of positive or negative ichimoku signals with the greatest total being shown in either green(long>short) or red(short>long) or white(0, long==short). The signal count is only shown when their is a new signal or a signal is no longer valid.
If you use a major portion of the code please cite me. If you like the script and make a bunch of money using it, feel free to donate using the crypto addresses below.
BTC: 34uVepgjGJAKqf9i3mfdq8AG1dzTthjCgb
ETH: 0x71B15Beb6AF985853B5fC80205ddb3595C51B63e
LTC: MVzvSu53K5qPfjiQn4nk9D6WVLJKCMzXHJ
DASH: XoKVDBnhiyPvJeyRdpHjcWu1WtVjCbhP68
XMR: 46jnYGp7v5vCSAV8pzGXPbWM7YFiZNB4eaFCHsezitQ46KM1E6FgPM9ZaYJEfDVk5zdKoPQ7vw27ke34jMxERogvJDQhfQW

Bryan - Multi IndicatorCustom Indicator - Developed for a Backtest-Rookies customer and published for testing and acceptance.
Ichimoku + ADX combined indicator with custom entry criteria and plotting for buy signals.

Stratus [DW]This is an experimental study designed to identify trend activity, and potential support and resistance areas.
First, Coefficient of Variation Weighted Moving Average (COVWMA) is calculated, and its intersection points are used as anchor values.
Next, a fast period COVWMA calculated for a signal line.
For the cloud, its mid level is calculated first by taking the median of the range between price and the last anchor value.
The upper and lower cloud values are calculated by slicing the range in half two more times on each side. The result looks similar to stratus clouds, hence the name.
Finally, the result is offset by half of the specified period.
Custom bar colors are included.

Supertrend CloudSupertrend is a simple yet great indicator which is based hard data, especially when combined with an additional ST line which has its multiplication doubled.
Enjoy :)
