Pivot Trend LevelsYou can use this indicator to detect the levels and trend.
I used the highest of the two last highest pivots and the lowest of the two last lowest pivots to calculate "max" and "min" or high level or low level.
I also calculate the average of the 4 values to reach the average line which could be a trend detector in higher lengths.
Default length is 3 but using 10 or 20 as length is really good as trending detector.
I need help to upgrade a trend detector system. please read the script for more information.
Thank you so much.
Padrões Gráficos

Volatility ChannelThis script is based on an idea I have had for bands that react better to crypto volatility. It calculates a Donchian Channel, SMMA-Smoothed True Range, Bollinger Bands (standard deviation), and a Keltner Channel (average true range) and averages the components to construct its bands/envelopes. This way, hopefully band touches are a more reliable indicator of a temporary bottom, and so on. Secondary coloring for strength of trend is given as a gradient based on RSI.

[_ParkF]RSI (+ichimoku cloud)RSI
Typical RSI indicators were plotted with candles and expressed wick to resemble a candle chart,
and linear regression was added to predict changes in force intensity,
which allowed us to confirm support and resistance within linear regression .
In addition, divergence signal was marked as an additional basis for the price fluctuation point due to support and resistance .
In other words,
if the diversity signal appears together when the rsi candle is supported and resisted within linear regression ,
this is the basis for predicting that it is a point of change in the existing trend.
Finally, the period value and standard deviation of linear regression can be arbitrarily modified and used.
I hope it will help you with your trading.
--------------------------------------------------------------------------------------------------------------------------------------------------------------
(+ichimoku cloud)
Clouds made of the preceding span 1 and the preceding span 2 of the balance table can predict the trend by displaying the current price balance ahead of the future.
In addition to the role of clouds in the above-described balance sheet, this indicator also shows the cloud band support and resistance of the current RSI value.
일반적인 RSI 지표를 캔들화 하였고 꼬리까지 포함하여 캔들 차트와 유사하게 표현 하고,
캔들화한 RSI 지표에 선형회귀(채널)를 추가 하여 RSI 지표 특유의 힘의 강도의 변화를 지지와 저항으로 확인할 수 있게 해봤습니다.
또한 다이버전스 신호를 추가하여 선형회귀(채널)로 인한 지지와 저항에 따른 가격 변동의 근거로 삼을 수 있습니다.
즉, 선형회귀(채널) 안에서 RSI 캔들이 지지와 저항을 받을 때 다이버전스 신호가 함께 나타난다면 이는 기존 추세의 변화 지점임을
예측해 볼 수 있는 근거가 됩니다.
마지막으로 선형회귀(채널)의 기간값과 표준편차는 임의로 수정하여 사용할 수 있습니다.
당신의 트레이딩에 도움이 되었으면 합니다.
--------------------------------------------------------------------------------------------------------------------------------------------------------------
(+일목균형표의 구름)
일목균형표의 선행스팬1과 선행스팬2로 만들어진 구름은 현재 가격의 균형을 미래에 선행하여 표시하여 추세를 예측해볼 수 있습니다.
본 지표에서는 위에서 설명한 일목균형표의 구름의 역할과 더불어 현 RSI 값의 구름대 지지, 저항 또한 확인해볼 수 있습니다.
* I would like to express my gratitude to zdmre for revealing the linear regression source.

BBands ChannelsBased on the Bollinger Bands system. This shows outer channels to the bollinger bands .

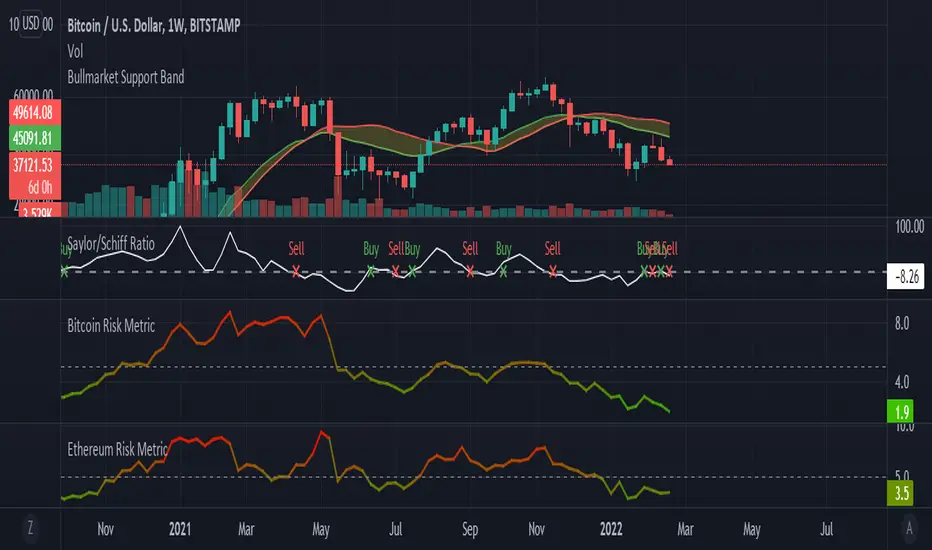
Saylor to Schiff RatioI'm reposting the Saylor to Schiff Ratio indicator that was originally developed by Michael Silva
This indicator may be used to predict key momentum shifts in the price of Bitcoin
I've set up this indicator for it to be used on the weekly timeframe as was intended.
The indicator plots in any BTCUSD spot, futures , BLX index and BTCEUR .
It paints in all time frames, but Weekly time frame is the correct one to interpret the 'official' read of it.
For that reason, I've enabled by default an option that forces the indicator to display on the Weekly value even though the time frame could be higher or lower.
Credit for this idea goes to Michael Silva: @mikepsilva
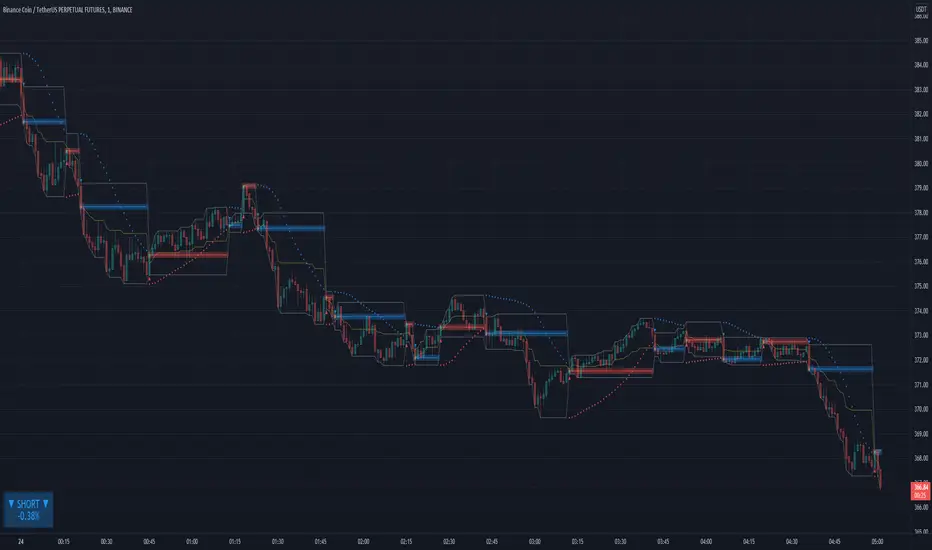
[DA]SAR HILODescription of the indicator:
The SAR indicator will indicate a trend change on the chart:
LONG: Red up arrow + GOLONG alert + red horizontal line
SHORT: Blue down arrow + GOSHORT alert + blue horizontal line
A HILO trend channel is also formed, which is reset when the trend changes.
The HILO channel will help you see the price movement in the channel.
Trend change alerts will only work at the close of the current bar.
For GOLONG/GOSHORT alerts to work, you need to select in the Tradingview menu:
Alerts => Indicator Name => Condition => Any call to the alert() function (Any alert() function call)
Price and trend direction in the table:
LONG + Red: The price is trending LONG
LONG + Yellow: The price is moving against the LONG trend
SHORT + Blue color: The price is moving along the SHORT trend
SHORT + Yellow: The price is moving against the SHORT trend
▲▼ Arrows: Rising/Falling bar
% Percentage taken from blue/red levels
I will be glad to receive your feedback on the indicator operation.
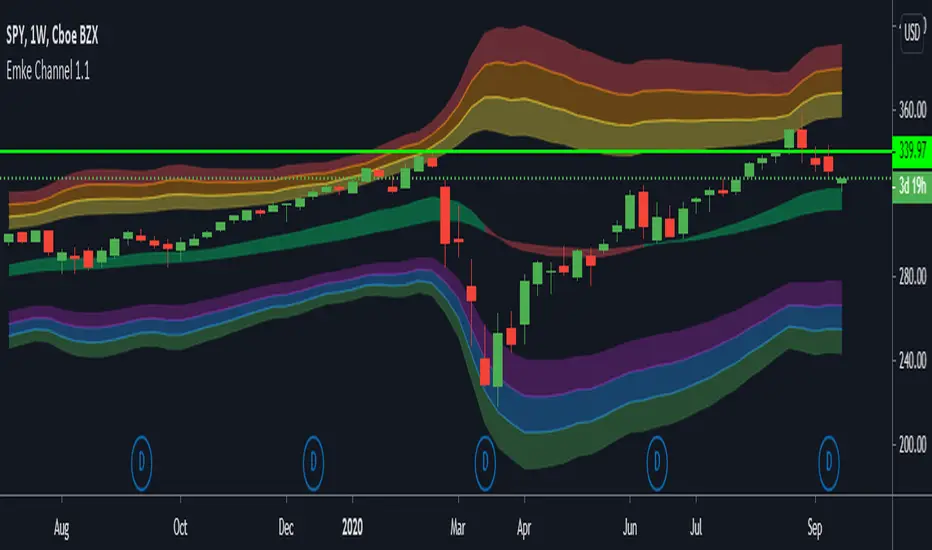
[TTI] ATR channelsHISTORY AND CREDITS
Used by John Carter in his indicator’s toolbox. The ATR channels or the Keltner Channels represent the railroads or the natural movement of stocks.
WHAT IT DOES
Movements between the the The first multiplier lines (white) represent standard movement for the timeframe you are trading. Movements between the second multiplier (green/red lines) represent a 2stdv move of the stock in a single direction. Once a stock starts reaching the 3rd multiplier lines there’s an exponential chance that it will revert to the mean (cyan line)
Additionally, we have added the Institutional lines. These are thought in a Small Account Mastery class 2019 by John Carter, as the levels heavily watched by institutions. The default settings represent what John is teaching but they can be further customised.
HOW TO USE IT
ATRs channels or Keltner Channels can be great source for target or stop losses and can be used as a indicator for confluence with other technical tools like the Fibonacci lines.

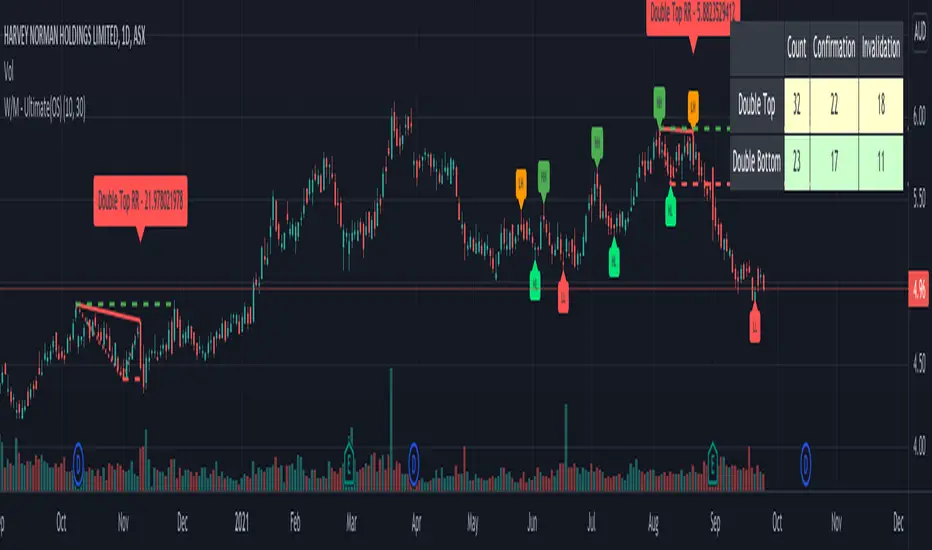
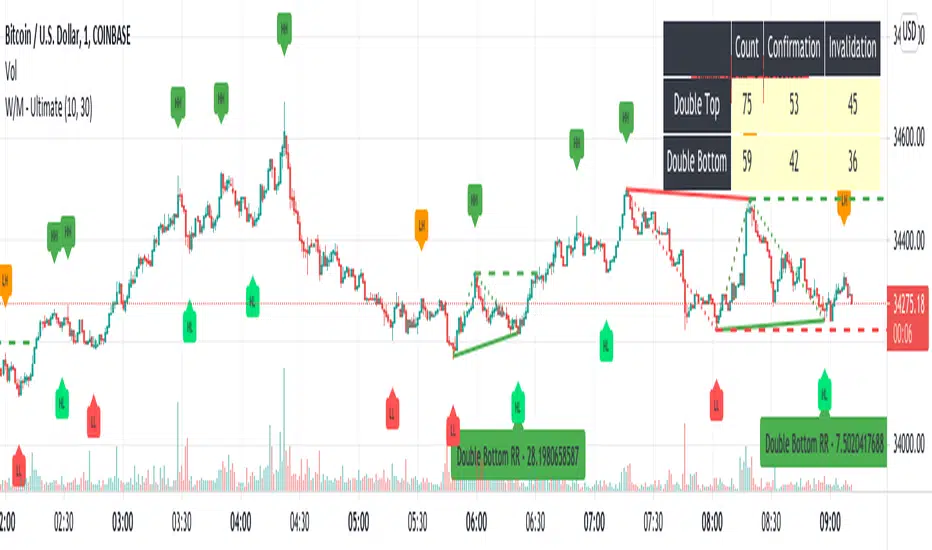
Double Top/Bottom - Ultimate (OS)This is zigzag based double top/bottom indicator. Code is same as : Double-Top-Bottom-Ultimate
But, republishing it to make it available open source.
Double Top:
Recognition - Checks on Zigzag if LH is followed by HH
Confirmation - When low crosses under last lower pivot point on zigzag
Invalidation - When high crosses over HH
Double Bottom:
Recognition - Checks on Zigzag if HL is followed by LL
Confirmation - When high crosses over last higher pivot point on zigzag
Invalidation - When low crosses under LL
Few input options:
Option to display risk per reward which defines how steep is the W-M triangle. This is simply the ratio of price difference between mid point to top most and bottom most points. In case of double top , downside is considered as reward and upside is considered as risk and with double bottom , downside is considered as risk and upside is considered as reward. Lower risk per reward signifies better trade.
Option to display stats which shows number of occurances of double top and bottom and how many times price crossed confirmation point and invalidation point (which are also marked with dashed lines) Stats are color coded. Higher confirmation rates are colored in shades of green, lower confirmation rates are colored in shades of orange whereas the neutral confirmation rates are coloed in light yellow.
Auto Harmonic Patterns - Open SourceI may not be able to spend much time on the harmonic patterns and realized that there are not much open source scripts on them either. Hence, decided to release open source version which can be used by other developers for reference and build things on top of it.
Original script is protected and can be found here:
Logical ratios of patterns are coded as below:
Notations:
Lines XABCD forms the pattern in all cases. (OXABCD in case of Three drives )
abc = BC retacement of AB, xab = AB retracement of XA and so on
ABCD Classic
0.618 <= abc <= 0.786
1.272 <= bcd <= 1.618
AB=CD
Price difference between AB and CD are equal
Time difference between AB and CD are equal
ABCD Extension
0.618 <= abc <= 0.786
1.272 <= AD/ BC (price) <= 1.618
Gartley
xab = 0.618
0.382 <= abc <= 0.886
1.272 <= bcd <= 1.618 OR xad = 0.786
Crab
0.382 <= xab <= 0.618
0.382 <= abc <= 0.886
2.24 <= bcd <= 3.618 OR xad = 1.618
Deep Crab
xab = 0.886
0.382 <= abc <= 0.886
2.0 <= bcd <= 3.618 OR xad = 1.618
Bat
0.382 <= xab <= 0.50
0.382 <= abc <= 0.886
1.618 <= bcd <= 2.618 OR xad = 0.886
Butterfly
xab = 0.786
0.382 <= abc <= 0.886
1.618 <= bcd <= 2.618 OR 1.272 <= xad <= 2.618
Shark
xab = 0.786
1.13 <= abc <= 1.618
1.618 <= bcd <= 2.24 OR 0.886 <= xad <= 1.13
Cypher
0.382 <= xab <= 0.618
1.13 <= abc <= 1.414
1.272 <= bcd <= 2.0 OR xad = 0.786
Three Drives
oxa = 0.618
1.27 <= xab <= 1.618
abc = 0.618
1.27 <= bcd <= 1.618
5-0
1.13 <= xab <= 1.618
1.618 <= abc <= 2.24
bcd = 0.5
This script contains everything which original script has apart from stats. Use the original script if you are not developer looking for code reference and prefer having stats table.
I have also developed a strategy based on harmonic patterns which can be found here:

Double Top/Bottom - UltimateHellow traders, this is my final script regarding double top/bottom pattern recognition. This script is built based on zig zag indicator whereas the previous ones are built based on pivot points.
Double Top:
Recognition - Checks on Zigzag if LH is followed by HH
Confirmation - When low crosses under last lower pivot point on zigzag
Invalidation - When high crosses over HH
Double Bottom:
Recognition - Checks on Zigzag if HL is followed by LL
Confirmation - When high crosses over last higher pivot point on zigzag
Invalidation - When low crosses under LL
Few major changes in this version compared to previous ones:
Zigzag offers more simplicity in deriving the pattern and also enahnces accuracy. Things such as pivot distance, absolute peaks are removed as they are redundant.
Option to display risk per reward which defines how steep is the W-M triangle. This is simply the ratio of price difference between mid point to top most and bottom most points. In case of double top, downside is considered as reward and upside is considered as risk and with double bottom, downside is considered as risk and upside is considered as reward. Lower risk per reward signifies better trade.
Option to display stats which shows number of occurances of double top and bottom and how many times price crossed confirmation point and invalidation point (which are also marked with dashed lines) Stats are color coded. Higher success rates are colored in shades of green, lower success rates are colored in shades of orange whereas the neutral success rates are coloed in light yellow.
Example of stat shown in Neutral shade. I could not find any instrument which had confirmation rate less than 0.4 - which suggests confirmation rate for the patter is pretty strong:
Links for the other two scripts are here:
Double Top/Bottom V2This is an enhanced version of Double Top/Bottom detector.
Initial basic version can be found here:
Concept of deriving pattern is similar but there are few major changes.
Double Top:
Get the highest pivot high from last X pivot highs ( DTHigh1 )
Look for next top most pivot high which happened after DTHigh1 ( DTHigh2 )
Look for lowest pivot low between DTHigh1 and DTHigh2 ( DTLow )
Double Bottom:
Get the lowest pivot low from last X pivot lows ( DBLow1 )
Look for next lowest pivot low which happened after DBLow1 ( DBLow2 )
Look for highest pivot high between DBLow1 and DBLow2 ( DbHigh )
Other Key parameters:
checkForAbsolutePeaks and absolutePeakLoopback work together. When selected, double top and double bottom is formed only if DTHigh1 / DBLow1 are highest/lowest points from last absolutePeakLoopback bars back.
considerPivotDistance will make sure distance between Highs(in double top) and lows(in double bottom) are below 2 ( MaxAtrDistanceBase ) times ATR. And distance between average Highs/Lows to Low/High forming triangle is less than 6 ( MaxAtrDistanceHighLow ) times ATR. This will avoid showing steep triangles as double top/bottoms.
showLastLevels option allows users to display dashed lines on double top/bottom confirmation and invalidation levels for last formed double bottom and tops. These can be treated as strong support and resistence. Dashed lines are permanently formed on double top/bottom setups when an invalidation or confirmation occurs by price crossing either lowest or highest points of double top/bottom triangles.
Alerts:
Probable double top/bottom - when double top or bottom triangles formed.
Double top/bottom confirmation - when double top or bottom is confirmed.
Double top/bottom invalidation - when double top or bottom is invalidated.
Few important points about adjusting parameters:
Lower pivot lengths will generate more signals. But, too frequent signals may not be desirable as well.
higher absolutePeakLoopback will reduce number of signals while strengthening them.
Unchecking consider pivot distance or reducing MaxAtrDistanceBase/MaxAtrDistanceHighLow may considerably increase the number of pivots specially when pivot lengths are lower side. This may result in reduced quality of signals as well.
Moving average condition which is part of basic script is not included in this. We can add Hull Suite or moving average crossover on the chart as confirmation of strong signal.

Double Top/BottomHere is an attempt to identify double top/bottom based on pivot high/lows.
Logic is simple.
Double Bottom:
Last two pivot High Lows make W shape
Last Pivot Low is higher than previous Last Pivot Low.
Last Pivot High is lower than previous last Pivot High.
Price has not gone below Last Pivot Low
Price breaks out of last Pivot High to complete W shape
Double Top:
Last two pivot High Lows make M shape
Last Pivot Low is higher than previous Last Pivot Low.
Last Pivot High is lower than previous last Pivot High.
Price has not gone above Last Pivot High
Price breaks out of last Pivot Low to complete M shape
Prameters:
Parameters PvtLenL , PvtLenR and waitforclose determines pivot points.
FilterPivots clears repetitive pivots formed in same direction before calculating the possible double top/bottom.
For example:
CheckForAbsolutePeaks and AbsolutePeakLoopback works together. When CheckForAbsolutePeaks is enabled, script only generates double bottom or top signal if previous last pivot is absolute high or low for AbsolutePeakLoopback periods.
ConsiderMovingAverage does two things. First, it makes sure that fast moving average and slow moving averages are aligned with the direction we are going to forecast. Second, it makes sure that the crossover happend recently and with last BarCrossoverLimit bars. For example, to call it double bottom, Fast MA should be higher than Slow MA and crossover of FastMA above SlowMA should have happened in last 10 bars (BarCrossoverLimit)
PivotDisplayMode can be Actual, Filtered or None. Actual will display all pivot high low generated. Filtered will only display last 5 pivot high and pivot lows which are filtered . That means, it will remove the repetitive pivots formed without making pivots on the other side.
Welcome and suggestions and feedbacks.

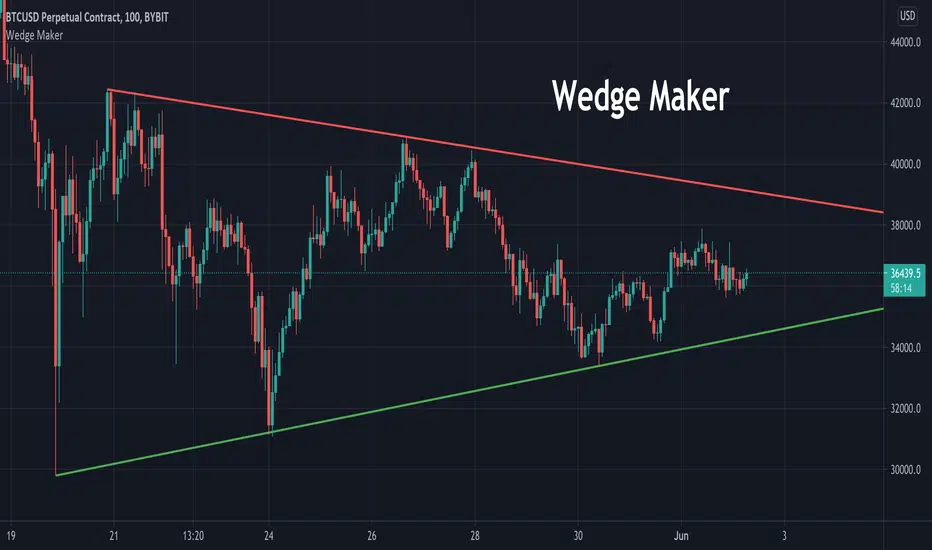
Wedge MakerThis tool is used to draw wedges. Traders can choose which pivot points to draw lines from in settings. Wedge Maker does not automatically detect current wedge and is required to be tweaked in settings.
Auto PitchFan, Fib Extension/Retracement and ZigZag by DGT Aᴜᴛᴏ PɪᴛᴄʜFᴀɴ, Fɪʙ Exᴛᴇɴꜱɪᴏɴ/Rᴇᴛʀᴀᴄᴇᴍᴇɴᴛ ᴀɴᴅ ZɪɢZᴀɢ
This study aim to automate PitchFan drawing tool and combines it with Fibonacci Extentions/Retracements and ZigZag.
Common setting options, applied to all components of the study
Deviation , is a multiplier that affects how much the price should deviate from the previous pivot in order for the bar to become a new pivot. Increasing its value is one way to get higher timeframe Levels
Depth , affects the minimum number of bars that will be taken into account when building
Historical PitchFan / Fibonacci Levels option will allow plotting of PitchFan / Fibonacci Levels on previous Pivot Highs/Lows
█ PɪᴛᴄʜFᴀɴ — is a set of rays spreading out of the point of a trend's beginning. These rays inclined with the coefficients formed by a Fibonacci number sequence. It is recommended to adjust the Pitchfan plottings to fit after the first wave of the trend has passed and the correction has clearly begun.
PitchFan rays corresponding to Fibonacci levels appear on a chart and represent inclined lines of support and resistance. Price areas near these rays are estimated areas from which the price can turn around or make a significant rebound. The whole logic of working with a pitchfan is based on one simple idea - if the price has bounced off the level, then the correction is likely to end, and the trend will continue. If the price has broken the first resistance, you should wait for the next level test
- Automatically plots PitchFan Rays, based on Pivot Lows/Highs.
- Ability to set ALERTs for each PitchFan Ray Level
- PitchFan Labels displays the price of the line at the last bar, the price value will be recalculated in each new bar
Please check the link provided below with the educational post of how to apply pitchfork, application of pitchfan is same keeping in mind the recommendation stated above
█ Fɪʙ Rᴇᴛʀᴀᴄᴇᴍᴇɴᴛs / Exᴛᴇɴꜱɪᴏɴꜱ
Fibonacci retracements is a popular instrument used by technical analysts to determine support and resistance areas. In technical analysis, this tool is created by taking two extreme points (usually a peak and a trough) on the chart and dividing the vertical distance by the key Fibonacci coefficients equal to 23.6%, 38.2%, 50%, 61.8%, and 100%.
Fibonacci extensions are a tool that traders can use to establish profit targets or estimate how far a price may travel AFTER a retracement/pullback is finished. Extension levels are also possible areas where the price may reverse.
IMPORTANT NOTE: Fibonacci extensions option may require to do further adjustment of the study parameters for proper usage. Extensions are aimed to be used when a trend is present and they aim to measure how far a price may travel AFTER a retracement/pullback. I will strongly suggest users of this study to check the education post for further details where to use extensions and where to use retracements
- Automatically plots possible Support and Resistance levels, based on Pivot Lows/Highs.
- Ability to set ALERTs for each Fibonacci Extension/Retracement Level
- Labels displays the level and the level price
█ Zɪɢ Zᴀɢ — The Zig Zag indicator is used to help identify price trends and changes in price trends. The Zig Zag indicator plots points on a chart whenever prices reverse by a percentage greater than a Deviation variable. Straight lines are then drawn, connecting these points. The Zig Zag indicator serves base for PitchFan and Fibonacci Retracements / Extensions
█ OTHER
PitchFan is often used in combination with the other indicators and/or drawing tools such as Fibonacci Retracement, Fibonacci Channels, Fibonacci Time Zone and others. It allows identify the most powerful areas from which price can turn and to get more accurate trading signal
Andrews’ Pitchfork, how to apply pitchfork and automated pitchfork study
Fibonacci Fans, how to apply fibonacci fans and automated fibonacci speed and resistance fans study
Fibonacci Extension / Retracement, where to use extensions and where to use retracements and automated fibonacci extension / retracement / pivot points study
Others
Fibonacci Channels, how to apply fibonacci channels and automated fibonacci channels study
Linear Regression Channels, , what linear regression channels are? and linear regression channel/curve/slope study
Disclaimer :
Trading success is all about following your trading strategy and the indicators should fit within your trading strategy, and not to be traded upon solely
The script is for informational and educational purposes only. Use of the script does not constitute professional and/or financial advice. You alone have the sole responsibility of evaluating the script output and risks associated with the use of the script. In exchange for using the script, you agree not to hold dgtrd TradingView user liable for any possible claim for damages arising from any decision you make based on use of the script

RSI with bands and multiple EMAs Combination of RSI and EMAs, useful in predicting momentum switches and defining overbought/oversold conditions on all time frames.

Auto Pitchfork, Fib Retracement and Zig Zag by DGTPitchfork is a technical indicator for a quick and easy way for traders to identify possible levels of support and resistance of an asset's price. It is presents and based on the idea that the market is geometric and cyclical in nature
Developed by Alan Andrews, so sometimes called Andrews’ Pitchfork
It is created by placing three points at the end of previous trends
Schiff and Modified Pitchfork is a technical analysis tool derived from Andrews' Pitchfork
In general, traders will purchase the asset when the price falls near the support of either the center trendline or the lowest trendline. Conversely, they'll sell the asset when it approaches the resistance of either the center line or the highest trendline.
█ Study OPTIONS
Auto Pitchfork , the main aim of the study
Pivots threshold can be customized by “Deviation” and “Depth” input options
Pitchfork Type selection, available options Andrews' Pitchfork (Original), Schiff and Modified Pitchfork
Ability to set ALERTs for the Pitchfork Levels
Ability to add customized levels (all level lines customizable)
Auto Fib Retracement – This is the build-in study of TradingView, slight changes applied to fit with Auto Pitchfork
Zig Zag – Derived from build-in Auto Fib Retracement with some customization options.
█ Usage Tips :
Andrews' Pitchfork (Original) best fit in a Strong Trending Market
Schiff and Modified Pitchfork better with Correcting or Sideways Market. Modified Pitchfork is almost identical to a Parallel Chanel
Disclaimer :
Trading success is all about following your trading strategy and the indicators should fit within your trading strategy, and not to be traded upon solely
The script is for informational and educational purposes only. Use of the script does not constitute professional and/or financial advice. You alone have the sole responsibility of evaluating the script output and risks associated with the use of the script. In exchange for using the script, you agree not to hold dgtrd TradingView user liable for any possible claim for damages arising from any decision you make based on use of the script

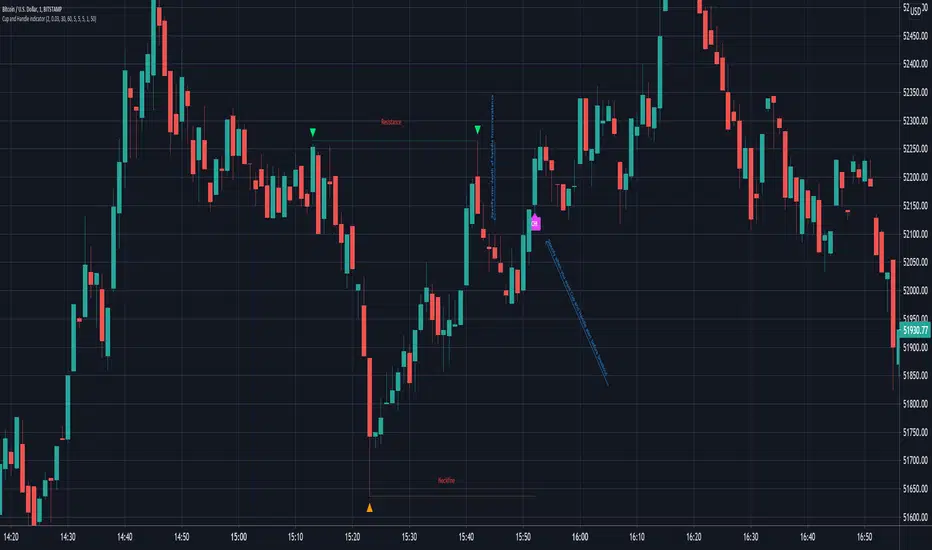
Cup and Handle IndicatorThis is a Cup and Handle Indicator. Features include:
Can set alert at any point after handle starts rising before breakout
Can detect multiple tops before confirming cup and handle pattern, not just double.
Many settings to adjust to meet your exact requirements
The functionality of this indicator is very similar to my double top indicator , and inherits majority of the settings/inputs. Please try that indicator before using this one.
From Wikipedia: In the domain of technical analysis of market prices, a cup and handle or cup with handle formation is a chart pattern consisting of a drop in the price and a rise back up to the original value, followed first by a smaller drop and then a rise past the previous peak. It is interpreted as an indication of bullish sentiment in the market and possible further price increases.
The cup part of the pattern should be fairly shallow, with a rounded or flat "bottom" (not a V-shaped one), and ideally reach to the same price at the upper end of both sides. The drop of the handle part should retrace about 30% to 50% of the rise at the end of the cup. For stock prices, the pattern may span from a few weeks to a few years; but commonly the cup lasts from 1 to 6 months, while the handle should only last for 1 to 4 weeks.
The "cup and handle" formation was defined by William O'Neil"
Key settings to note compared to my double top indicator are highlighted in following image
PM me to obtain access
Best regards.
Donchian Channels Trending Breakout StrategyThis script looks for two entry signals. Long is when the previous breakout of the donchian channels was a low, price is above the input EMA, current price is equal or higher than the upper band and we're not in a position yet. Short is the other way around, so previous breakout of the donchian channels was a high, price is below the input EMA, current price is equal or lower than the lower band.
I haven't found a script that does take the previous highs and lows into consideration. Works for any markets in any conditions because the stop loss and profit targets are based on the upper and lower band of the donchian channels, which means the stop loss and profit targets move with the trend.
For more details see the script itself, I wrote a ton of comments.

The Turtle Trading ChannelTurtle Rules:
To trade exactly like the turtles did, you need to set up two indicators representing the main and the failsafe system.
Set up the main indicator with TradePeriod = 20 and StopPeriod = 10 (A.k.a S1)
Set up the failsafe indicator with TradePeriod = 55 and StopPeriod = 20 (A.k.a S2)
The entry strategy using S1 is as follows
Buy 20-day breakouts using S1 only if last signaled trade was a loss.
Sell 20-day breakouts using S1 only if last signaled trade was a loss.
If last signaled trade by S1 was a win, you shouldn't trade -Irregardless of the direction or if you traded last signal it or not-
The entry strategy using S2 is as follows:
Buy 55-day breakouts only if you ignored last S1 signal and the market is rallying without you
Sell 55-day breakouts only if you ignored last S1 signal and the market is pluging without you
The turtles had a progressive position sizing approach that boosted their winnings. Once a trading decision has been made you should...
Enter the market with 2% risk. Place stop-loss 2ATR from the opening price.
If the position moves in your favor 1/2ATR, enter the market again with 2% risk and trail all stop-losses 2ATR from current price.
If the position moves in your favor 1/2ATR, enter the market again with 2% risk and trail all stop-losses 2ATR from current price.
If the position moves in your favor 1/2ATR, enter the market again with 2% risk and trail all stop-losses 2ATR from current price.
Stop adding to positions when 4 positions have been taken. (*** And see money management rule below)
The exit strategy is carried out using the line with the shortest period of the indicator:
Exit longs taken using S1 when price action closes below a 10-day low
Exit shorts taken using S1 when price action closes above a 10-day high
Exit longs taken using S2 when price action closes below a 20-day low
Exit shorts taken using S2 when price action closes avove a 20-day high
The turtles had very strict money management too. Initial position risk was 2%, but it decreased according to the current drawdown.
If the account had a 10% drawdown, the risk for each trade should decrease a 20%
If the account had a 20% drawdown, the risk for each trade should decrease a 40%.
If the account had a 30% drawdown, the risk for each trade should decrease a 60%.
So, if the account had a N% drawdown, the risk for each trade should decrease N*2%.
Spanish Traslation :
Reglas de las tortugas:
Para tradear exactamente como lo hacían las tortugas, debe configurar dos indicadores que representen el sistema principal y el de seguridad .
Configure el indicador principal con TradePeriod = 20 y StopPeriod = 10 (Aka S1 )
Configure el indicador de seguridad con TradePeriod = 55 y StopPeriod = 20 usando un color diferente. (También conocido como S2 )
La estrategia de entrada usando S1 es la siguiente
Compre rupturas de 20 días usando S1 solo si la última operación señalada fue una pérdida.
Venda rupturas de 20 días usando S1 solo si la última operación señalada fue una pérdida.
Si la última operación señalada por S1 fue una victoria, no debe operar, independientemente de la dirección o si la última operación la realizó o no.
La estrategia de entrada con S2 es la siguiente:
Compre rupturas de 55 días solo si ignoró la última señal S1 y el mercado se está recuperando sin usted
Venda rupturas de 55 días solo si ignoró la última señal S1 y el mercado se está disparando sin usted
Las tortugas tenían un enfoque de tamaño de posición progresivo que aumentó sus ganancias. Una vez que se haya tomado una decisión comercial, debe ...
Ingresar al mercado con un 2% de riesgo. Coloque el stop-loss 2ATR desde el precio de apertura.
Si la posición se mueve a su favor 1 / 2ATR, ingrese al mercado nuevamente con un 2% de riesgo y arrastre todos los stop-loss 2ATR del precio actual.
Si la posición se mueve a su favor 1 / 2ATR, ingrese al mercado nuevamente con un 2% de riesgo y arrastre todos los stop-loss 2ATR del precio actual.
Si la posición se mueve a su favor 1 / 2ATR, ingrese al mercado nuevamente con un 2% de riesgo y arrastre todos los stop-loss 2ATR del precio actual.
Deje de agregar posiciones cuando se hayan tomado 4 posiciones. (*** Y vea la regla de administración de dinero a continuación)
La estrategia de salida se realiza utilizando la línea de menor periodo del indicador:
Salga de largos tomados usando S1 cuando la acción del precio cierra por debajo de un mínimo de 10 días
Salga de los cortos tomados con S1 cuando la acción del precio cierre por encima de un máximo de 10 días
Salga de largos tomados usando S2 cuando la acción del precio cierra por debajo de un mínimo de 20 días
Salga de los cortos tomados con S2 cuando la acción del precio se cierre evite un máximo de 20 días
Las tortugas también tenían una administración de dinero muy estricta . El riesgo de la posición inicial fue del 2%, pero disminuyó de acuerdo con la reducción actual.
Si la cuenta tiene una reducción del 10%, el riesgo de cada operación debería disminuir un 20%.
Si la cuenta tiene una reducción del 20%, el riesgo de cada operación debería disminuir un 40%.
Si la cuenta tiene una reducción del 30%, el riesgo de cada operación debería disminuir un 60%.
Entonces, si la cuenta tiene una reducción del N%, el riesgo de cada operación debería disminuir N * 2%.

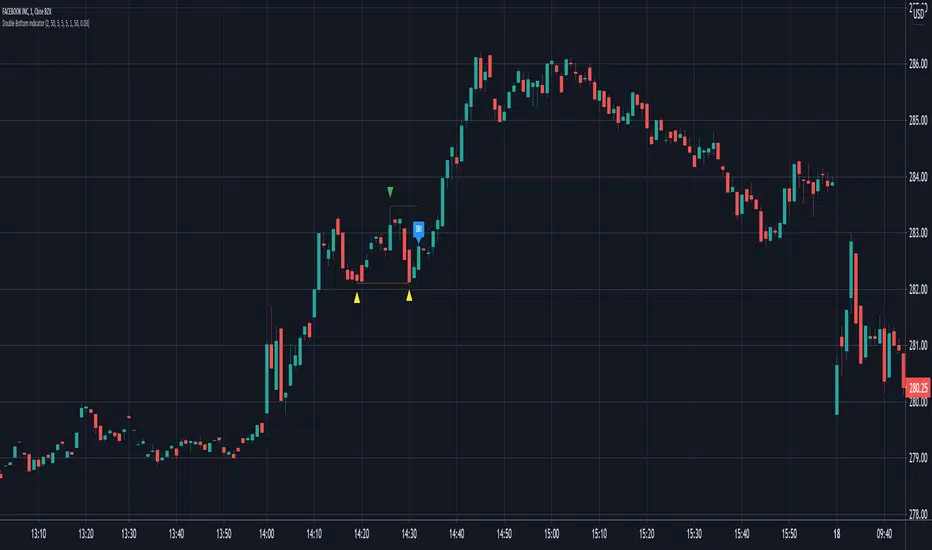
Fluffykats's Double Bottom indicator with alert v1This is a double bottom indicator with an alert that has many settings to customize your double bottom .
From Wikipedia "A double bottom is the end formation in a declining market. The pattern is formed by two price minima separated by local peak defining the neck line. The formation is completed and confirmed when the price rises above the neck line, indicating that further price rise is imminent or highly likely."
The following can be customized:
The left and right bar strengths for both the Right Top ( RT ) and Left Top ( LT ). For an explanation on RT / LT bar strength see (pivothigh) tradingview pine script API notes.
The price variance in % between RT / LT
The minimum and maximum allowable separation between RT / LT
Ability to toggle visibility of prices
PM us to obtain access
Best regards.
Channel Cross StrategyTrend Following using Channel based Script. Long and Short Entry based on Custom filter to avoid False Signal.
Works best for BankNifty and Nifty and few Indian Stocks.
Untick Exponential gives better Result.

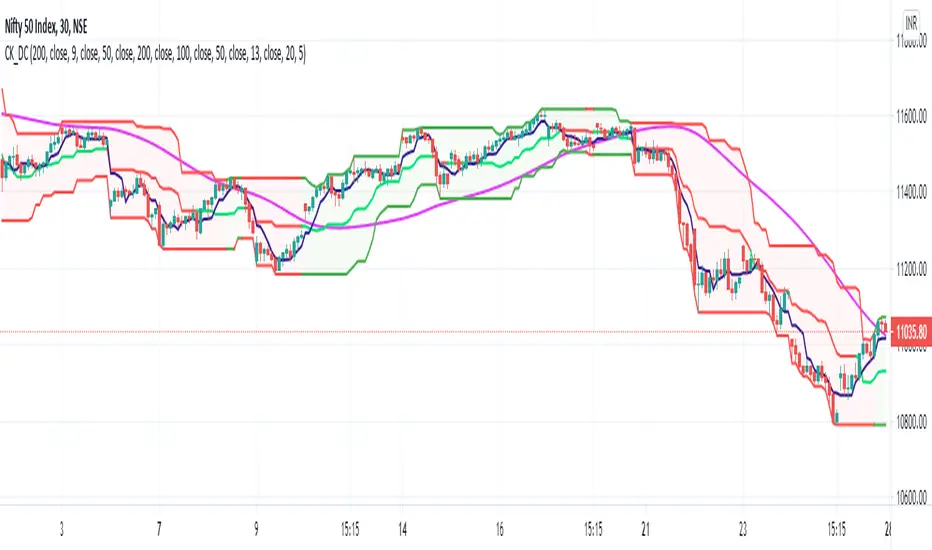
Modified Donchian ChannelRelease Note:
This indicator setup highly inspired by Donchian Channel and Hull Moving Average. Big thanks to both Richard Donchian and Alan Hull.
Back test and live test it and come to conclusion of how to use this indicator for live trading.
200 HMA:
200 Hull Moving Average plays major role in deciding the right trades using Donchian Channel. As part of this setup,
If price is below 200 HMA, then the Donchian Channel is highlighted in Red color
If price is above 200 HMA, then the Donchian Channel is highlighted in Green color
Donchian Channel:
Default 20 period is used for the Donchian channel. However, the color highlight as per 200 HMA position. Also, the middle basis color changes to Green and Red based on candle close of above or below.
Additionally, 5 period Donchian basis is used as tight stop loss. This can be used wisely or optionally based on trade decisions
Disclaimer:
//Idea of publishing this script is to identify the strength of the instrument using multiple confirmation.
//Using this indicator, changing inputs, and trading decisions are up to the users/traders.
//Courtesy: Thanks to Richard Donchian and Alan Hull as this indicator/script inspired by Donchian Channels and Hull Moving Average
EMA Keltner Channel 1D100/200 EMAs, along with Keltner Bands based off them. Colors correspond to actions you should be ready to take in the area. Use to set macro mindset.
Uses the security function to display only the 1D values.
Red= Bad
Orange = Not as Bad, but still Bad.
Yellow = Warning, might also be Bad.
Purple = Dip a toe in.
Blue = Give it a shot but have a little caution.
Green = It's second mortgage time.