[SwingMann©] MACD+ MACD+
Advanced MACD with flexible smoothing and MA types
Description:
The MACD+ is an enhanced version of the classic MACD indicator, designed to give traders greater control over the calculation and smoothing process.
With selectable moving average types (SMA, EMA, WMA) and additional smoothing options for both the MACD and Signal lines, it offers a more refined way to visualize market momentum and trend shifts.
Highlights:
• Choose between SMA, EMA, and WMA for MACD and Signal Line
• Independent smoothing for both MACD and Signal values
• Clean histogram visualization
• Alerts for bullish/bearish histogram phase shifts
• Perfect companion to SwingMann© EWTrend+
Osciladores Centrados

Multi-Timeframe Stochastic (4x Konfiguracja + Schodki)Skrypt stoch z wielu TF można sobie ustawiać pod siebie.

Momentum/Breakout Strategy A professional-grade trend–momentum hybrid strategy designed for high–timeframe precision and long-term consistency.
It combines exponential moving averages (EMA 20/50) to define directional bias, RSI and MACD to confirm momentum strength, and a manually coded ADX filter to validate market trend quality.
ATR-based stop placement and trailing mechanisms control downside volatility, while an optional daily EMA trend filter aligns trades with higher–timeframe direction for smoother performance.

SSI-O - Super Strength Indicator (overlay) [Da_Prof]This is the overlay version of the Super Strength Indicator (SSI). The SSI is a combination of the money flow indicator (MFI), stochastic (Stoch) and relative strength index (RSI). These indicators are averaged together with weightings tested via months of backtesting to produce the SSI algorithm that is not just a simple average or summation of these indicators. The SSI is a sensitive indicator that detects exhaustion of momentum for all assets.
The overlay version of the SSI shows triangles above/below the price when there is high/low risk. The high risk is colored purple. The extreme high risk is colored red. The low risk is colored blue/green and the extreme low risk is colored green.
Weightings of each into the indicator can be changed. If changing the weighting, it is best to ensure the percentages add up to 300%. For example, if changing the RSI weight to 120%, it is best to drop the MFI and Stoch to 90% each.
The RSI SMA is default set at 1. This means the indicator uses the RSI with no smoothing. If changing to greater than 1, then the indicator uses the moving average smoothed RSI.
The default for the Stoch is to use the K only. The D can be used by changing the weightings.

SSI - Super Strength Indicator [Da_Prof]The Super Strength Indicator (SSI) is a combination of the money flow indicator (MFI), stochastic (Stoch) and relative strength index (RSI). These indicators are averaged together with weightings tested via months of backtesting to produce the SSI algorithm that is not just a simple average or summation of these indicators. The SSI is a sensitive indicator that detects exhaustion of momentum for all assets.
The SSI shows background colors when there is high/low risk. The high risk is colored purple. The extreme high risk is colored red. The low risk is colored blue/green and the extreme low risk is colored green.
Weightings of each into the indicator can be changed. If changing the weighting, it is best to ensure the percentages add up to 300%. For example, if changing the RSI weight to 120%, it is best to drop the MFI and Stoch to 90% each.
The RSI SMA is default set at 1. This means the indicator uses the RSI with no smoothing. If changing to greater than 1, then the indicator uses the moving average smoothed RSI.
The default for the Stoch is to use the K only. The D can be used by changing the weightings.

AlphaMACD - Adaptive MACD with Efficiency RatioOVERVIEW
AlphaMACD is an adaptive implementation of the classic MACD indicator that dynamically adjusts its calculation periods based on market efficiency. Unlike traditional MACD which uses fixed periods (typically 12, 26, 9), this indicator adapts its fast and slow EMA periods in real-time based on how efficiently the market is trending.
WHAT MAKES THIS ORIGINAL
This is not a simple MACD with different settings or colors. The core innovation is the adaptive period calculation using Kaufman's Efficiency Ratio, which was originally developed for the Adaptive Moving Average (AMA). This indicator applies that adaptive logic to MACD itself.
Key Differences from Standard MACD:
- Periods dynamically adjust between user-defined ranges (default: 8-21 for fast, 21-55 for slow)
- Uses Kaufman's Efficiency Ratio to measure market trendiness
- Implements gap protection to prevent extreme spikes from market gaps
- Includes market regime detection to filter signals in choppy conditions
- Provides multi-timeframe trend confirmation
HOW IT WORKS
1. Efficiency Ratio Calculation:
The indicator calculates market efficiency by comparing the absolute price change over a period to the sum of absolute price changes within that period. High efficiency = strong trending market. Low efficiency = choppy/sideways market.
2. Adaptive Period Adjustment:
- In trending markets (high efficiency): Periods move toward the minimum values for faster response
- In choppy markets (low efficiency): Periods move toward the maximum values for slower, more stable signals
- The "Sensitivity" parameter controls how aggressively periods adapt (0.5 to 5.0)
3. Gap Protection:
The custom adaptive EMA function detects abnormal price gaps (moves larger than 3x the typical ATR-based change) and limits their impact on the calculation. This prevents weekends or news gaps from causing extreme MACD spikes.
4. Signal Quality Filtering:
- Market regime detection identifies trending vs sideways conditions
- Momentum filter (RSI-based) prevents signals during overextended moves
- Signal strength calculation helps identify high-confidence setups
- Sideways market signals are marked with warning symbols
5. Multi-Timeframe Analysis:
The indicator compares current timeframe MACD with a higher timeframe (default 60 min) to provide context and filter against-trend signals.
HOW TO USE IT
Settings:
- Core Settings: Define the minimum and maximum periods for fast/slow EMAs
- Sensitivity: Higher values make the indicator more responsive to market changes
- Multi-timeframe: Set a higher timeframe for trend confirmation
- Visual options: Customize appearance and enable/disable features
Signal Interpretation:
- Strong bullish/bearish signals (large triangles): High-confidence entries in trending markets
- Warning signals (small ⚠): Crossovers in sideways markets - use caution or skip
- Divergence labels ("DIV"): Price and MACD diverging - potential reversal
- Background color: Green tint = trending market, Orange tint = sideways market
The Information Table shows:
- Current market regime (trending or sideways)
- Market efficiency percentage (how clean the trend is)
- Current adaptive fast and slow periods
- Higher timeframe trend direction
- Current signal strength
Best Practices:
- In trending markets: Trust strong signals, avoid warning signals
- In sideways markets: Reduce position sizes or skip trades entirely
- Use higher timeframe confirmation for better signal quality
- Adjust sensitivity based on your trading timeframe (higher for intraday, lower for swing)
TECHNICAL DETAILS
Calculation Method:
- Efficiency Ratio = ABS(Close - Close ) / SUM(ABS(Close - Close ), Period)
- Smoothed Efficiency = EMA(Efficiency Ratio, 5)
- Fast Period = Fast_Min + (Fast_Max - Fast_Min) × (1 - Smoothed_Efficiency × Sensitivity)
- Slow Period = Slow_Min + (Slow_Max - Slow_Min) × (1 - Smoothed_Efficiency × Sensitivity)
- Adaptive EMA uses standard EMA formula with gap detection and limiting
- MACD = Fast Adaptive EMA - Slow Adaptive EMA
- Signal = EMA(MACD, Signal Period)
- Histogram = MACD - Signal
The adaptive periods are calculated on every bar, so the MACD responds faster in trending conditions and stabilizes during consolidation.
WHAT THIS SOLVES
Standard MACD Problems:
- Fixed periods don't adapt to changing market conditions
- Too many false signals in sideways markets
- Whipsaws during low-volatility consolidation
- Price gaps can cause misleading spikes
AlphaMACD Solutions:
- Periods automatically adjust to market state
- Market regime filter identifies and warns about sideways conditions
- Adaptive smoothing reduces whipsaws
- Gap protection prevents false extremes
LIMITATIONS
- Like all indicators, this does not predict the future
- Requires trending markets for optimal performance
- Adaptive calculation means backtesting results will differ from fixed-period MACD
- More complex than standard MACD - requires understanding of adaptive concepts
- The adaptive periods mean you cannot directly compare this to traditional MACD studies
This indicator is best used as part of a complete trading system, not as a standalone signal generator.
EDUCATIONAL VALUE
For traders learning about:
- Adaptive indicators and market efficiency concepts
- Kaufman's Adaptive Moving Average principles applied to oscillators
- Market regime detection and signal filtering
- Gap handling in technical indicators
- Multi-timeframe analysis integration
Not Financial advice.

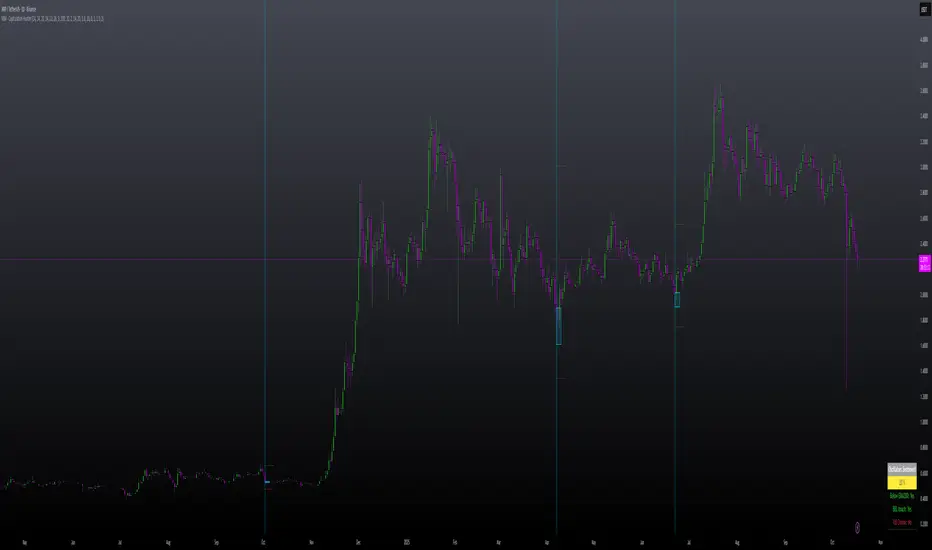
MILLION MEN - Capitulation Hunter What it is
MILLION MEN – Capitulation Hunter detects potential capitulation buy-limits using a confluence of momentum, volatility, and liquidity cues. It combines a 5-oscillator sentiment (RSI / Stoch / CCI / MFI / MACD histogram) with EMA200 trend context, Bollinger lower band proximity, volume climax, and an optional liquidity sweep check. When all filters align, the tool paints a BUY-LIMIT zone and proposes SL/TP levels.
How it works (high-level)
Oscillator sentiment (0–100%): counts how many of the five oscillators are bullish; capitulation candidate = 0%.
Trend & location: price below EMA200 and at/through BB lower band (basis ± mult×σ).
Selling climax: current volume ≥ X × volume SMA.
Liquidity sweep (optional): current low sweeps the prior N-bar low but closes back above it.
Confirmation: optional 0–2 extra bars (close > low and bullish bodies) before validating.
On validation, the script draws: BUY-LIMIT zone, dotted SL = zone bottom − ATR×mult, TP by R:R, and a mini sentiment table.
How to use
Look for zones after fast, extended selloffs into BB-L with volume spike and oscillators at 0%.
Place pending BUY-LIMIT inside the painted zone; use the plotted SL/TP as a starting point.
Works across timeframes; adjust volume multiplier, sweep length, confirmation bars, and ATR×SL to your market.
For added confluence: HTF structure, session/flow, or order-book/liquidity context.
Originality & value
Instead of a generic mashup, this tool enforces a strict confluence: (1) five-oscillator capitulation, (2) location at BB-L under EMA200, (3) volume climax, (4) optional sweep/recapture, and (5) bar-based confirmation—then auto-renders a practical trade plan (zone + SL/TP) and a readable sentiment table. All calculations are manual (no lookahead) and designed for clarity and execution.
Limitations & transparency
Capitulation can persist during strong downtrends; always use structure and risk management.
SL/TP visuals are hints, not orders; adapt to instrument volatility and liquidity.
Non-standard chart types aren’t supported for signals. No future data is used.
This is not financial advice; past performance does not guarantee future results.
(ملخص عربي )
مؤشر يلتقط سيناريوهات الاستسلام البيعي (Capitulation) عبر شروط متشددة: مزاج مؤشرات الزخم = 0%، السعر تحت EMA200 وعند/أسفل BB-L، ذروة فوليوم، واختياري سويب قيعان ثم ارتداد. عند التأكيد يرسم منطقة BUY-LIMIT ويقترح SL/TP. استخدمه مع هيكل السوق وإدارة المخاطر.
CMF, RSI, CCI, MACD, OBV, Fisher, Stoch RSI, ADX (+DI/-DI)Eight normalized indicators are used in conjunction with the CMF, CCI, MACD, and Stoch RSI indicators. You can track buy and sell decisions by tracking swings. The zero line is for reversal tracking at -20, +20, +50, and +80. You can use any of the nine indicators individually or in combination.

TREND (Type II) | Hamster-CoderTREND (Type II) — Smart Trend Reversal Indicator Based on RCI & MACD
TREND (Type II) is a powerful tool for traders who want to spot not just where the market is now, but where it might be heading next.
It combines the analytical strength of RSI and MACD to identify potential trend reversal points before they become obvious on the chart.
🚀 Key Advantages
Early trend detection. TREND can anticipate possible reversals even before the actual crossover occurs.
Flexible visualization. Displayed in a separate panel while showing buy/sell signals directly on the main chart.
Multi-timeframe support. Analyze signals from higher or lower timeframes without switching charts.
Intuitive color background. The background automatically turns red during bearish conditions for instant market sentiment recognition.
🎯 Signal Types
Primary Signal. When RCI and MACD lines actually cross, confirming a trend shift.
Preliminary Signal. When a crossover is projected to occur on the next bar.
Overheat Signal. When the market reaches a defined threshold (e.g. ±90) and starts showing signs of cooling down.
🧠 Unique Features
Extra Filters (experimental). Filters out weak or false signals, showing only those confirmed by additional criteria.
RCI–MACD Difference Mode. Visualize the distance between RCI and MACD as a histogram to assess divergence strength.
Custom Thresholds. Define your own overbought/oversold zones to fine-tune signal sensitivity.
🔍 Who It’s For
TREND (Type II) is ideal for traders who:
seek dynamic entry and exit points without lagging indicators;
want visual and statistical confirmation of trend changes;
build multi-layered strategies requiring signal validation.
💬 Use TREND (Type II) to see the market one step ahead.
This isn’t just another indicator — it’s an early warning system for potential trend reversals .

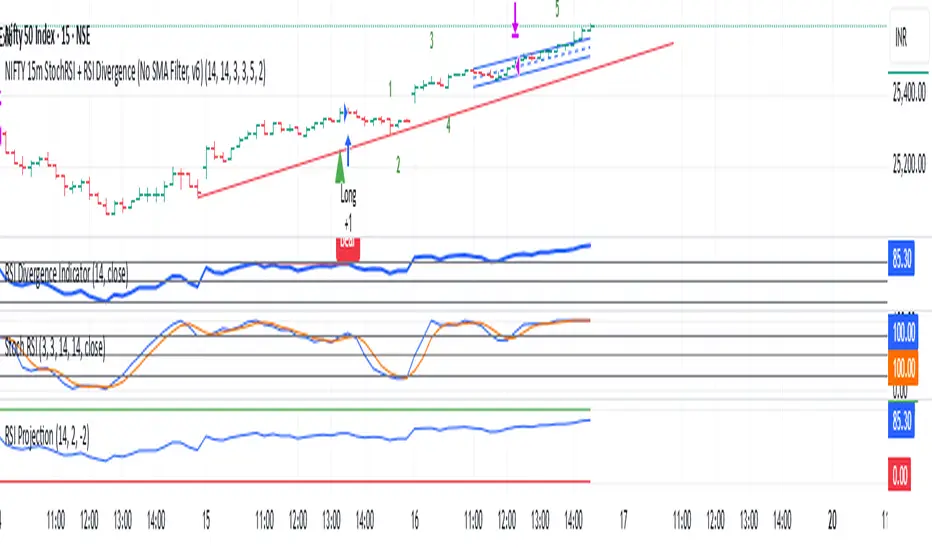
AlgoWay GRSIM🧭 What this strategy tries to do
This strategy detects when a market move is losing strength and prepares for a potential reversal, but it waits for fresh momentum confirmation before acting.
It combines:
• RSI-based divergence (to spot exhaustion and potential turning points),
• Impulse MACD (to verify that the new direction actually has force behind it).
________________________________________
⚙️ When it takes trades
Long (Buy):
• A bullish RSI divergence appears (a clue that selling pressure is fading);
• Within a short time window, the Impulse MACD turns strongly positive;
• Optionally, the impulse line itself must be rising (if the Impulse Direction Filter is
enabled).
Short (Sell):
• A bearish RSI divergence appears (buying pressure fading);
• Within a short time window, the Impulse MACD turns strongly negative;
• Optionally, the impulse line must be falling (if the Impulse Direction Filter is enabled).
If momentum confirmation happens too late, the divergence “expires” and the signal is ignored.
________________________________________
🧩 How entries work
1. Reversal clue:
The strategy detects disagreement between price and RSI (price makes a new high/low, RSI doesn’t).
That suggests a shift in underlying strength.
2. Momentum confirmation:
Before entering, the Impulse MACD must agree — showing real push in the same direction.
3. Impulse direction filter (optional):
When enabled, the impulse itself must accelerate (rise for longs, fall for shorts), avoiding fake signals where price diverges but momentum is still fading.
4. No stacking:
It opens only one position at a time.
________________________________________
🚪 How exits work
Two main exit styles:
Conservative (default):
Longs close when impulse crosses below its signal line.
Shorts close when impulse crosses above its signal line.
✅ Keeps trades as long as momentum agrees.
Color-change (fast):
Longs close immediately when impulse flips bearish.
Shorts close immediately when impulse flips bullish.
⚡ Faster and more defensive.
Plus:
Stop Loss (%) and Take Profit (%) act as fixed-distance protective exits (set to 0 to disable either one).
________________________________________
📊 What you’ll see on the chart
A thick Impulse MACD line and thin signal line (oscillator view).
Diamonds — detected bullish/bearish divergence points.
Circles — where impulse crosses its signal (momentum change).
A performance panel (top-right) showing Net Profit, Trades, Win Rate, Profit Factor, Pessimistic PF, and Max Drawdown.
________________________________________
🔧 What you can tune
Signal Lifetime (bars): how long a divergence remains valid.
Impulse Direction Filter: ensure the impulse itself is moving in the trade’s direction.
Stop Loss / Take Profit (%): risk and target in percent.
Exit Style: conservative cross or faster color-change.
RSI / MA / Signal Lengths: adjust responsiveness (defaults are balanced).
________________________________________
💪 Strengths
Confirms reversals using momentum direction, not just divergence.
Avoids “early” signals where momentum is still fading.
Works symmetrically for longs and shorts.
Built-in stop/target protection.
Clear, visual confirmation of all logic components.
________________________________________
⚠️ Things to keep in mind
In sideways markets, the impulse can flip often — prefer conservative exits.
Too small SL/TP → constant stop-outs.
Too wide SL/TP → deep drawdowns.
Always test with different timeframes and markets.
________________________________________
💡 Practical tips
Start with default settings.
Enable “Use Impulse Direction Filter” in trending markets, disable it in very choppy ones.
Focus on Profit Factor, Win Rate, and Max Drawdown after several dozen trades.
Keep SL/TP roughly aligned with typical swing size.
“AlgoWay GRSIM” is a reversal-with-confirmation strategy: it spots likely turns, demands real momentum alignment (optionally verified by impulse direction), and manages exits with clear momentum cues plus built-in protective limits.

MomentumMap — Relative Strength Visual Quadrant (RRG-Inspired)🔍 What is MomentumMap?
MomentumMap brings the concept of Relative Rotation Graphs (RRG) directly to your chart.
It helps you instantly see whether a symbol is leading, improving, weakening, or lagging — without scanning dozens of charts.
Unlike traditional RS indicators, this tool plots RS Ratio and RS Momentum together, classifying the current condition into clear quadrants.
🧩 Quadrant Logic
Zone Conditions Market Behavior
🟢 Power Zone RS > 1, Momentum > 0 Strong, leading, expanding trend
🟡 Drift Zone RS > 1, Momentum < 0 Cooling off after leadership
🔵 Lift Zone RS < 1, Momentum > 0 Early signs of strength emerging
🔴 Dead Zone RS < 1, Momentum < 0 Weak and lagging phase
Each bar’s background color reflects the active zone — giving instant visual feedback on rotation strength.
⚙️ Key Features
Benchmark-based RS Ratio & RS Momentum mapping
Auto-classified quadrant display with live background coloring
Optional Power Zone alert (with volume confirmation)
Adjustable RS smoothing and momentum periods
Works on all instruments and timeframes
💡 How to Use
Apply the indicator to any chart.
Choose your benchmark symbol (default: NSE:CNX500).
Observe the color-coded zones to assess strength rotation.
Use transitions between zones to identify:
New leadership → 🟢 Power Zone
Early rotation → 🔵 Lift Zone
Loss of strength → 🟡 Drift Zone
Weak performers → 🔴 Dead Zone
⚠️ Notes & Disclaimer
MomentumMap is an analytical visualization tool, not a buy/sell signal generator.
Choose benchmarks and timeframes that match your trading universe.
The script does not repaint and uses only confirmed bar data.
Past quadrant behavior does not guarantee future results.
Complies with TradingView’s open-source and originality guidelines.
📚 Credits
Concept inspired by Julius de Kempenaer’s RRG framework
Implementation and logic developed independently by Paritosh Gupta

Moving Average Convergence-Divergence (MACD)This script implements the Moving Average Convergence-Divergence (MACD), a popular momentum indicator used in technical analysis to identify trend direction, momentum shifts, and potential buy/sell signals.
🔹 Key Features
1. Inputs & Customization
MACD Lines Toggle: Enable/disable the MACD and signal lines.
Source Price: Defaults to close but can be adjusted (e.g., open, high, low, hl2).
Fast Length (12): The period for the faster-moving EMA.
Slow Length (26): The period for the slower-moving EMA.
Signal Length (9): The smoothing period for the signal line.
2. Calculations
Computes the MACD Line (fast EMA - slow EMA).
Computes the Signal Line (EMA of the MACD line).
Computes the Histogram (difference between MACD and Signal lines).
3. Visual Indicators
Zero Line: A white horizontal line at 0 for reference.
MACD Line: Plotted in green when above the signal line, red when below.
Signal Line: Displayed as a yellow line.
Histogram:
Green bars when MACD > Signal (bullish momentum).
Red bars when MACD < Signal (bearish momentum).
Background Highlights:
Light green on bullish crossovers (MACD crosses above Signal).
Light red on bearish crossunders (MACD crosses below Signal).
4. Alerts
Triggers when:
Bullish Crossover (MACD crosses above Signal).
Bearish Crossunder (MACD crosses below Signal).
🔹 How Traders Use This Indicator
Trend Identification:
MACD above zero → bullish trend.
MACD below zero → bearish trend.
Momentum Signals:
Bullish Crossover (Buy Signal): MACD crosses above Signal.
Bearish Crossunder (Sell Signal): MACD crosses below Signal.
Divergence (Not in this script, but useful):
Price makes higher highs, but MACD makes lower highs → Potential reversal.
🔹 Strengths of This Script
✅ Clean and Efficient Code – Uses Pine Script v6 best practices.
✅ Customizable Inputs – Adjust lengths and source price.
✅ Clear Visuals – Color-coded for easy interpretation.
✅ Built-in Alerts – For automated trading strategies.
Jul 1
Release Notes
This script implements the Moving Average Convergence-Divergence (MACD), a popular momentum indicator used in technical analysis to identify trend direction, momentum shifts, and potential buy/sell signals.
🔹 Key Features
1. Inputs & Customization
MACD Lines Toggle: Enable/disable the MACD and signal lines.
Source Price: Defaults to close but can be adjusted (e.g., open, high, low, hl2).
Fast Length (12): The period for the faster-moving EMA.
Slow Length (26): The period for the slower-moving EMA.
Signal Length (9): The smoothing period for the signal line.
2. Calculations
Computes the MACD Line (fast EMA - slow EMA).
Computes the Signal Line (EMA of the MACD line).
Computes the Histogram (difference between MACD and Signal lines).
3. Visual Indicators
Zero Line: A white horizontal line at 0 for reference.
MACD Line: Plotted in green when above the signal line, red when below.
Signal Line: Displayed as a yellow line.
Histogram:
Green bars when MACD > Signal (bullish momentum).
Red bars when MACD < Signal (bearish momentum).
Background Highlights:
Light green on bullish crossovers (MACD crosses above Signal).
Light red on bearish crossunders (MACD crosses below Signal).
4. Alerts
Triggers when:
Bullish Crossover (MACD crosses above Signal).
Bearish Crossunder (MACD crosses below Signal).
🔹 How Traders Use This Indicator
Trend Identification:
MACD above zero → bullish trend.
MACD below zero → bearish trend.
Momentum Signals:
Bullish Crossover (Buy Signal): MACD crosses above Signal.
Bearish Crossunder (Sell Signal): MACD crosses below Signal.
Divergence (Not in this script, but useful):
Price makes higher highs, but MACD makes lower highs → Potential reversal.
🔹 Strengths of This Script
✅ Clean and Efficient Code – Uses Pine Script v6 best practices.
✅ Customizable Inputs – Adjust lengths and source price.
✅ Clear Visuals – Color-coded for easy interpretation.
✅ Built-in Alerts – For automated trading strategies.

Moving Average Convergence Divergence ProThis script is an advanced and highly customizable version of the classic Moving Average Convergence Divergence (MACD) indicator for TradingView. It builds upon the standard MACD by adding professional features like divergence detection, visual enhancements, configurable alerts, and optional smoothing, making it a more powerful tool for technical analysis.
Key Features and Functionality
Enhanced Visual Customization:
Toggleable Elements: You can independently show or hide the main MACD line, signal line, histogram, and the fill area between the lines.
Customizable Colors: All elements (bullish, bearish, signal line, divergence markers) can be colored to your preference.
Dynamic Histogram: The histogram uses a gradient effect, becoming more transparent during weaker momentum and more opaque during stronger momentum.
Optional EMA Smoothing:
Includes an option to apply an Exponential Moving Average (EMA) to the main MACD line, which can help smooth out noise and provide clearer signals.
Built-in Divergence Detection:
Automatically scans for classic bullish and bearish divergences between price and the MACD line.
Bullish Divergence: Price makes a lower low, but the MACD line makes a higher low (and is above the zero line).
Bearish Divergence: Price makes a higher high, but the MACD line makes a lower high (and is below the zero line).
These are clearly marked with triangle shapes at the top and bottom of the indicator panel.
Comprehensive Alert Conditions:
The script is pre-configured to generate alert conditions for:
Bullish Crossover (MACD line crosses above Signal line)
Bearish Crossunder (MACD line crosses below Signal line)
Bullish Divergence Detection
Bearish Divergence Detection
This allows traders to set up automated notifications directly within TradingView.
Clear Visual Cues:
The entire indicator's background changes color to signal key events:
Green for a bullish crossover.
Red for a bearish crossunder.
Light Green for a bullish divergence.
Light Red for a bearish divergence.
How to Use the Indicator
Signal Generation:
Crossover: The most common signal. A buy signal occurs when the MACD line crosses above the signal line (especially near or below the zero line). A sell signal occurs when it crosses below.
Zero Line: The MACD line crossing above the zero line is considered bullish, and crossing below is bearish.
Divergence: Divergences can be powerful signals for potential trend reversals. A bullish divergence suggests selling pressure may be exhausting, while a bearish divergence suggests buying pressure may be waning.
Customization for Your Strategy:
If you find the standard MACD too noisy, enable the "Show EMA of MACD" option to smooth the main line.
If you only care about crossovers, you can turn off the histogram and fill to reduce visual clutter.
Use the divergence detection to spot high-probability reversal setups that other traders might miss.

SZO - Signal Zone Oscillator ## Signal Zone Oscillator - SZO
**Created by:** @TraderCurses
**Version:** 1.0 (October 2025)
### ▌ OVERVIEW
The Signal Zone Oscillator (SZO) is a comprehensive momentum tool designed to provide a clearer, more nuanced view of market dynamics. It synthesizes three of the most powerful classic indicators—RSI, a unique MACD Ratio, and the Stochastic oscillator—into a single, unified signal.
The indicator's core feature is the **"Signal Zone"**: a colored area between the main oscillator line and its moving average filter. This zone makes it incredibly easy to visualize shifts in momentum, trends, and potential entry/exit points.
### ▌ KEY FEATURES
* **Composite Formula:** Combines RSI, MACD Ratio, and Stochastic using a weighted average to measure underlying market momentum.
* **The Signal Zone:** The flagship feature. The area between the SZO line and its filter is colored **green** in a bullish context (SZO above filter) and **red** in a bearish context (SZO below filter).
* **Dynamic Coloring:** Both the main SZO line and its filter change color dynamically, providing instant feedback on direction and strength.
* **Zero-Line Reference:** A dashed zero line acts as a classic equilibrium level, helping to confirm stronger bullish or bearish momentum.
* **Fully Customizable:** Every parameter is adjustable. You can change the lengths, sources, and even the weights of the core indicators from the settings menu.
* **Built-in Alerts:** Comes with pre-configured alerts for crossovers of the filter and the zero line, allowing you to automate your monitoring.
### ▌ HOW TO USE IT
The SZO provides several clear signals for traders:
1. **Bullish Signal:**
* The SZO line crosses **above** its filter.
* The Signal Zone turns **green**.
* A cross above the zero line can be used as further confirmation of strong bullish momentum.
2. **Bearish Signal:**
* The SZO line crosses **below** its filter.
* The Signal Zone turns **red**.
* A cross below the zero line can be used as further confirmation of strong bearish momentum.
3. **Divergences:**
* Like any oscillator, look for divergences between the SZO's peaks/troughs and the price action to spot potential reversals.
This tool is designed for traders who want to cut through the noise and get a clear, actionable signal from multiple momentum sources at once. Happy trading!

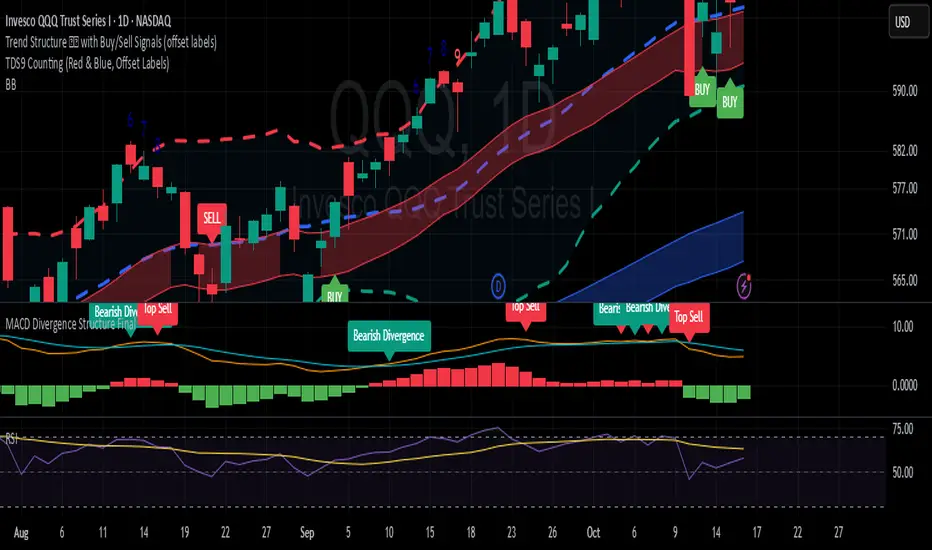
MACD Divergence StructureMACD Divergence Structure Final
This indicator enhances the classic MACD by automatically detecting and labeling key divergence structures. It highlights bullish and bearish divergences, as well as potential sell tops and disappearing tops, directly on the chart. By combining EMA‑based MACD calculations with dynamic label plotting, it provides traders with clear, actionable signals to anticipate possible trend reversals or momentum shifts. Designed for flexibility and clarity, it helps traders quickly spot hidden market structure changes without cluttering the chart.
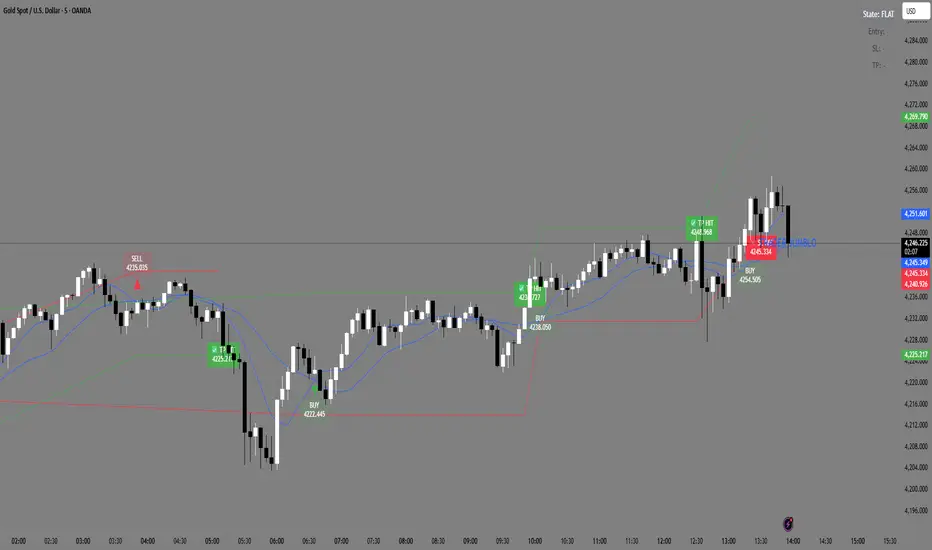
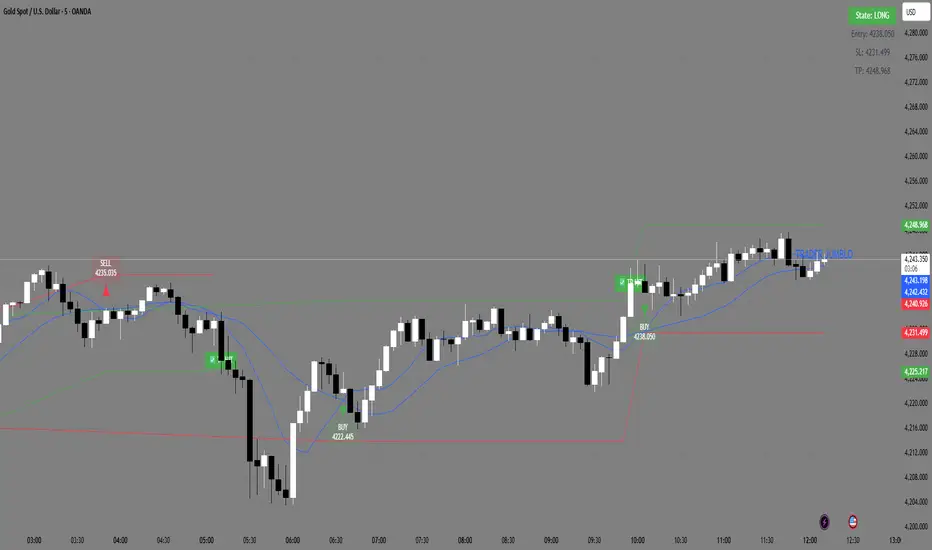
Trader Jumblo Auto Signal V6Trader Jumblo Auto Signal V6 is an advanced crossover-based signal system designed to generate persistent BUY and SELL entries with dynamic ATR-based Take Profit (TP) and Stop Loss (SL) levels.It provides clean, non-repainting trade signals that remain visible on the chart even after price movement — ensuring clarity during both backtesting and live trading sessions.
⚙️ How It Works
🟦 Two Blue Lines — These are your moving averages (Fast and Slow).
The crossover between them determines the signal direction.
When the Fast MA (light blue) crosses above the Slow MA → a BUY signal appears.
When the Fast MA crosses below the Slow MA → a SELL signal appears.
You can choose between SMA or EMA and adjust the lengths in the settings.
🟢 Green Line — The Take Profit (TP) level, calculated using ATR × TP multiplier.
It shows the projected target area for profit when a trade is active.
🔴 Red Line — The Stop Loss (SL) level, also based on ATR × SL multiplier.
It marks the risk boundary for each signal.
✅ When price reaches the green line, “TP HIT” appears.
❌ When price hits the red line, “SL HIT” appears.
These markers persist so you can analyze trade outcomes clearly.
📈 Main Features
Dynamic ATR-based TP and SL levels (auto-adjust with volatility)
Persistent entry, TP, and SL labels (no vanishing signals)
Optional RSI filter for signal confirmation
Instant alert system for BUY/SELL/TP/SL or combined events
Lightweight and optimized for any timeframe
⚡ Best Use
Ideal for swing and intraday traders who want visual clarity and structured risk/reward zones. Works effectively on Gold, Forex, crypto, indices, and stocks
REMS Synergy OverlayThis 3rd generation REMS indicator builds upon the foundations assessing the relationships between RSI, EMAs, MACDs, and Stochastic RSI across multiple timeframes. Designed to help traders identify less frequent, but high probability entries across 2 time frames. Uses 3 levels of confluence indicators for both long and short moves.
Confluence Level 1 (Highest Conviction):
Evaluates selected criteria across both timeframes. All selected criteria must be in confluence to trigger signal.
Confluence Level 2 (Moderate Conviction):
Selected criteria can be selected by each timeframe individually. All selected criteria must be in confluence to trigger signal.
Confluence Level 3 (Lower/supportive confluence):
Of the selected criteria, this level can evaluate a set number of conditions that must be met. Number of conditions is user-defined.
Includes VWAP and 4 EMAs as optional visual representations.
Includes 'Enhanced Candles' than can colour code candlesticks for better visual identification. (off by default)
Originally designed with 5 minute and 2 minute timeframes in mind, and pairs well with REMS First Strike and/or REMS Snap Shot indicators.
Values coded below:
RSI
-Primary: Length = 14, Smoothing = 20 (via SMA)
-Secondary: Length = 7, Smoothing = 20 (via SMA)
Stochastic RSI
Primary:
-RSI Length = 14
-Stochastic Length = 8
-%K = 3, %D = 3
Secondary:
-RSI Length = 7
-Stochastic Length = 7
-%K = 3, %D = 2
MACD - applied to both timeframes
-Fast = 12, Slow = 26, Signal = 9

Solana 4H RSI->MACD — Counter-Trend By TetradTetrad RSI→RSI Cross→MACD (Sequenced) — Counter-Trend (SL-Only)
Category: Market-neutral, counter-trend, sequenced entries
Timeframe default: Works on any TF; designed around 4H On Solana
Markets: Any (spot, perp, futures); parameterize to your asset
What it does
This strategy hunts reversals using a 3-step sequence on RSI and MACD, then optionally restricts entries by market regime and a price gate. It shows stop-loss lines only when hit (clean chart), and paints a Donchian glow for quick read of backdrop conditions.
Entry logic (sequenced)
1. RSI Extreme:
Long path activates when RSI < Oversold (default 27.5).
Short path activates when RSI > Overbought (default 74).
2. RSI Cross confirmation:
Long path: RSI crosses up back above the oversold level.
Short path: RSI crosses down back below the overbought level.
Each step has a max bar lookback so stale signals time out.
3. MACD Cross trigger:
Long: MACD line crosses above Signal.
Short: MACD line crosses below Signal.
→ When step 3 fires and gates are satisfied, a trade is entered.
Optional gates & filters
Regime Filter (Counter-Trend):
Longs allowed in **Range / Short Trend / Short Parabolic** regimes.
Shorts allowed in **Range / Long Trend / Long Parabolic** regimes.
Based on ADX/DI and ATR% intensity.
* Price Gate (Long Ceiling):
Toggle to **disable new longs above a chosen price (default 209.0 For SOL).
Useful for assets like SOL where you want longs only below a cap.
Exits / Risk
* Stop-Loss (% of entry):** default **14%**, toggleable.
* SL visualization:** plots a **thin dashed red line only on the bar it’s hit**.
* (No take-profit or time-based exit in this version—keep it pure to the sequence and regime. Add TP/time exits if desired.)
Visuals
* Donchian Glow (50): background band only (upper/lower lines hidden).
* Regime HUD: compact table (top-right) highlighting the active regime.
* Minimal marks: no entry/exit “arms” clutter; only SL-hit lines render.
Inputs (key)
* Core: RSI Length, Oversold/Overbought, MACD Fast/Slow/Signal.
* Sequence: Max bars from Extreme→RSI Cross and RSI Cross→MACD Cross.
* Regime: ADX Length, Trend/Parabolic thresholds, ATR length & floor.
* Stops: Enable/disable; SL %.
* Price Gate: Enable; Long ceiling price.
Alerts
Sequenced Long (CT): RSIhigh → RSI cross down → MACD bear cross.
## Notes & Tips
Designed for counter-trend fades that become trend rides. The regime filter helps avoid fading true parabolics and aligns entries with safer contexts.
The sequence is stateful (steps must occur in order). If a step times out, the path resets.
Works on lower TFs, but the 4H baseline reduces noise and over-trading.
Consider pairing with volume or structure filters if you want fewer but higher-conviction entries.
Past performance ≠ future results. **Educational use only. Not financial advice.

Free Stock ScreenerMissing great trade opportunities is annoying, and unless you have 12 screens or only trade one market, you are missing a lot of trades. To fix that, we created this free stock screener so you get notified instantly of potential great trading conditions in real time, right on your chart.
You get notified of trading benchmarks being met by the value being displayed on the scanner as well as a color change so that it grabs your attention and makes you aware that you should take a look at the other market and look for a potential trade. It also has built in alerts so you can have an alert notification go off when any of your trading conditions are met instead of needing to watch the scanner for color changes.
The screener will change the ticker symbol background color to red green when price is above or below the previous daily range and above or below both VWAPs. This signals that the ticker is trending, which typically means it is a great time to trade that market and follow the trend.
This free stock screener allows you to scan up to 10 different markets at the same time for various different conditions so you always know what is going on with your favorite trading symbols. If you want to scan more tickers, just add the indicator to your chart again and change the table position to the other side of the screen and update the tickers on the 2nd screener, allowing you to have 20 tickers at a time.
The scanner can be fully customized by changing the markets that it screens and turning on or off as many of them as you would like. You can also turn on or off any of the different data sets so that you only get information about trading conditions that matter to you.
The screener can provide data on any type of market, such as stocks, crypto, futures, forex and more. Each ticker can be adjusted to whatever market you would like it to scan for data in the settings panel, the only limitation is that it will not provide data for the VWAP and volume trend score if the ticker you are screening does not provide volume data.
Screener Features
The scanner will provide the following types of data for each ticker that is turned on:
Volume - Provides a volume score compared to the average volume and notifies you of higher than normal volume and volume spikes on individual bars by changing colors.
Volatility - Provides a volatility score compared to the average volatility and notifies you of higher than normal volatility by changing colors.
Oscillator - Choose between the RSI or CCI. The value of that oscillator will be displayed and will notify you when values are in extreme ranges such as overbought or oversold conditions according to the threshold values you enter in the settings panel. When those thresholds have been breached, you will be notified by it changing color.
Big Candles - Compares the current candle to average previous candle sizes, and changes color to notify you of big candles including a big top wick, big bottom wick, big candle body and big candle high to low range.
Daily Level Touches & Trends - Calculates and displays various daily candle and intraday open price levels that act as support and resistance. Notifies you when price is touching any of the daily levels that are turned on. The levels you can have on are as follows: previous day high, previous day low or previous day open. It also will notify you when price is touching the current day’s open, NY 930am open, Asia 8pm open, London 2am open and NY midnight 12am open. It will also say “Above” if price is above the previous day’s high or it will say “Below” if price is below the previous day’s low. The color of the cell will also change when a level touch is happening or price is above the previous day high or below the previous day low.
VWAP - Choose from 2 different VWAP lengths, default settings are daily and weekly VWAPs. You will get notified if price touches either of the VWAPs and they will also say “Above” or “Below” if price is currently above or below each VWAP.
How To Use The Screener To Help You Trade
The main purpose of the screener is to scan other markets and notify you of potential good trading opportunities such as price bouncing off of the daily levels or VWAPs. It can also be used to know when price is trending according to the VWAPs and daily levels. Lastly, you can use it to know how the volume and volatility trends are currently which gives you more confidence in taking a trade with this data when volume and volatility are present.
Volume Score
When volume is high, this represents a good time to trade because there are many market participants and price is likely to be volatile while there is high volume which can present a lot of good trade setups for you to take.
The volume score shown on the screener measures the current volume trend compared to previous volume trends and calculates that into a score based on 100 being the same as the previous volume trend. So any value above 100 means it is high volume and any value less than 100 means it is lower volume than normal.
In the settings panel, you can adjust the volume threshold that needs to be met for a volume notification to show up. The default setting is at 120, so you will get notified when the current volume trend score is 120 or higher or you can adjust that threshold value to whatever value you prefer.
It also will notify you when there is a volume spike on the current bar. This is determined by calculating an average of the recent volume totals and then checking to see if the current bar is greater than or equal to that average multiplied by 3. So if a single bar has volume that is greater than 3 times what the average volume is, then you will get a notification that says “Spike” to make you aware of that volume spike.
The volume trend threshold, volume spike multiplier and lookback length for the average volume used in volume spike calculations can all be adjusted in the settings panel to fit your desired preferences.
Volatility Score
High volatility can mean it is a great time to trade because the market is moving quickly and providing large enough movements that you can get in and out in a short amount of time, while still accruing decent sized trade PnL.
The volatility score will calculate the current volatility for each market compared to previous conditions and then divide the current volatility by the average volatility to give you a volatility score. Anything over 100 means the market is decently volatile and you should look at that market to find potential trade setups to execute on. Anything below 100 means the market is not very volatile and it is usually best to just wait until volatility returns before you start trading again.
The screener will notify you when the volatility score is above the threshold you set. The default value is set to 90, but can be adjusted to your preference. Pay attention to any market that shows an alert and take a look at that chart because the high volatility may present a good trade setup for you in the near future.
Oscillator Score
The oscillator data can be switched between Relative Strength Index(RSI) and Commodity Channel Index(CCI).
The RSI provides a value between 0 and 100 that indicates the momentum and strength of the recent price action. Many traders use the extremes of the 0-100 range to signal overbought or oversold conditions and use that as a sign to look for price to reverse in the near future. The typical values used for this and the default settings to provide notifications are: 70 for overbought and 30 for oversold. The scanner will notify you when the RSI value is considered overbought or oversold so you know to take a look at the chart and analyze if it is ready for a trade to be taken.
The CCI provides a value that can be used to determine the trend strength of the underlying asset when the oscillator moves above 100 or below -100. These extreme values are outside of the normal accumulation range and signify that price is moving strongly in that direction so it may be a good time to take a trade in the direction of the trend. The scanner will show you the value of the CCI for each market and notify you if that value is above 100 or below -100.
Both RSI and CCI settings can be adjusted in the settings panel to your desired settings so you have the exact oscillator settings you prefer to use as well as the exact values that you want to use for being notified.
Big Candles
Big candles can mean that many traders are buying or selling at the same time and many times indicate a good signal to trade in that same direction. That is why we included this calculation in the screener, so you are always aware when a large candle prints.
It calculates the average size of the recent candles and then uses that average as the benchmark to determine if the current candle is considered big and worthy of notifying you to take a look at that chart.
You can adjust the multiplier used for the big candle threshold to whatever you desire, but the default setting is 3 which means the candle will be considered big and notify you if it is 3 times as large as an average candle.
The big candles data will track the following candle values and notify you with these labels:
High to Low candle size = HL
Candle Body from open to close candle size = OC
Top Wick size = TW
Bottom Wick size = BW
Daily Level Touches & Trend
Daily level touches are excellent levels to watch for price to bounce because they often act as support and resistance levels for intraday trading. The scanner will track each market and notify you when the current candle is touching any of the daily levels that you have turned on in the settings panel.
The main levels that are turned on by default and are useful for all markets and how they will be labeled on the scanner are as follows:
Previous Day High = High
Previous Day Low = Low
Previous Day Open = < Open
Previous Day Close = Close
Current Day Open = Open
We also included some extra levels that are useful for futures traders. They are as follows:
NY 930am Open = 930am
NY 12am Midnight Open = 12am
Asia Open at 8pm NY time = Asia
London Open at 2am NY Time = London
Watch how price reacts to these levels and then trade the bounces off of these levels if the price action confirms that it is going to respect that level.
When price is currently above the previous day high, the scanner will say “Above” and show a green color, indicating a bullish trend and that price is above the previous daily candle’s high.
When price is currently below the previous day low, the scanner will say “Below” and show a red color, indicating a bearish trend and that price is below the previous daily candle’s low.
Pay attention to when price is trending above or below the previous daily candle as those trends can provide excellent trend trading opportunities.
The daily levels that you have turned on in the settings will also show as lines on the chart and include a label next to them, identifying each level so you know what each line represents. You can turn on or off all of the lines shown on the chart in the main settings or turn them off one by one in the style panel of the settings. Labels can also be turned on or off for all of the lines in the main settings panel. You can adjust the label positioning in the Label Offset section of the settings panel.
VWAP Touches & Trend
VWAP stands for volume weighted average price and is a very popular tool that traders use to determine trend direction based on volume as well as an excellent level to trade price bounces off of.
The typical VWAP time period used is Daily, which means the volume weighted average price will reset at the beginning of a new day. We set the first VWAP to be the daily VWAP by default and the second one to be the weekly VWAP. You can adjust both of the time periods to be any of the provided time lengths that you choose.
The screener will show “Above” with a green background color when price is above the VWAP, indicating a bullish trend. It will show “Below” with a red background color when price is below the VWAP, indicating a bearish trend. When both VWAPs are showing Above or Below, you can expect price to trend in that direction, so look for pullbacks you can trade in the direction of the trend. If the VWAPs are showing different directions, then you should expect to bounce back and forth between the VWAPs, but be careful and watch out for price to break beyond either one and start a trend.
When the current candle is touching the VWAP, the scanner will change colors and say VWAP to notify you that price is touching the VWAP and you should look at that chart and analyze the market for a potential bounce off of the VWAP to trade.
Trending Market Signals
Strong trends are excellent markets to trade and can many times provide excellent trading opportunities that don’t require expert price action reading skills to be able to take winning trades from. That is why we included a signal to notify you of a strong trending market.
The strong trending market will show up as a green or red background color for the ticker name. If the color of the ticker name is green, it is notifying you that the price is above the previous daily high, above VWAP 1 and above VWAP 2 and is a good market to look for bullish trend trades. If the color of the ticker name is red, it is notifying you that the price is below the previous daily low, below VWAP 1 and below VWAP 2 and is a good market to look for bearish trend trades.
Changing The Tickers It Scans
To change the tickers that the indicator scans, scroll near the bottom of the settings panel and select the ticker symbol you want to update and then search for the exact symbol you want to use. If you want to scan less tickers, then just turn some of the tickers off that you don’t need.
Scanning More Than 10 Tickers
If you want to scan more than 10 tickers, you can add the scanner to your chart again and then just change the table position to the other side of the screen. This will allow you to scan 10 more tickers that will show up separately. Then if you want even more, just add the indicator to your chart again and update the table position until you have as many markets as you want. The table position setting can be found at the bottom of the main settings panel.
Alerts
The screener has alerts that can be used to notify you when any of the data set thresholds have been met or if price is touching one of the levels. You can set alerts for the following events:
Bullish Trend Alert - Price is above the previous daily high and above both VWAPs.
Bearish Trend Alert - Price is below the previous daily low and below both VWAPs.
High Volume Alert - Volume is higher than the threshold or a volume spike is detected.
High Volatility Alert - Volatility is higher than the threshold.
Oscillator Is Extended Alert - Oscillator value has exceeded the upper or lower threshold.
Big Candle Alert - A big candle has been detected.
Daily Level Touch Alert - One of the daily levels that is turned on is being touched.
VWAP Touch Alert - One of the 2 VWAPs are being touched.
An alert will trigger when any one of tickers on your scanner meets the alert conditions, so when you see the alert, you will need to go to your chart and look at the scanner to see which ticker it was and then navigate to that chart to look for potential trade setups.
The alerts will use the exact same settings you have configured in the settings panel to send you alert notifications. With normal settings, this could give you a lot of alerts, so if you only want alerts to fire when abnormal conditions are being met, try setting up a second screener on your chart that has very high threshold values and only has the most important level touches on. Then turn the setting "Do Not Show The Screener On The Chart" to off so the calculations will still run and fire alerts, but won't clog up your charts. This way you can only get alert notifications when major events happen but still have your normal screener settings available on your chart.
Markets This Can Be Used On
This screener uses the price action and volume data so you can use it to scan any type of market you would like as long as the ticker you are scanning has price and volume data feeds. If a market does not have volume data, then it will just show NaN in the volume row and the VWAP rows will not show anything.

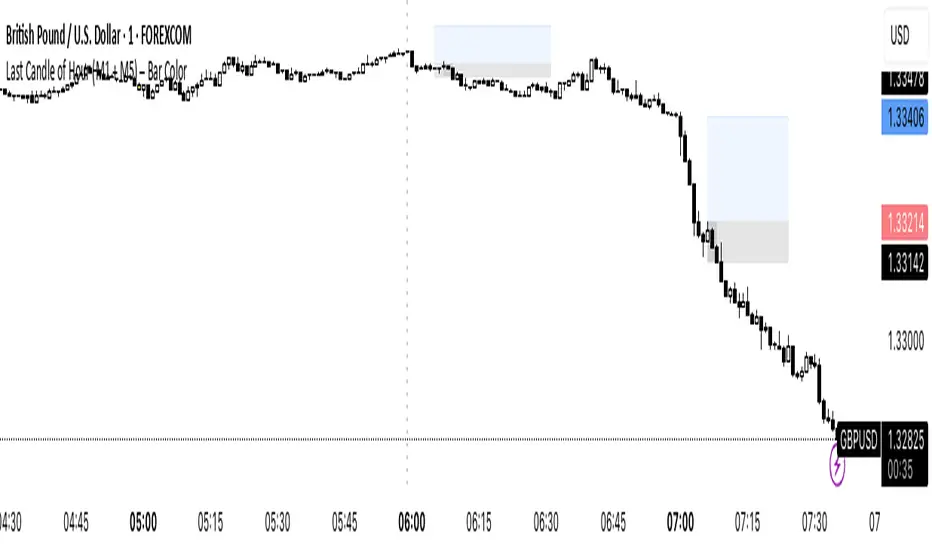
Last Candle of Hour Highlighter (M1 + M5)Highlights the last candle of every hour on 1-minute (M1) and 5-minute (M5) charts, making it easier to spot session closes, breakouts, and end-of-hour price action at a glance.
Detailed Description / How to Use:
This indicator automatically detects the last candle of each hour and changes its colour for quick visual reference. It’s designed for traders who use short-term timeframes (M1, M5) and want a clean visual cue for hourly closes.
Features:
• Automatically detects M1 and M5 timeframes.
• Highlights the last candle of each hour with a customisable colour.
• Optional Bull/Bear mode: colour changes depending on candle direction.
• Simple and lightweight — does not affect chart performance.
Inputs / Settings:
1. Color by Bull/Bear – Toggle on to automatically colour the last candle green (bullish) or red (bearish) based on its close relative to the open.
2. Highlight Colour – Choose a single colour if Bull/Bear mode is off.
3. Bullish Colour – Choose the colour for bullish last candles.
4. Bearish Colour – Choose the colour for bearish last candles.
Usage Tips:
• Works best on 1-minute and 5-minute charts.
• Ideal for spotting end-of-hour reversals, breakout candles, and momentum shifts.
• Can be combined with other indicators like support/resistance or moving averages for more advanced strategies.
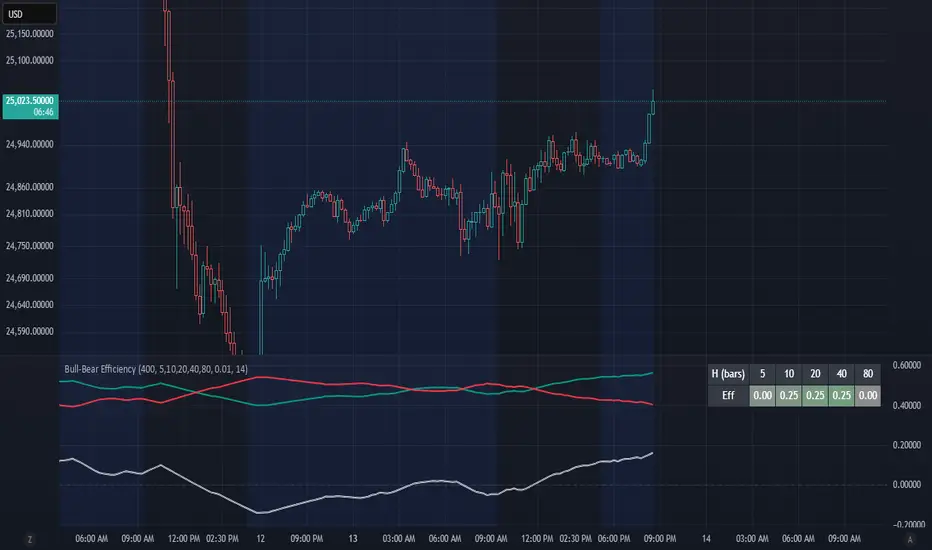
Bull-Bear EfficiencyBull-Bear Efficiency
This indicator measures the directional efficiency of price movement across many historical entry points to estimate overall market bias. It is designed as a trend gauge rather than a timing signal.
Concept
For each historical bar (tau) and a chosen lookahead horizon (h), the script evaluates how efficiently price has traveled from that starting point to the endpoint. Efficiency is defined as the net price change divided by the total absolute movement that occurred along the path.
Formula:
E(tau,h) = ( Price - Price ) / ( Sum from i = tau+1 to tau+h of | Price - Price | )
This measures how "straight" the path was from the entry to the current bar:
If price moved steadily upward, the numerator and denominator are nearly equal, and E approaches +1 (efficient bullish trend).
If price moved steadily downward, E approaches -1 (efficient bearish trend).
If price chopped back and forth, the denominator grows faster than the numerator, and E approaches 0 (inefficient movement).
The algorithm computes this efficiency for many past starting points and multiple horizons, optionally normalizing by ATR to account for volatility. The efficiencies are then weighted by recency to emphasize more recent behavior.
From this, the script derives:
Bull = weighted average of positive efficiencies
Bear = weighted average of negative efficiencies (absolute value)
Net = Bull - Bear (net directional efficiency)
Interpretation
Bull, Bear, and Net quantify how coherently the market has been trending.
Bull near 1.0, Bear near 0.0, Net > 0 -> clean upward trends; long positions have been more efficient.
Bear near 1.0, Bull near 0.0, Net < 0 -> clean downward trends; short positions have been more efficient.
Bull and Bear both small or similar -> low-efficiency, range-bound environment.
Net therefore acts as a "trend coherence index" that measures whether price action is directionally organized or noisy.
Practical Use
Trend filter:
Apply trend-following systems only when Net is strongly positive or negative.
Avoid them when Net is near zero.
Regime change detection:
Crossings through zero often correspond to transitions between trending and ranging regimes.
Momentum loss detection:
If price makes new highs but Net or Bull weakens, it suggests trend exhaustion.
Settings Overview
Lookback: Number of historical bars considered as entry points (tau values).
Horizons: List of forward projection lengths (in bars) for measuring efficiency.
Recency Decay (lambda): Exponential weighting that emphasizes recent data.
Normalize by ATR: Adjusts "effort" to account for volatility changes.
Display Options: Toggle Bull, Bear, Net, or Signed Average (S). Customize line colors.
Notes
This indicator does not produce entry or exit signals.
It is a statistical tool that measures how efficiently price has trended over time.
High Net values indicate smooth, coherent trends.
Low or neutral Net values indicate noisy, directionless conditions.