M.Right Candlestick Patterns & Bulkowski Percentages 1.0Hello Traders!
As a fan of Bulkowski, I figured I'd release this for everyone's benefit as well.
The legendary candlestick pattern expert, Thomas Bulkowski, has over 35 years of trading and analysis experience and is the absolute go-to expert when it comes to candlestick pattern identification.
Bulkowski Candlestick Percentages from his site and books.
Source: Built in "All Candlestick Patterns"
In this version,
--> Added 8 Candles and removed some that are statistically insignificant and others that Bulkowski doesn't use (can add back if requested).
--> Added 2 Colors for Bullish and Bearish Continuations.
----> Assigned Colors Tested performance to Continuations.
--> Built-in Variables and Candles adjusted slightly to conform to Bulkowski pattern principles.
--> Moved inputs back to ABC order.
--> Decided to leave the theoretical performance positioning for the signal (i.e. Top for theoretically bearish ). However..
----> I adjusted the signal color to match Bulkowski's tested performance.
--> Removed Plot Close (obsolete)
--> Hover over signal to see both Theoretical and Tested Performance.
Figured I'd help give an edge to the @TradingView Community like so many before me have been able to.
Please feel free to add comments, share insight, and of course, like!
Cheers,
Mike
Candlesticksignals

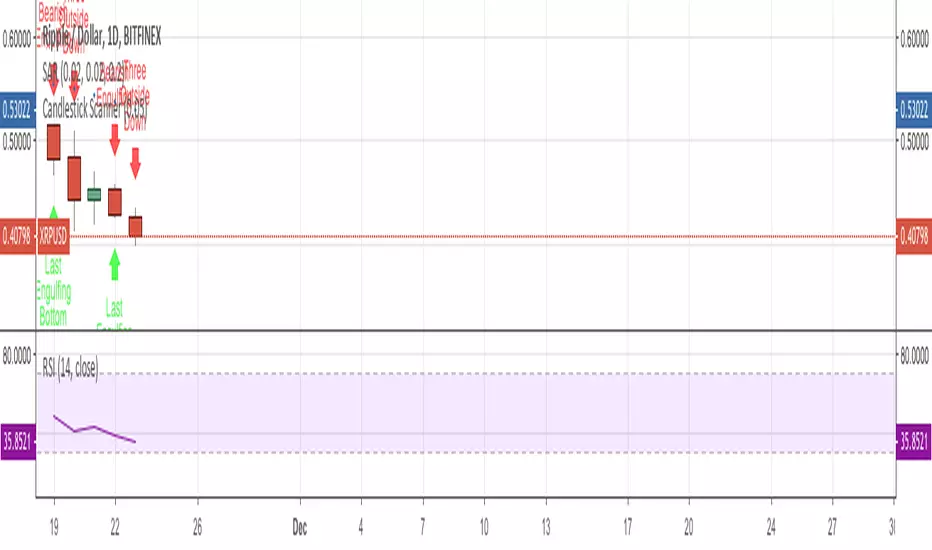
[CP]Pivot Boss Candlestick Scanner - No Repainting This indicator is based on the high probability candlestick patterns described in the ’Secrets of a Pivot Boss’ book.
The indicator does not suffer from repainting.
I have kept this indicator open source, so that you can take this indicator and design a complete trading system around it.
Although the patterns have some statistical edge in the markets, blindly using them as Buy/Sell Indicators will certainly result in a heavy loss.
I like some of these setups more than others, and I have listed them in the order of my likeness.
The first one I like the most, the last one, I like the least.
The patterns are universal and work well in both intraday, daily and even larger timeframes.
Signals in the example charts are manually marked by,
Hammer - profitable short signal
Rocket - profitable long signal
X - unprofitable long or short signal
GENERAL USER INPUTS:
These settings exist as the indicator uses ‘Labels’ to mark the patterns and Pine Script limits a maximum of 500 labels on a chart.
If you want to go back in the past and check how the indicator was doing, set the Start and End dates both and check the ’Use the date range above to mark the Candlestick Setups?’ option.
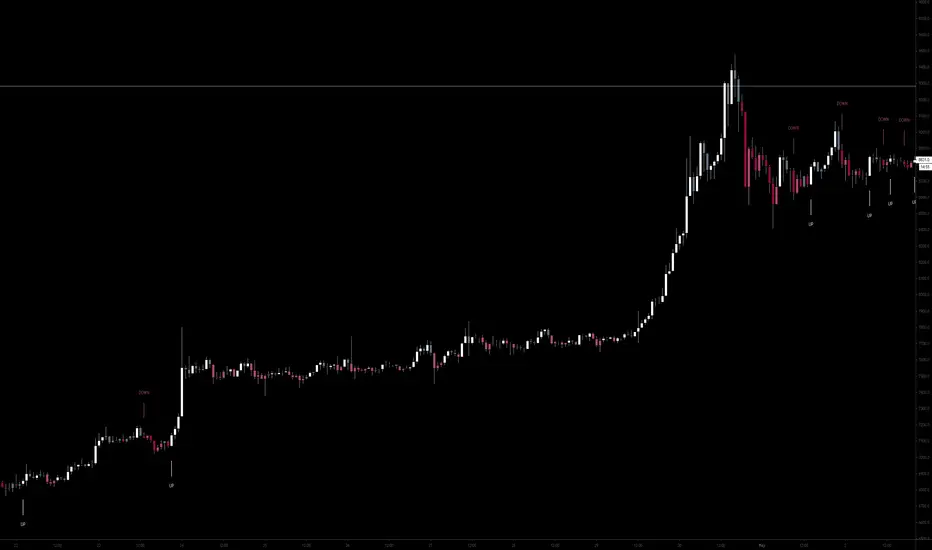
EXTREME REVERSAL SETUP:
This is by far my favorite setup in the lot. Classic Mean Reversion setup.
The logic, as explained in the book, goes like this,
1. The first bar of the pattern is about two times larger than the average size of the candles in the lookback period.
2. The body of the first bar of the pattern should encompass more than 50 percent of the bar’s total range, but usually not more than 85 percent.
3. The second bar of the pattern opposes the first.
The setup works extremely well in high beta stocks like Vedanta VEDL.
Feel free to play with the settings in order to better align this pattern with your favorite stock.
Check out the examples below,
No indicator is perfect, failed patterns are marked with an X.
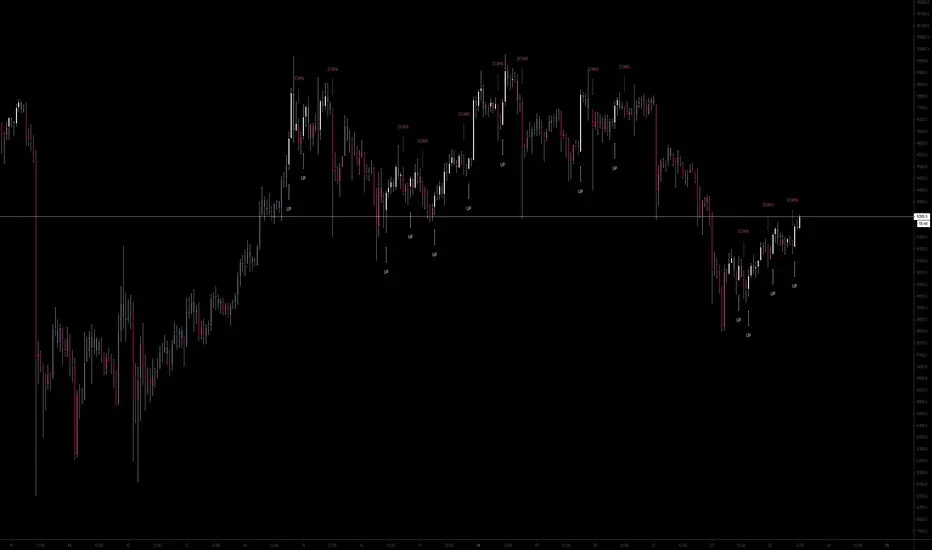
OUTSIDE REVERSAL SETUP:
My second favorite setup, it is quite good at catching intraday trends.
Here’s the logic,
1. The engulfing bar of a bullish outside reversal setup has a low that is below the prior bar’s low and a close that is above the prior bar’s high. Reverse the conditions for bearish outside reversal.
2. The engulfing bar is usually 5 to 25 percent larger than the size of the average bar in the lookback period.
Settings for this pattern simply reflect these conditions. Feel free to modify them as you wish.
The pattern is pretty powerful and will sometimes help you catch literally all the highs and lows of the market, as shown in the examples of Vedanta VEDL and RELIANCE stocks below.
As usual, this pattern is not PERFECT either.
DOJI REVERSAL SETUP:
Doji candles signify market indecision and this pattern tries to profit off these market conditions.
Logic:
1. The open and close price of the doji should fall within 10 percent of each other, as measured by the total range of the candlestick.
2. For a bullish doji, the high of the doji candlestick should be below the ten-period simple moving average. Vice-versa for bearish.
3. For a bullish doji setup, one of the two bars following the doji must close above the high of the doji. Vice-versa for bearish.
Feel free to modify the settings and optimize according to the stock you are trading.
Don't optimize too much :)
This pattern works brilliantly well on larger intraday timeframes, like 15m/30m/60m.
This pattern also has a higher propensity to give false indications than the two described above.
Doji reversal typically helps to catch larger trend reversals. Check out the examples below from RELIANCE and NIFTY charts,
Note that the RELIANCE chart below is the same as shown for the Outside Reversal Setup above, notice the confluence of Outside
Reversal and Doji Reversal on the 31st August.
Confluence of patterns usually increases the probability of success.
RELIANCE 15m Chart - Pattern can catch nice trends on higher timeframes
NIFTY 15m Chart
WICK REVERSAL SETUP:
This pattern tries to capture candlesticks with large wick sizes, as they often indicate trend reversal when coupled with significant support and resistance levels.
Logic:
1. The body is used to determine the size of the reversal wick. A wick that is between 2.5 to 3.5 times larger than the size of the body is ideal.
2. For a bullish reversal wick to exist, the close of the bar should fall within the top 35 percent of the overall range of the candle.
3. For a bearish reversal wick to exist, the close of the bar should fall within the bottom 35 percent of the overall range of the candle.
This pattern must always be coupled with important support resistance levels, else there will be a lot of false signals.
The chart below is the same NIFTY chart as above with the Wick Reversal candles marked as well.
You can see that there are a lot of false signals, but the price also indicates ’pausing’ at important levels by printing a wick reversal setup.
You can use this information to your advantage when riding a trend.
FINAL WORDS:
Settings for various patterns simply reflect the logic described.
You will probably need to tweak and optimize the pattern settings for the stock that you are trading.
Higher Beta/Higher Volatility stocks are a great choice for these patterns.
Using these patterns at critical support and resistance levels will result in dramatically high accuracy.
Be creative and try to develop a proper system around this indicator, with rules for position sizing, stop loss etc.
You do not have to trade all the patterns. Even trading just one pattern with a proper system is good enough.
DO NOT USE THIS INDICATOR AS A BUY/SELL SYSTEM, YOU WILL LOSE MONEY.
Feel free to drop any feedback in the comments section below, or if you have any unique candlestick patterns that you would like me to code.

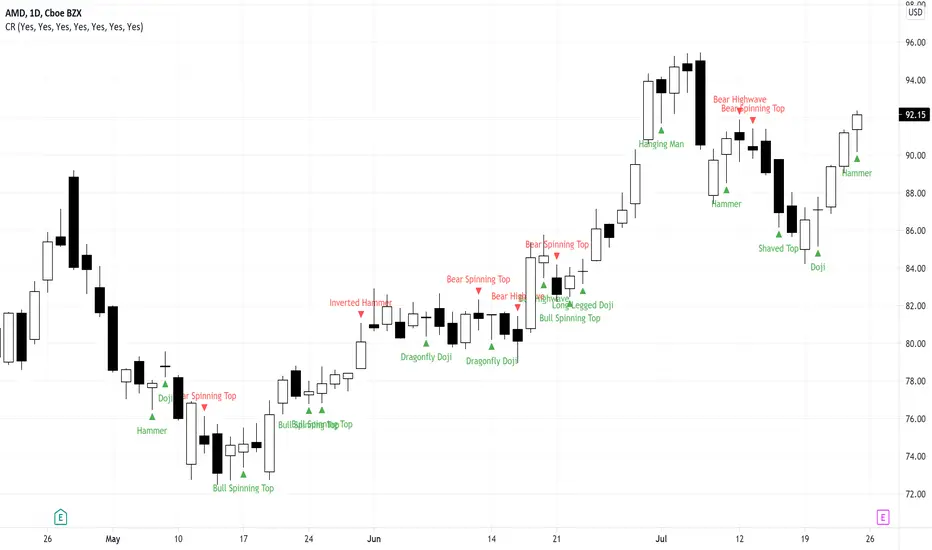
Candlestick RecognitionCandlestick Recognition
Version 1.0
Fun script to recognize and name candlesticks. Hamers and Highwaves and Marubozus oh my!
All candlestick names can be turned on or off in the settings since sometimes they stack close to each other and are hard to read. If you think I mislabeled any please provide me with an example of what you think it should be and I will review it to see if any changes need to be made. Please keep in mind that each stock will be a little different as the Candlestick Recognition uses ATR (Average True Range) for the calculations.
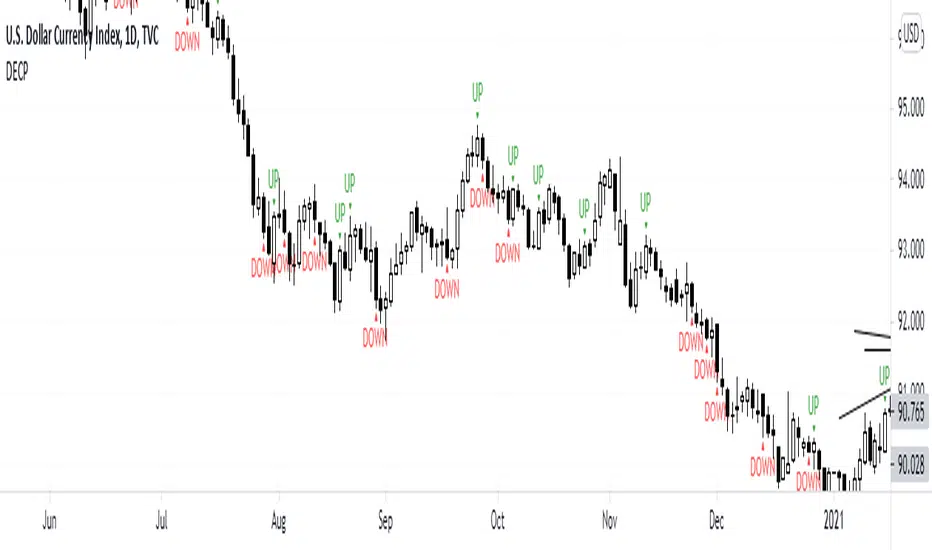
DECPDECP is simple and easy to use!
It detects bullish and bearish engulfing candlestick patterns.
After detecting the patterns I've said, it mentions that the pattern is going to continue its direction to up or down.
But remember candlestick patterns don't determine targets and it's possible that predicted directions fail.
So use it carefully and enjoy it!
MinichartsHello friends,
I'm happy to introduce this compact visualization tool that lets you display multiple mini candlestick charts directly on your main chart. It’s ideal for tracking several instruments at once, helping you compare assets, monitor relative performance, or build your own visual screener — all without leaving your chart.
🛠 How It Works
Each minichart represents a scaled-down candlestick chart of any ticker and timeframe you select. You can display up to 12 charts in a single instance and choose from multiple grid layouts — ranging from 1×1 to 6×2 . Each chart can show up to 20 candles, providing a concise yet information-rich view of price behavior. You can also overlay custom moving averages (SMA, EMA, WMA, or HMA) and display last price lines for better visual context.
🔥 Key Features
Pine Script V6 — optimized for performance and compatibility
Up to 12 charts per instance
16 layout options : 1×1, 1×2, 1×3, 1×4, 1×5, 1×6, 1×7, 1×8, 1×9, 1×10, 1×11, 1×12, 2×6, 3×4, 4×3, 6×2
Display up to 20 candles per chart
Supports 48 tickers through multiple instances
Choose between SMA, EMA, WMA, and HMA for overlayed moving averages
Optional last price line for each chart
Customizable chart labels
📸 Visual Examples
Merge of two instances (1×4 layout):
Example with three instances (3×4 layout):
If you'd like access or have any questions, feel free to reach out to me directly via DM.
👋 Good luck and happy trading!
Script pago

BoredWoreders GUIDED LIGHTSHello BoredWorkers here.
We've been on a journey to create the most perfectly simple indicator for newbies to profit NO MATTER WHAT and we're ending our journey successfully here soon.
So we will be releasing indicators, apart of or, that were a part of our journey.
The guided lights indicator is a favorite.
This indicator is simple. It displays the current power any candle you're currently watching. No matter the time frame. It only displays strong signals.
Example - You've jumped in a daily trade setup. While watching the daily candle the guided lights indicator will light up the colors of a traffic light.
The green light will display when the candle is in a strong up push.
The yellow light will display when the candle up push is weakening or is weak.
The yellow light will display when the candle down push is weakening or is weak.
The red light will display when the candle is in a strong down push.
- Arrows are added to the yellow lights to help you determine candle directions.
- If the light is lit and turns off. That only means its stop pushing but its not a reversal back to when it lit. New support or new resistance unless the colors say otherwise.
Have fun! We enjoyed it. Latch it directly under your chart. And watch the magic!
PS Unless you're more experienced don't trade during no light phase.

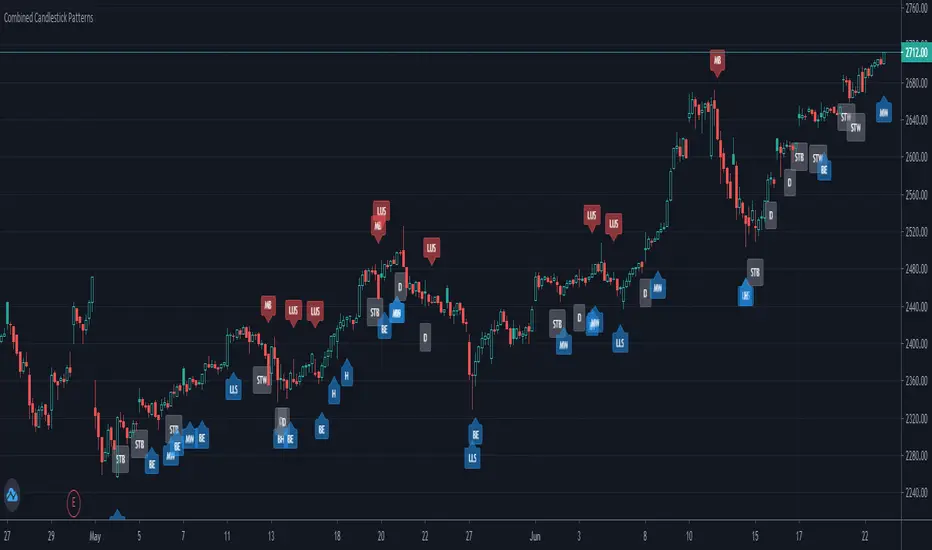
Combined Candlestick PatternsI combined all the build-in candlestick patterns scripts into one single script so anyone who does not have a Pro plan can display all the patterns in the same chart.
Leave a comment for any feedback!
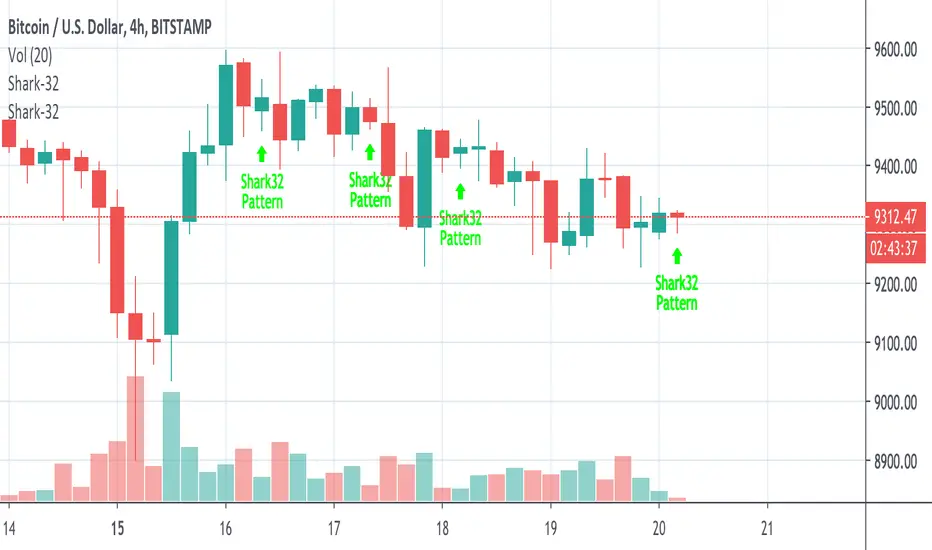
Shark-32 Pattern for Candle sticks AnalysisThis script is the perfect strategy for the all mighty shark-32 pattern.
It shows the power tussle between demand and supply before either of them finally gives up.
Dekidaka-Ashi - Candles And Volume Teaming Up (Again)The introduction of candlestick methods for market price data visualization might be one of the most important events in the history of technical analysis, as it totally changed the way to see a trading chart. Candlestick charts are extremely efficient, as they allow the trader to visualize the opening, high, low and closing price (OHLC) each at the same time, something impossible with a traditional line chart. Candlesticks are also cleaner than bars charts and make a more efficient use of space. Japanese peoples are always better than everyone at an incredible amount of stuff, look at what they made, the candlesticks/renko/kagi/heikin-ashi charts, the Ichimoku, manga, ecchi...
However classical candlesticks only include historical market price data, and won't include other type of data such as volume, which is considered by many investors a key information toward effective financial forecasting as volume is an indicator of trading activity. In order to tackle to this problem solutions where proposed, the most common one being to adapt the width of the candle based on the amount of volume, this method is the most commonly accepted one when it comes to visualizing both volume and OHLC data using candlesticks.
Now why proposing an additional tool for volume data visualization ? Because the classical width approach don't provide usable data regarding volume (as the width is directly related to the volume data). Therefore a new trading tool based on candlesticks that allow the trader to gain access to information about the volume is proposed. The approach is based on rescaling the volume directly to the price without the direct use of user settings. We will also see that this tool allow to create support and resistances as well as providing signals based on a breakout methodology.
Dekidaka-Ashi - Kakatte Koi Yo!
"Dekidaka" (出来高) mean "Volume" in a financial context, while "Ashi" (足) mean "leg" or "bar". In general methods based on candlesticks will have "Ashi" in their name.
Now that the name of the indicator has been explained lets see how it works, the indicator should be overlayed directly to a candlestick chart. The proposed method don't alter the shape of the candlesticks and allow to visualize any information given by the candles. As you can see on the figure below the candle body of the proposed tool only return the border of the candle, this allow to show the high/low wick of the candle.
The body size of the candle is based on two things : the absolute close/open difference, and the volume, if the absolute close/open difference is high and the volume is high then the body of the candle will be clearly visible, if the volume is high but the absolute close/open difference is low, then the body will be less visible. This approach is used because of the rescaling method used, the volume is divided by the sum between the current volume value and the precedent volume value, this rescale the volume in a (0,1) range, this result is multiplied by the absolute close/open difference and added/subtracted to the high/low price. The original approach was based on normalization using the rolling maximum, but this approach would have led to repainting.
You have access to certain settings that can help you obtain a better visualization, the first one being the body size setting, with higher values increasing the body amplitude.
In green body with size 2, in red with size 1. The smooth parameter will smooth the volume data before being used, this allow to create more visible bodies.
Here smooth = 100.
Making Bands From The Dekidaka-Ashi
This tool is made so it output two rescaled volume values, with the highest value being denoted as "Dekidaka-high" and the lowest one as "Dekidaka-low". In order to get bands we must use two moving averages, one using the Dekidaka-high as input and the other one using Dekidaka-low, the body size parameter should be fairly high, therefore i will hide the tool as it could cause trouble visualizing the bands.
Bands with both MA's of period 20 and the body size equal to 20. Larger periods of the MA's will require a larger amount of body size.
Breakout Signals
There is a wide variety of signals that can be made from candles, ones i personally like comes from the HA candles. The proposed tool is no exception and can produce a wide variety of signals. The signals generated are basic ones based on a breakout methodology, here is each signal with their associated label :
Strong Bullish signal "⇈" : The high price cross the Dekidaka-high and the closing price is greater than the opening price
Strong Bearish signal "⇊" : The low price cross the Dekidaka-low and the closing price is lower than the opening price
Weak Bullish signal "↑" : The high price cross the Dekidaka-high and the closing price is lower than the opening price
Weak Bearish signal "↓" : The low price cross the Dekidaka-low and the closing price is greater than the opening price
Uncertain "↕" : The high price cross the Dekidaka-high and the low price cross the the Dekidaka-low
In order to see the signals on the chart check the "Show signals" option. Note that such signals are not based on an advanced study, and even if they are based on a breakout methodology we can see that volatile movement rarely produce signals, therefore signals mostly occur during low volume/volatility periods, which isn't necessarily a great thing.
Conclusion
A trading tool based on candlesticks that aim to include volume information has been presented and a brief methodology has been introduced. A study of the signals generated is required, however i'am not confident at all on their accuracy, i could work on that in the future. We have also seen how to make bands from the tool.
Candlesticks remain a beautiful charting technique that can provide an enormous amount of information to the trader, and even if the accuracy of patterns based on candlesticks is subject to debates, we can all agree that candlesticks will remain the most widely used type of financial chart.
On a side note i mostly use a dark color for a bullish candle, and a light gray for a bearish candle, with the border color being of the same color as the bullish candle. This is in my opinion the best setup for a candlestick chart, as candles using the traditional green/red can kill the eyes and because this setup allow to apply a wide variety of colors to the plot of overlayed indicators without the fear of causing conflict with the candles color.
Thanks for reading ! :3 Nya
A Word
This morning i received some hateful messages on twitter, the users behind them certainly coming from tradingview, so lets be clear, i know i'am not the most liked person in this community, i know that perfectly, but no one merit to be receive hateful messages. I'am not responsible for the losses of peoples using my indicators, nor is tradingview, using technical indicators does not guarantee long term returns, your ability to be profitable will mostly be based on the quality and quantity of knowledge you have.

CandlestacksThis idea was originally from @midtownsk8rguy and since his code is proprietary and hidden I messed up with Pinescript to get exact same result.
To use this, make sure to disable wicks under Chart Properties:
-Right click chart > "Settings" > "Symbol" > Untick "Wicks"

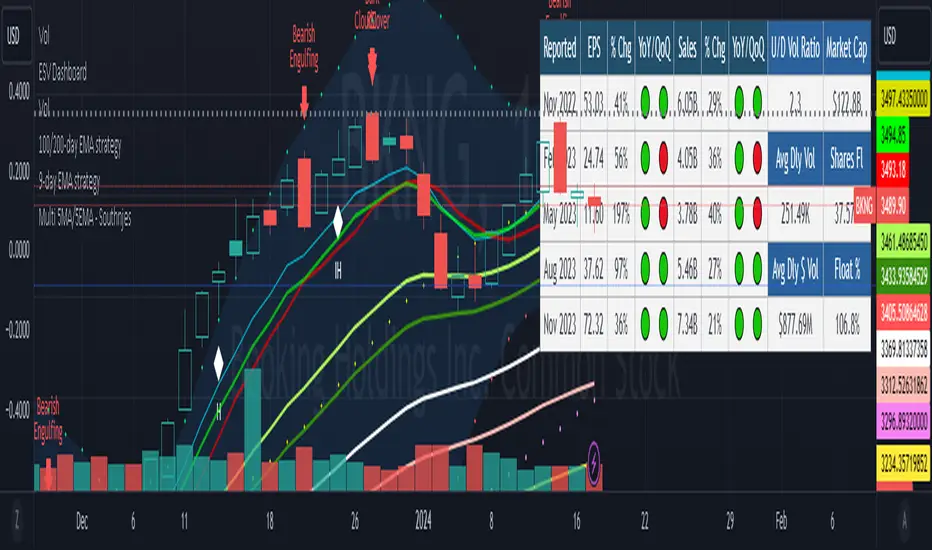
Cuban's Candle ColouringUsing a complex combination of bullish/bearish candle structure (such as engulfings and breakouts) and moving averages, this indicator attempts to illustrate weakness and strength within a trending market.
Included are labels that highlight important breaks of micro structure levels.
The beauty of this script lies in the discretionary trading of 'mid-candle' colour changes, giving the trader a simple micro structure bias.
The white ( bullish ) and dark red ( bearish ) colours are the higher confluence indications of candle structure breakout and breakdown, with the grey (semi-bullish) and pink (semi-bearish) showing trend weakness.
The Golden PivotsThe Golden Pivots indicator is a combination of the following:
1. Central Pivot Range
2. Floor Pivots
3. Camarilla Pivots
4. Monthly, Weekly, Daily Highs and lows
5. Candlestick Setups
All the pivot calculations are based on Secret of Pivot Boss book by Frank Ochoa.
One can also view tomorrow's central pivot range by today end of the day.

Cuban's Candle ColouringUsing a complex combination of bullish/bearish candle structure (such as engulfings and breakouts) and moving averages, this indicator attempts to illustrate weakness and strength within a trending market.
Included are labels that highlight important breaks of micro structure levels.
The beauty of this script lies in the discretionary trading of 'mid-candle' colour changes, giving the trader a simple micro structure bias.
The white (bullish) and dark red (bearish) colours are the higher confluence indications of candle structure breakout and breakdown, with the grey (semi-bullish) and pink (semi-bearish) showing trend weakness.
Relative Candle Volatility IndexI am not certain if something similar is already available out there. However, here's my own implementation of my simple idea of using the length of the candle-body, or wicks (high-low), to derive a Relative Volatility Index / Oscillator.
In summary: When the R.CVI is significantly positive, it indicates a sudden increase in volatility; whereas, when the R.CVI drops significantly negative, it indicates a sudden decrease in volatility -- in relative to the (just prior) market trend.
If you do wish to copy, modify, and publish an alternate version base on this script, please do not plagiarize and kindly reference/link back to this original script. =D
~ * ~ * ~ * ~ * ~ * ~ * ~ * ~ * ~ * ~ * ~ * ~ * ~ * ~ * ~ * ~ * ~ * ~ * ~ * ~ * ~
Note:
In no way is this intended as a financial/investment/trading advice. You are responsible for your own investment decisions and trades.
Please exercise your own judgement for your own trades base on your own risk-aversion level and goals as an investor or a trader. The use of OTHER indicators and analysis in conjunction (tailored to your own style of investing/trading) will help improve confidence of your analysis, for you to determine your own trade decisions.
~ * ~ * ~ * ~ * ~ * ~ * ~ * ~ * ~ * ~ * ~ * ~ * ~ * ~ * ~ * ~ * ~ * ~ * ~ * ~ * ~
Please check out my other indicators sets and series, e.g.
LIVIDITIUM (dynamic levels),
AEONDRIFT (multi-levels standard deviation bands),
FUSIONGAPS (MA based oscillators),
MAJESTIC (Momentum/Acceleration/Jerk Oscillators),
PRISM (pSAR based oscillator, with RSI/StochRSI as well as Momentum/Acceleration/Jerk indicators),
PDF (parabolic SAR /w HighLow Trends Indicator/Bar-color-marking + Dynamic Fib Retrace and Extension Level)
and more to come.
Constructive feedback and suggestions are welcome.
~ JuniAiko
(=^~^=)v~

Dark Cloud Cover Pattern Trading Setupthis study is another script based on the candlestick pattern . there are a few filters implemented to be applied to the output result to clear out noises. it sounds like finding real Dark Cloud Cover instances are too rare (interesting though!).
Dark Cloud Cover
it is a bearish reversal candlestick pattern where a down candle (typically bearish) opens above the close of the prior up candle (typically bullish) and then closes below the midpoint of the up candle. The five criteria for the Dark Cloud Cover pattern are:
An existing bullish uptrend.
An up (bullish) candle within that uptrend.
A gap up on the following day.
The gap up turns into a down (bearish) candle.
The bearish candle closes below the midpoint of the previous bullish candle.
all these criteria are implemented in code to produce a more accurate result.
please provide me with your valuable comments,
thanks for your attention,

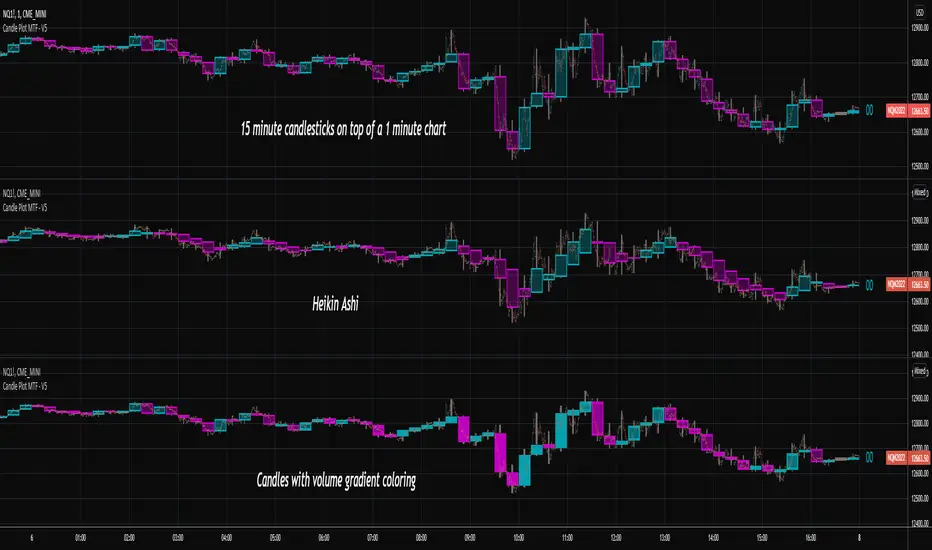
Candlestick Plot MTFPlots the live non-repainting candles for a higher time interval than the chart interval.
Features:
Configuration of the look and feel of the MTF candles.
Live candles update as the price action evolves for the session.
Historical candles can be toggled on/off.
Includes a moving average ribbon that is also MTF, matching the interval chosen.
Please watch this video to understand more:
Multi 5MA/5EMA with adjustable crossover - by SouthnjesHi guys and gals. This is the newer version that I have modified and revamped from the original code by NigglesSquiggles. (ok'd by the man himself). :)
Great for free members as you get all the MA's and EMA's you need on one indicator slot leaving 2 more slots for other desired indicators.
This indicator will give you 5 MA's along with 5 EMA's. Two of the MA's will allow you to change the input to the moving averages you want. Then it will give you a crossover bar on the chart for easy viewing of a cross up or a cross down using a fast MA and slow MA. You have the option to use exponential values with a single click and also have the option to have your preset candle confirmation however many candles after the crossings that you would like (original code).
Hope it helps and you find it useful.
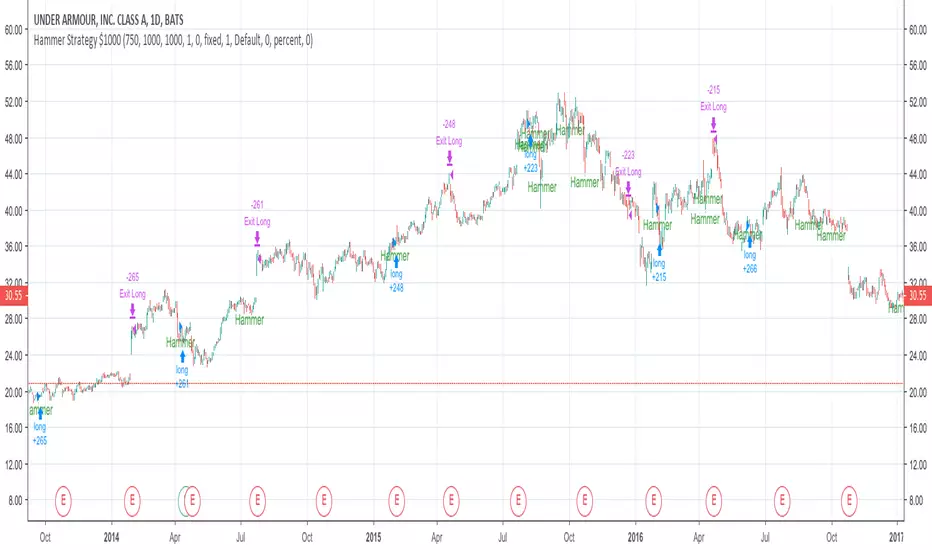
Candlestick Signals StrategyThis strategy allows you to pick from 9 different candlestick patterns, and test them against historical data from your chart. You can get a good idea what patterns work best for each chart by turning each pattern on and off in the settings.

Basic Hammer StrategyThis is a basic strategy that will buy after a hammer is printed, and sell when a predetermined risk or reward price is hit. You can change the risk and reward values in the settings. Risk and reward values are in increments of $0.01. Default values are 75 ($0.75) and 200 ($2.00). If the strategy is producing losses, try adding a zero to the end of the risk value and the reward value. Example: Higher valued stocks may do better with a Risk of 750 ($7.50) and a Reward of 2000 ($20.00). Maybe even a Risk of 750 ($7.50) and reward of 1000 ($10.00). Play around with these values to get the best result for different charts. Initial investment is set to $1000
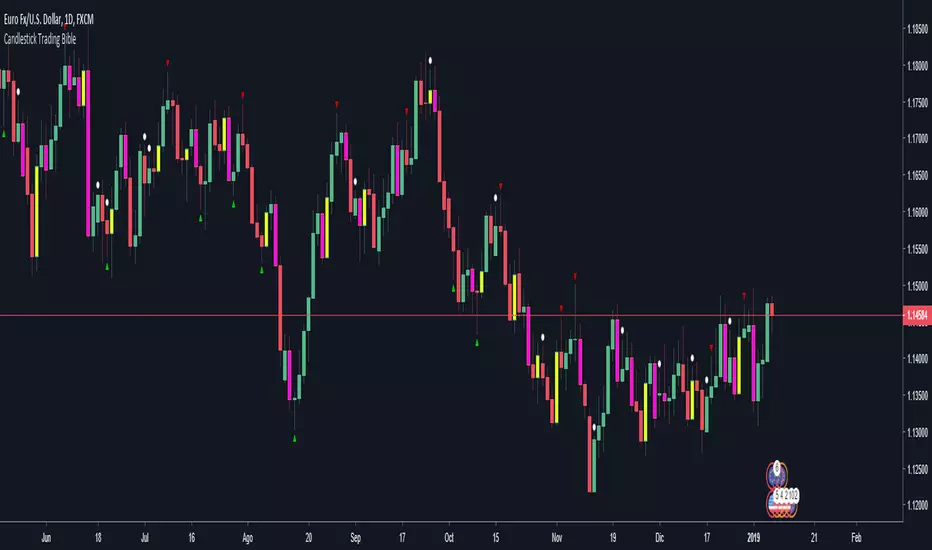
Candlestick Trading Bible pack: Engulfing + Pin bar + Inside barHelpful indicator that overlays the price with colors and arrows for understanding easily engulfing, pin bar and inside bar formations as seen in the book "The Candlestick Trading Bible" IG of writer: @price.action.strategies
How it works:
-Bullish engulfing: yellow
-Bearish engulfing: fuchsia
-Pin bars: up/down green/red arrows
-Inside bars: white circle above the inside candle
----------
I do not have any relationship with the writer or the book mentioned above. The explanations in it may differ from what is drawn on the graph.
Candlestick ScannerThis is a large compilation of candlestick patterns that allows the user to detect up to 42 different bullish and bearish patterns.
This script is intended to be a Pine Editor version of the one I normally used on a different platform, so your feedback is more than welcome to help me improve it, as fine tuning is ongoing.
New patterns will be added in the next couple of days.
Happy trading!

Engulfing Candle IndicatorThis script shows you where a candle is either bullish or bearish engulfing the previous candle.
A GREEN triangle below the bar pointing UP indicates that the candle is BULLISH engulfing the previous candle
A RED triangle ABOVE the bar pointing DOWN indicates that the candle is BEARISH engulfing the previous candle
