Reversal Candlestick PatternsReversal Candlestick Patterns
Reversal Candlestick Patterns is an indicator designed to detect classic candlestick reversal patterns with additional market context filtering.
The indicator identifies ten well-known reversal candlestick patterns and displays them directly on the chart as visual blocks. Each pattern is detected using its own logic, based on candle structure, position relative to local extremes, and the direction of the current trend.
Bullish patterns:
> Bullish Engulfing
> Morning Star
> Hammer
> Inverted Hammer
> Three White Soldiers
Bearish patterns:
> Bearish Engulfing
> Evening Star
> Hanging Man
> Shooting Star
> Three Black Crows
Pattern configuration
Detection of each individual pattern, its short name displayed on the chart, and the color of the highlighting block can be configured separately in the first two settings groups:
Bullish Patterns and Bearish Patterns .
This allows you to fully customize which patterns are used, how they are labeled, and how they are visually represented.
Trend filtering
The indicator includes an optional trend filter based on two Simple Moving Averages.
It is enabled using the Check Trend setting. The Trend Detection Length parameter is used simultaneously for several calculations:
> Length of the fast moving average
> Half of the slow moving average length
> Number of consecutive bars required to confirm trend direction
This approach helps filter out reversal patterns that form against a well-established trend.
External filters
The indicator supports external confirmation filters for bullish and bearish patterns. External filter settings are located in the External Filters group. For each filter, you can specify the value of an external indicator that must be met for a pattern to be confirmed. This allows flexible integration with oscillators, volume-based indicators, or custom scripts.
Visualization settings
Visualization settings control:
> Pattern name display
> Text size
> Block fill transparency
These settings affect only the visual presentation and do not influence the detection logic.
Alerts
The indicator provides two types of alerts:
1. Global alert for any detected pattern. Created by selecting “Any alert() function call” when setting up an alert.
2. Dedicated alert conditions for:
> Each individual pattern
> Any bullish pattern
> Any bearish pattern
Please note: if detection of a specific pattern is disabled in the settings, alerts for that pattern will not trigger.
Important note
Candlestick patterns should not be used as standalone trading signals. This indicator is intended to be used as part of a broader analysis, together with trend structure, key levels, volume, and other analytical tools.
Candlestickpattern

3SPC Three Candle Price Action Setup3SPC (Three Candle Price Action Setup) is an open-source indicator designed to detect
a simple and clearly defined three-candle price action pattern.
The logic is based on the following structure:
• The first two candles move in the same direction (bullish or bearish).
• The third candle interacts with the real bodies of both previous candles,
which may indicate a short-term liquidity sweep or price reaction.
• A bullish setup is confirmed when price holds above the open of the first candle.
• A bearish setup is confirmed when price holds below the open of the first candle.
This script does not use oscillators or lagging indicators.
It is intended as a visual aid for discretionary traders and should be used
together with market context, risk management and higher timeframe analysis.
The script is published as open-source for educational and transparency purposes.
UI Labels Translation:
- نمایش ستاپ صعودی: Show bullish setups
- نمایش ستاپ نزولی: Show bearish setups

SNP420/TRCS_MASTERMicro Body Candle Highlighter is a visual tool for TradingView that continuously scans the active timeframe and highlights all candles with an extremely small body.
For every bar (including the currently forming one), the indicator compares the absolute distance between Open and Close to a user-defined threshold in ticks (default: 1 tick, based on syminfo.mintick).
If the candle’s body size is less than or equal to this threshold, the indicator draws a red frame around the candle – either around the body only or the full high-to-low range, depending on user settings.
Optionally, the indicator can also trigger alerts whenever such a “micro body” candle is detected, allowing traders to react immediately to potential indecision, pauses, or micro-reversals in price action.
author: SNP_420
project: FNXS
ps: Piece and love

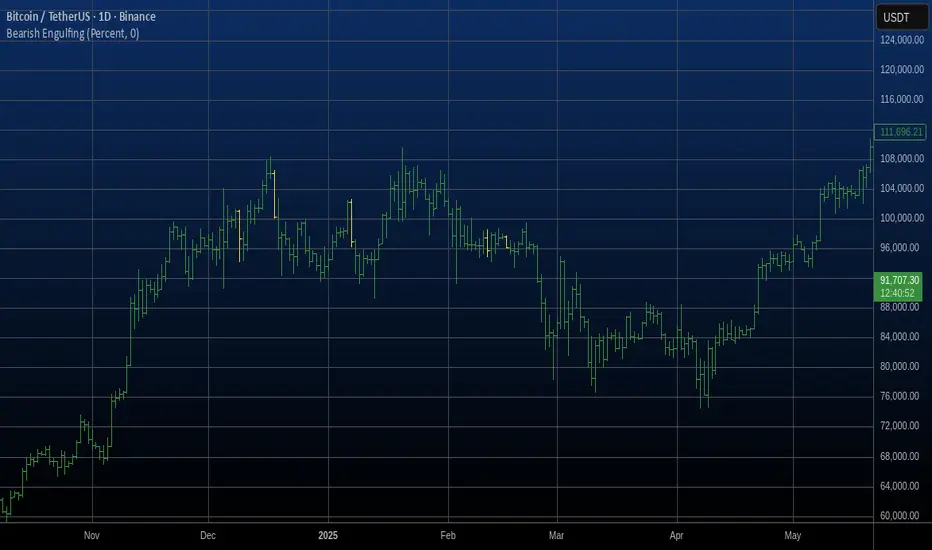
Bearish Engulfing Automatic Finding Script This is a bearish pattern formed by three candlesticks.
The pattern is based on the fact that the last candlestick must
completely engulf the previous two and be downward. The two preceding
candlesticks must also be upward. Candlestick wicks are not taken
into account.
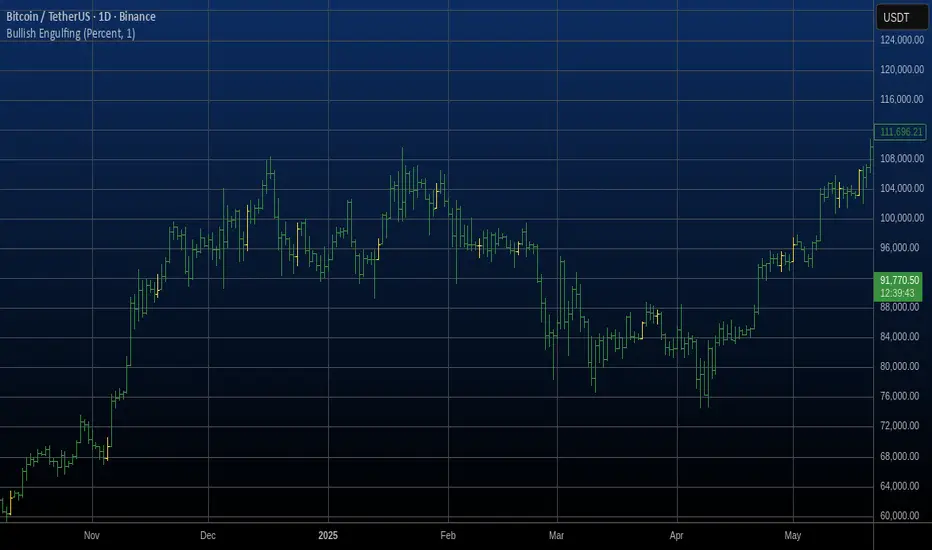
Bullish Engulfing Automatic Finding Script This is a bullish pattern formed by three candlesticks.
The pattern is based on the fact that the last candlestick must
completely engulf the previous two and be upward. The two preceding
candlesticks must also be downward. Candlestick wicks are not taken
into account.
HTF Control Shift + Prev Candle Break Sequence 🧭 HTF Control Shift + Previous Candle Break Sequence
Overview
The HTF Control Shift + Previous Candle Break Sequence indicator identifies high-probability shift candles that suggest a potential change in market control — from sellers to buyers or vice versa — and then tracks whether price confirms that shift by breaking the previous candle’s high or low.
This tool is designed to help traders detect institutional control shifts and confirm them with price structure breaks, providing a framework for spotting early trend reversals or strong continuation moves.
How It Works
Control Shift Candle Detection
A Bullish Control Shift occurs when a candle shows:
A long lower wick (≥ Wick % Threshold of total range).
A close near the high (within Body % Threshold of the top).
A Bearish Control Shift occurs when a candle shows:
A long upper wick (≥ Wick % Threshold of total range).
A close near the low (within Body % Threshold of the bottom).
These candles are highlighted in green (bullish) or red (bearish), and optionally labeled on the chart.
Previous Candle High/Low Tracking
The script automatically plots horizontal lines at the previous candle’s high (green) and low (red).
These act as key reference levels for breakout confirmation.
Breakout Confirmation Sequence
A Bullish Sequence triggers when a Bullish Control Shift candle is followed by a break above the previous candle’s high.
A Bearish Sequence triggers when a Bearish Control Shift candle is followed by a break below the previous candle’s low.
When either sequence completes, the indicator can send a TradingView alert confirming the directional breakout.
How to Use
Timeframe:
Optimized for higher timeframes (1H, 4H, Daily) to filter out intraday noise and identify structural market shifts.
Trend Reversal Identification:
Watch for Control Shift candles at major highs/lows, order blocks, or liquidity zones — a confirmed breakout often signals a trend reversal or new directional push.
Continuation Confirmation:
In trending markets, a Control Shift candle that breaks in the direction of trend can validate a strong continuation setup.
Alert Usage:
Set alerts for:
Bullish Control Shift Confirmed Breakout
Bearish Control Shift Confirmed Breakdown
Optional: raw Control Shift or Break alerts.
Customization
Wick % Threshold: Adjusts the required wick size to define a control shift.
Body % Threshold: Controls how close the close must be to the high/low for confirmation.
Label Toggle: Optionally display labels only on control shift candles.
Best Practices
Combine with higher-timeframe trend filters.
Avoid using it alone in tight consolidation zones.
Strongest signals occur when:
Control Shift appears at key structure levels.
The breakout bar closes firmly beyond the previous high/low.
Volume supports the breakout.
Summary
✅ Detects when market control flips (buyers ↔ sellers).
✅ Confirms shift with breakout above/below previous candle.
✅ Ideal for 1H–4H swing or position trading.
✅ Provides visual, structural, and alert-based confirmation.

Cycle-Synced Channel Breakout📌 Cycle-Synced Channel Breakout – Detect Breakouts Confirmed by Candles and Momentum Cycles
📖 Overview
The Cycle-Synced Channel Breakout indicator is a precision breakout detection tool that combines the power of:
• Adaptive Keltner Channels
• Dominant Cycle Period Analysis (Ehlers-inspired)
• Candlestick Pattern Recognition (Engulfing)
This multi-layered approach helps identify true breakout opportunities by filtering out noise and false signals, making it ideal for swing traders and intraday traders seeking high-probability directional moves.
⚙️ How It Works
1. Keltner Channel Envelope
A dynamic volatility channel based on the EMA and ATR defines the upper and lower bounds of price movement.
2. Engulfing Candle Detection
The script detects strong bullish and bearish engulfing patterns, which often signal trend reversals or momentum continuations.
3. Dominant Cycle Momentum (Ehlers-inspired)
Using a smoothed power oscillator derived from a detrended price series, the indicator assesses whether momentum is accelerating during the breakout — filtering out weak moves.
4. Signal Confirmation Logic
A signal is only shown when:
• An engulfing pattern is detected, and
• Price breaks out of the Keltner Channel, and
• Momentum (cycle power) is rising
5. Visual Feedback
• Breakout signals are plotted with “BUY” or “SELL” labels
• Faded green/red background highlights confirmed breakouts
• Optional display of engulfing candles with triangle markers
⸻
🛠️ Key Features
• ✅ Adaptive Keltner Channels
• ✅ Bullish/Bearish Engulfing Candle Recognition
• ✅ Ehlers-style Cycle Momentum Confirmation
• ✅ Background highlights for confirmed breakouts
• ✅ Optional candle pattern visualization
• ✅ Lightweight and Pine v6 compatible
⸻
🧪 Inputs
• Keltner Length – EMA period for channel basis
• Multiplier – Multiplied with ATR to determine band width
• Cycle Lookback – Used to calculate smoothed cycle power
• Show Engulfing Candles? – Toggles candlestick signals
• Show Breakout Signals? – Toggles breakout labels and backgrounds
⸻
🧠 How to Use
• Look for “BUY” or “SELL” labels when:
• An engulfing candle breaks through the Keltner Channel
• Cycle momentum confirms strength behind the move
• The background color will faintly highlight the breakout direction.
• Use in combination with other trend or volume indicators for added confluence.
🔒 Notes
• This indicator is not repainting.
• It is designed for educational and research purposes only.
• Works across all timeframes and asset classes (stocks, crypto, forex, etc.)

CFR - Candle Formation RatioDescription
This indicator is designed to detect candles with small bodies and significant wick-to-body ratios, often useful for identifying doji-like structures and potential accumulation areas.
Features
Filter candles by maximum body size (% of the total candle range).
Require that wicks are at least X times larger than the body.
Define the position of the body within the candle (e.g., body must be between 40% and 60% of the candle height).
Visual output: a single arrow marker when conditions are met.
Fully customizable marker color and size.
⚠️ Note: The settings of this version are currently in Turkish. An English version of the settings will be released in the future.

CNagda Anchor2EntryCNagda Anchor2Entry Pine Script v6 overlay indicator pulls higher-timeframe (HTF) signal events to define anchor high/low levels and then projects visual entry labels on the lower-timeframe (LTF). It also draws auto-oriented Fibonacci retracement/extension levels for context, but it does not execute orders, stops, or targets—only visual guidance.
Inputs
Key inputs include Lookback Length for HTF scanning and a Signal Timeframe used with request.security to import HTF events onto the active chart.
Entry behavior can be set to “Confirm only” or “Wait candle,” trade side can be restricted to Buy/Sell/Both, and individual strategies (Buy WAIT/S1; Sell REV/S1/S2/S3) can be toggled.
HTF logic
The script defines WAIT/BUY setup and confirmation, SELL reversal on breaking the WAIT BUY low, and several volume/candle-based patterns (Sell S1/S2/S3, Buy S1).
It captures the associated highs/lows at those events with ta.valuewhen and imports them via request.security to form anchors (anc_hi/anc_lo) and “new trigger” booleans that gate label creation on the LTF.
Flip entries
When enabled, “Flip entries” generate contrarian labels based on breaking or confirming HTF anchors: crossing above anc_hi can trigger a flip-to-sell label, and crossing below anc_lo can trigger a flip-to-buy label.
The flip mode supports Immediate (on cross) or Confirm (on sustained break) to control how strict the trigger is.
Fibonacci drawing
User-specified Fib levels are parsed from a string, safely converted to floats, and drawn as dotted horizontal lines only when they fall inside an approximate visible viewport. Orientation (up or down) is decided automatically from pending signal direction and a simple context score (candle bias, trend, and price vs. mid), with efficient redraw/clear guards to avoid clutter.
Dynamic anchors
If HTF anchors are missing or too far from current price (checked with an ATR-based threshold), the script falls back to local swing highs/lows to keep the reference range relevant. This dynamic switch helps Fib levels and labels remain close to current market structure without manual intervention.
Signal labels
Labels are created only on confirmed bars to avoid repainting noise, with one “latest” label kept by deleting the previous one. The script places BUY/SELL labels for WAIT/CONFIRM, direct HTF patterns (Buy S1, Sell S1/S2/S3), and contrarian flip events, offset slightly from highs/lows with clear coloring and configurable sizes.
Visual context
Bars are softly colored (lime tint for bullish, orange tint for bearish) for quick context, and everything renders as an overlay on the price chart. Fib labels include a Δ readout (distance from current close), and line extension length, label sizes, and viewport padding are adjustable.
How to use
Set the Signal Timeframe and Lookback Length to establish which HTF structures and ranges will drive the anchors and entry conditions. Choose entry flow (Wait vs Confirm), enable Flip if contrarian triggers are desired, select the trade side, toggle strategies, and customize Fibonacci levels plus dynamic-anchor fallback for practical on-chart guidance.
Notes
This is a visual decision-support tool; it does not place trades, stops, or targets and should be validated on charts before live use. It is written for Pine Script v6 and relies heavily on request.security for HTF-to-LTF transfer of signals and anchors.

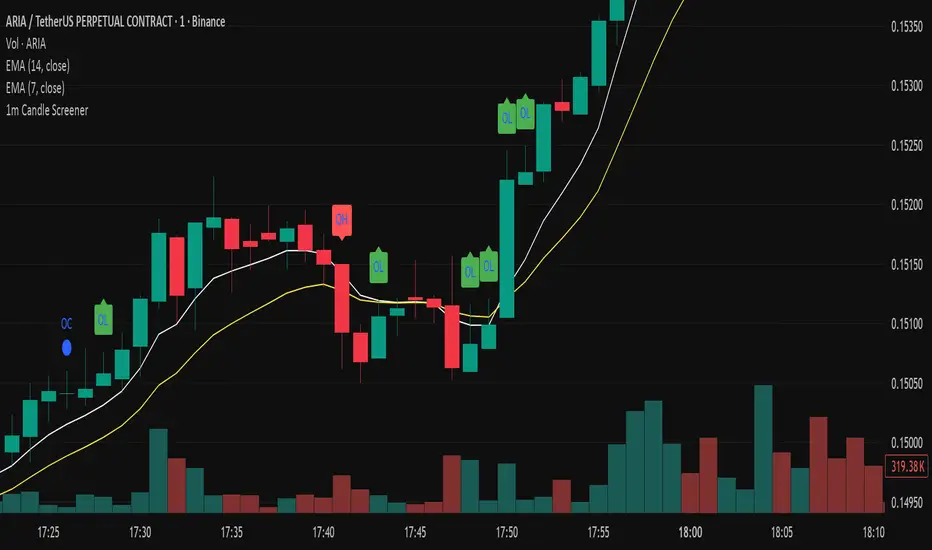
Precision Candle Marker – OL/OH/OC ScreenerThis indicator highlights high-probability precision candles on any perpetual contract, designed especially for scalpers and short-term traders.
It marks three unique candle setups on the 1-minute chart (works on other timeframes too):
🟢 Open = Low (OL) → Strong bullish momentum, buyers took control instantly.
🔴 Open = High (OH) → Strong bearish momentum, sellers took control instantly.
🔵 Open = Close (OC) → Doji / indecision candle, potential reversal or continuation signal.
Use cases:
Identify breakout entry points in uptrend/downtrend.
Filter noise and focus on precision candles.
Combine with trend indicators (EMA, VWAP, RSI) for confirmation.
This tool is best suited for scalping perpetual contracts (e.g., BTCUSDT, ETHUSDT) but works on any symbol and timeframe.
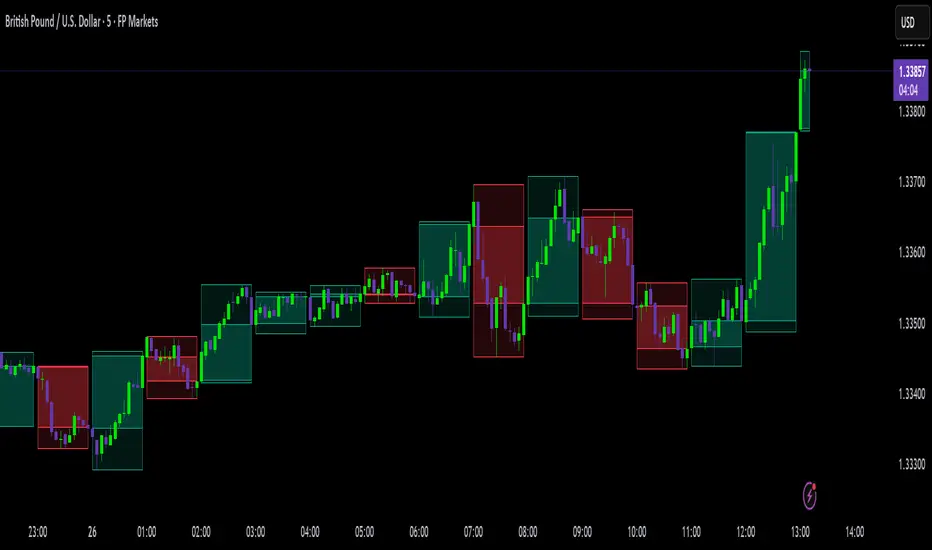
Intraday Buy/Sell/Average Zones by Chaitu50cIntraday Buy/Sell/Average Zones by chaitu50c
Timeframe:
Tested on the 5-minute chart.
Recommended timeframe: 5-minute
What it does
This indicator marks intraday Buy (green) and Sell (red) zones made by strong close-confirmed breakouts. These zones act as support/resistance. If price later closes through a zone, the zone changes color from that bar forward (support ↔ resistance). It can flip more than once.
How zones form
Single breakout: an opposite-type candle closes beyond the previous candle’s high/low.
Double breakout: a base candle, then two opposite-type candles, and the second one closes beyond the base high/low.
Zone size
Buy zone: from the combo lowest low up to the nearest open/close of the combo.
Sell zone: from the combo highest high down to the nearest open/close of the combo.
Color shift (optional)
If price closes through a zone, it flips color at that bar and behaves as the other side (support ↔ resistance). Flips can happen again later.
Overlap control
When a new zone overlaps an existing same-color zone in the same session, choose:
Merge (combine), or
Suppress (ignore the new one).
Flipped zones use their current color for this.
Right edge & session
All zones extend to the right (your offset). Detection is limited to your chosen session, and you can show only the last N sessions.
---
How to trade (simple)
A) Initial breakout trade
When a new zone forms, that breakout itself can be a trade idea in the breakout direction, The stoploss will be the zone.
B) Zone breakout trade (flip)
If price later closes out of a zone and it changes color, that breakout is another trade opportunity in the new direction.
C) Retrace & average trade
When price retests a zone, wait for a confirmation candle in the zone’s favor
— bullish close for a green zone, bearish close for a red zone — then average entries inside/near the zone.
Place stops just beyond the opposite edge of the zone.
If the zone flips color, stop averaging; bias changed.
---
Key settings
Breakout type: Single and/or Double
Confirm on Close: strict mode (no intrabar preview) or allow intrabar preview that auto-removes if fail
Color Shift on Breaks: on/off
Same-Type Overlap: Merge/Suppress
Session, Sessions to Display, Right Offset, Colors, Max Zones
Reminder: Best results on the 5-minute timeframe (tested and recommended).

Rally Base Drop Signals [LuxAlgo]The Rally Base Drop indicator is built around the Supply and Demand (SND) concept known as "Rally, Base & Drop" Candles. These candle types are commonly used in this trading approach to identify price structure.
This indicator highlights bars by labeling them as "Rally," "Drop," or "Base" candles. It also identifies specific sequence patterns formed by these candles.
🔶 USAGE
The Rally, Base, Drop candlestick approach is a straightforward method for identifying price action structure.
Candles are categorized into three types, which are then analyzed to understand market structure and Supply/Demand levels.
Rally: Two or more consecutive bullish candles.
Drop: Two or more consecutive bearish candles.
Base: A single bullish or bearish candle that breaks the previous trend.
🔹 Rally & Drop Candles
These candles show clear directional momentum and signal whether demand or supply is dominating. They are helpful when identifying trends, as they highlight strong price movement.
🔹 Base Candles
In most SND strategies, "Base" can have several interpretations.
Typically, base candles represent short periods of consolidation that test the trend before continuation. They can also be found at turning points (tops or bottoms).
For this indicator, a base candle is simply one that does not follow the direction of nearby candles or is where a Drop and Rally meet. Multiple base candles often reflect indecision in the market, suggesting a temporary balance between buyers and sellers.
🔹 Reversal Sequences
Rally-Base-Drop (RBD)
Drop-Base-Rally (DBR)
In Supply and Demand analysis, these sequences are considered reversals. They mark zones where buyer and seller activity has shifted, which can lead to future price reactions. These areas are known as "Supply or Demand Zones" and are often revisited by price, making them useful for trade setups.
🔹 Continuation Sequences
Rally-Base-Rally (RBR)
Drop-Base-Drop (DBD)
Continuation sequences show a brief pause in the trend, followed by further movement in the same direction. In SND terms, they represent zones where orders accumulate before a continuation move. These are typically used to join ongoing trends, as they indicate sustained interest from buyers or sellers.
🔶 DETAILS
🔹 Color Modes
The script includes three color modes. "No Color" is self-explanatory, while the other two options relate to how candles are detected.
A Rally or Drop requires at least two candles to be successfully identified. As a result, detection occurs on the second candle. However, the full Rally or Drop includes both candles.
Two coloring methods are available:
Full Color: Once a Rally or Drop is detected (on the second bar), both candles are colored, starting from the first. This reflects the full pattern.
Color on Detection: Only the second candle (where detection occurs) is colored. This avoids changing past bars and may be useful for live analysis.
🔶 SETTINGS
Sequences: Select which sequences to display on the chart.
Bar Color Logic: Choose the preferred bar coloring method.

Balanced Big Wicks (50/50) HighlighterThis open-source indicator highlights candles with balanced long wicks (50/50 style)—that is, candles where both upper and lower shadows are each at least 30–60% of the full range and within ~8% of each other, while retaining a substantial body. This specific structure often reflects indecision or liquidity sweeps and can precede strong breakout moves.
How It Works (Inputs and Logic)
Min wick % (each side): 30–60% of candle range
Max body %: up to 60% of range (preserves strong body presence)
Equality tolerance: wicks within 8% of each other
ATR filter (multiples of ATR14): ensures only significant-range candles are flagged
When a “50/50” candle forms, it’s visually colored and labeled; audibly alertable.
How to Use It
Long setup: price closes above the wick-high → potential long entry (SL below wick-low, TP = 1:1).
Short setup: price closes below wick-low → potential short entry (SL above wick-high, TP = 1:1).
Especially effective on 5–15 minute scalping charts when aligned with high-volume sessions or HTF trend context.
Why This Indicator Is Unique
Unlike standard wick or doji voters, this script specifically filters for candles with a strong body and symmetrical wicks, paired with a range filter, reducing noise significantly.
Important Notes
No unrealistic claims: backtested setups indicate high occurrence of clean breakouts, though performance depends on market structure.
Script built responsibly: uses real-time calculations only, no future-data lookahead.
Visuals on the published chart reflect default input values exactly.

Follow-up Buy / Sell Volume Pressure at Supply / Demand Zones█ Overview:
BE-Volume Footprint & Pressure Candles, is an indicator which is preliminarily designed to analyze the supply and demand patterns based on Rally Base Rally (RBR), Drop Base Drop (DBD), Drop Base Rally (DBR) & Rally Base Drop (RBD) concepts in conjunction to volume pressure. Understanding these concepts are crucial. Let's break down why the "Base" is you Best friend in this context.
Commonness in RBR, DBD, DBR, RBD patterns ?
There is an impulse price movement at first, be it rally (price moving up) or the Drop (price moving down), followed by a period of consolidation which is referred as "BASE" and later with another impulse move of price (Rally or Drop).
Why is the Base Important
1. Market Balance: Base represents a balance between buyers and sellers. This is where decisions are made.
2. Confirmation: It confirms the strength of previous impulse move which has happened.
Base & the Liquidity Play:
Supply & Demand Zone predict the presence of all large orders within the limits of the Base Zone. Price is expected to return to the zone to fill the unfilled orders placed by large players.
For the price to move in the intended direction Liquidity plays the major role. hence indicator aims to help traders in identifying those zones where liquidity exists and the volume pressure helps in confirming that liquidity is making its play.
Bottom pane in the below snapshots is a visual representation of Buyers volume pressure (Green Line & the Green filled area) making the price move upwards vs Sellers volume pressure (Red Line & the Red filled area) making the price move downwards.
Top pane in the below snapshots is a visual representation on the pattern identification (Blue marked zone & the Blue line referred as Liquidity level)
Bullish Pressure On Buy Liquidity:
Bearish Pressure On Sell Liquidity:
█ How It Works:
1. Indicator computes technical & mathematical operations such as ATR, delta of Highs & Lows of the candle and Candle ranges to identify the patterns and marks the liquidity lines accordingly.
2. Indicator then waits for price to return to the liquidity levels and checks if Directional volume pressure to flow-in while the prices hover near the Liquidity zones.
3. Once the Volume pressure is evident, loop in to the ride.
█ When It wont Work:
When there no sufficient Liquidity or sustained Opposite volume pressure, trades are expected to fail.
█ Limitations:
Works only on the scripts which has volume info. Relays on LTF candles to determine intra-bar volumes. Hence, Use on TF greater than 1 min and lesser than 15 min.
█ Indicator Features:
1. StrictEntries: employs' tighter rules (rather most significant setups) on the directional volume pressure applied for the price to move. If unchecked, liberal rules applied on the directional volume pressure leading to more setups being identified.
2. Setup Confirmation period: Indicates Waiting period to analyze the directional volume pressure. Early (lesser wait period) is Risky and Late (longer wait period) is too late for the
ride. Find the quant based on the accuracy of the setup provided in the bottom right table.
3. Algo Enabled with Place Holders:
Indicator is equipped with algo alerts, supported with necessary placeholders to trade any instrument like stock, options etc.
Accepted PlaceHolders (Case Sensitive!!)
1. {{ticker}}-->InstrumentName
2. {{datetime}}-->Date & Time Of Order Placement
3. {{close}}-->LTP Price of Script
4. {{TD}}-->Current Level:
Note: Negative Numbers for Short Setup
5. {{EN}} {{SL}} {{TGT}} {{T1}} {{T2}} --> Trade Levels
6. {{Qty}} {{Qty*x}} --> Qty -> Trade Qty mapped in Settings. Replace x with actual number of your choice for the multiplier
7. {{BS}}-->Based on the Direction of Trade Output shall be with B or S (B == Long Trade & S == Short Trade)
8. {{BUYSELL}}-->Based on the Direction of Trade Output shall be with BUY or SELL (BUY == Long Trade & SELL == Short Trade)
9. {{IBUYSELL}}-->Based on the Direction of Trade Output shall be with BUY or SELL (BUY == SHORT Trade & SELL == LONG Trade)
Dynamic Alerts:
10. { {100R0} }-->Dynamic Place Holder 100 Refers to Strike Difference and Zero refers to ATM
11. { {100R-1} }-->Dynamic Place Holder 100 Refers to Strike Difference and -1 refers to
ATM - 100 strike
12. { {50R2} }-->Dynamic Place Holder 50 Refers to Strike Difference and 2 refers to
ATM + (2 * 50 = 100) strike
13. { {"ddMMyy", 0} }-->Dynamically Picks today date in the specified format.
14. { {"ddMMyy", n} }-->replace n with actual number of your choice to Pick date post today date in the specified format.
15. { {"ddMMyy", "MON"} }-->dynamically pick Monday date (coming Monday, if today is not Monday)
Note. for the 2nd Param-->you can choose to specify either Number OR any letter from =>
16. {{CEPE}} {{ICEPE}} {{CP}} {{ICP}} -> Dynamic Option Side CE or C refers to Calls and PE or P refers to Puts. If "I" is used in PlaceHolder text, On long entries PUTs shall be used
Indicator is equipped with customizable Trade & Risk management settings like multiple Take profit levels, Trailing SL.

Inside Candle DivergenceStudy Material: Inside Candle Divergence Indicator (aiTrendview)
1. Introduction
The Inside Candle Divergence Indicator is a custom tool built on TradingView using Pine Script. It is designed to help traders identify potential reversal points or trend continuations using a mix of candlestick analysis, RSI (Relative Strength Index), VWAP (Volume Weighted Average Price), Pivot Points, and Volume analytics. The tool also provides a dashboard table on the chart, summarizing all key values in a single glance for traders and analysts.
This indicator is not just a signal generator but also an educational framework—explaining how different concepts in technical analysis combine to build a systematic approach for market entries and exits.
________________________________________
2. Core Concepts Behind the Tool
A. Inside Candle Pattern
An Inside Candle forms when the current candle’s high is lower than or equal to the previous candle’s high, and the low is higher than or equal to the previous candle’s low.
• This means the entire price action of the current candle is "inside" the range of the previous candle.
• A bullish inside candle occurs when the close is higher than the open.
• A bearish inside candle occurs when the close is lower than the open.
This pattern shows market indecision but also sets up potential breakouts or trend reversals.
________________________________________
B. RSI (Relative Strength Index)
The indicator calculates RSI using the formula from the ta.rsi() function in TradingView. RSI helps measure momentum in the market.
• A low RSI (below 25) signals an oversold zone → possible buy.
• A high RSI (above 75) signals an overbought zone → possible sell.
By combining RSI with the Inside Candle, the indicator ensures that signals are triggered only when momentum and price patterns confirm each other.
________________________________________
C. Buy & Sell Signals
• Buy Signal: Triggered when RSI < Buy Level (default 25) and a bullish inside candle forms.
• Sell Signal: Triggered when RSI > Sell Level (default 75) and a bearish inside candle forms.
When triggered, the chart displays a BUY (green label below candle) or SELL (red label above candle) marker. The indicator also saves the entry price and signal bar for future reference inside the dashboard.
________________________________________
D. VWAP (Volume Weighted Average Price)
VWAP is calculated using the typical price (H+L+C)/3 and weighting it by volume.
• VWAP shows the average trading price weighted by volume, widely used by institutions.
• The tool calculates the distance of price from VWAP in % terms.
• If price is far above VWAP, the market may be overheated (overbought). If far below, it may be undervalued (oversold).
________________________________________
E. Volume Analysis
The tool splits volume into Buy Volume and Sell Volume:
• Buy Volume: If close > open.
• Sell Volume: If close ≤ open.
• Cumulative totals are maintained, and percentages are calculated to show what proportion of total market volume is bullish vs bearish.
• A progress bar style visual (using blocks █) shows the dominance of buyers or sellers.
This allows traders to quickly measure whether buyers or sellers are controlling the market trend.
________________________________________
F. Daily Pivot Points
Pivot Points are calculated using the previous day’s high, low, and close:
• Pivot = (High + Low + Close) / 3
• R1, S1, R2, S2, R3, S3 levels are derived from this pivot.
• These levels act as support and resistance zones.
The script plots Pivot, R1, and S1 lines on the chart for easy reference.
________________________________________
G. Trend Direction
The indicator checks where the price is compared to R1 and S1:
• If price > R1 → Bullish Trend
• If price < S1 → Bearish Trend
• Otherwise → Neutral Trend
The trend direction is displayed in the dashboard with arrows (↑, ↓, →).
________________________________________
H. Price Change Calculation
The tool calculates:
• Price Change = Current Close – Previous Close
• Percentage Change = (Change / Previous Close) × 100
• Displays ▲ (green upward) or ▼ (red downward) with the exact percentage.
This gives traders a quick snapshot of intraday price movement.
________________________________________
I. Dashboard Table
One of the most powerful features is the real-time dashboard table shown on the chart. It contains:
1. Symbol & Price Info (Current ticker, price, change %)
2. RSI Reading (with color coding: green for oversold, red for overbought)
3. VWAP and Distance from VWAP
4. Volume Analysis with Progress Bar (Buy vs Sell %)
5. Pivot Levels (Pivot, R1, S1)
6. Trend Direction (Bullish, Bearish, Neutral)
7. Signal Status (Last Buy/Sell signal with entry price)
This reduces the need for multiple indicators and gives traders a command-center view directly on the chart.
________________________________________
J. Alerts
The tool generates alerts whenever a Buy or Sell condition is met. Traders can set up TradingView alerts to be notified instantly when:
• Buy Signal Alert → RSI oversold + Bullish inside candle
• Sell Signal Alert → RSI overbought + Bearish inside candle
This ensures no opportunity is missed even if you’re not actively monitoring the chart.
________________________________________
K. Background Highlights
The chart background also changes faintly (light green or light red) when a Buy or Sell condition is triggered. This gives traders visual confirmation along with signals and alerts.
________________________________________
3. Practical Use of This Tool
• Scalpers & Intraday Traders can use it for quick momentum-based entries.
• Swing Traders can use the RSI + Inside Candle + Pivot Points to find medium-term reversals.
• Analysts can use the dashboard for real-time summaries in reports.
• Volume Analysis helps understand institutional activity.
Remember: This is not a standalone holy grail. It must be used with proper risk management and confirmation from higher timeframes.
________________________________________
4. Strict Disclaimer (aiTrendview)
⚠️ Disclaimer from aiTrendview:
This indicator is designed for educational and analytical purposes only. It is not financial advice or a guaranteed trading strategy. Markets are inherently risky and unpredictable; past performance of indicators does not ensure future results. Trading involves risk of financial loss, and traders must use proper risk management, stop-loss, and independent judgment.
aiTrendview strictly follows TradingView.com rules and compliance guidelines.
Any misuse of this tool, its code, or analytical features for unauthorized commercial purposes, false promises, or misleading activities is strictly discouraged. The creators of this script and aiTrendview will not be responsible for any losses, damages, or misuse arising from its application. Always trade responsibly and only with money you can afford to lose.
________________________________________

High Timeframe Candle Overlay (Configurable)HTF Candle Overlay — Read Higher Timeframe on Lower Timeframe Charts
What it does
This indicator draws each selected Higher-Timeframe (HTF) candle directly on your lower-timeframe (LTF) chart. It shows a translucent range box (HTF high–low) and an inner body box (HTF open–close), so you can track how the bigger candle is forming while you analyze lower-timeframe structure, liquidity sweeps, and intrabar reactions.
Why it’s helpful
• See where the current HTF candle opened, where price sits inside its body, and how far wicks extend—without leaving your LTF chart.
• Combine HTF context (e.g., 1H/4H) with LTF execution (e.g., 1m–15m) to spot confluence, S/R flips, and failed breaks faster.
• The overlay is locked to the price scale and anchored by bar index, so it pans/zooms exactly with your chart (no drifting while dragging).
⸻
How it works (under the hood)
• Fetches HTF OHLC via request.security.
• When a new HTF bar starts, the previous HTF boxes are frozen at the true close.
• The current HTF bar updates intrabar (so you see live formation) and is clamped to the correct span.
• Horizontal anchoring uses bar index, and a hidden price plot binds the script to the main price scale for stable zoom/pan behavior.
⸻
Inputs
• High Timeframe (HTF): Default 1H (set any TF you like).
• Show High–Low Box: On/off.
• Show Body Box (Open–Close): On/off.
• Opacity for range/body boxes.
• Bull/Bear Colors and Outline + Width.
• Max HTF Candles to Keep: Auto-deletes older boxes to maintain performance.
⸻
Usage tips
• Popular combos: view 1H or 4H candles while trading 1–15m charts.
• Turn off the range box if you only want a clean HTF body overlay.
• Pair with your session/structure tools; this indicator is visual context only (no signals or alerts).
⸻
Notes & limitations
• Non-repainting for closed HTF bars: once an HTF candle closes, its boxes are fixed. The current/in-progress HTF bar updates until it closes (expected live behavior).
• Data alignment depends on your symbol’s feed and session settings. Heikin Ashi/renko/etc. may not match classic OHLC.
• Heavy history + many boxes can affect performance; reduce “Max HTF Candles to Keep” if needed.
⸻
Disclaimer
This script is for education and charting visualization only. It does not provide financial advice, trade signals, or performance guarantees. Always do your own research and manage risk.
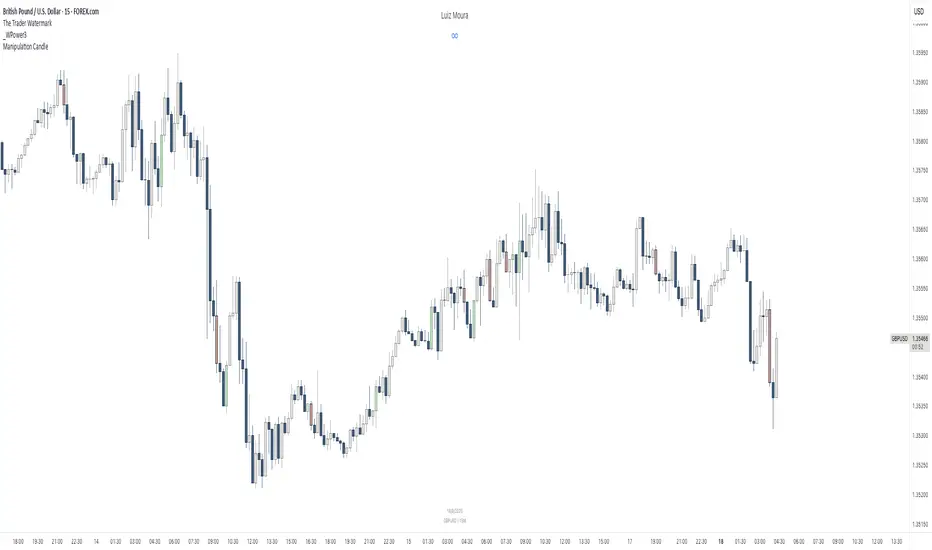
[RealEdgeFX] - Manipulation CandleOverview
The Manipulation Candle indicator highlights potential liquidity grabs and false breakouts directly on the chart. It focuses on moments when price sweeps prior highs or lows but closes in the opposite direction, suggesting a possible manipulation before a market reversal.
Core Logic
The indicator compares the current candle against the previous one and colors the bar when specific conditions are met:
Sell Manipulation (dark red)
When the current candle breaks above the previous high but then closes below the prior low.
→ This often signals a stop hunt to the upside followed by bearish intent.
Buy Manipulation (light green)
When the current candle breaks below the previous low but then closes above the prior high.
→ This suggests a liquidity sweep to the downside before bullish continuation.
Neutral candles remain uncolored to avoid clutter and keep the focus on high-impact moments.
Design Approach
Clarity: Only the candles that meet strict criteria are marked, reducing noise.
Liquidity Focused : Built for traders who want to quickly spot manipulative price action.
Non-Repainting : Once a candle is identified as manipulation, the color stays fixed.
Usage
Add it as an overlay on your chart.
Watch for green or red manipulation candles as alerts of possible reversals or liquidity events.
Combine with your own market structure or bias tools to increase accuracy.
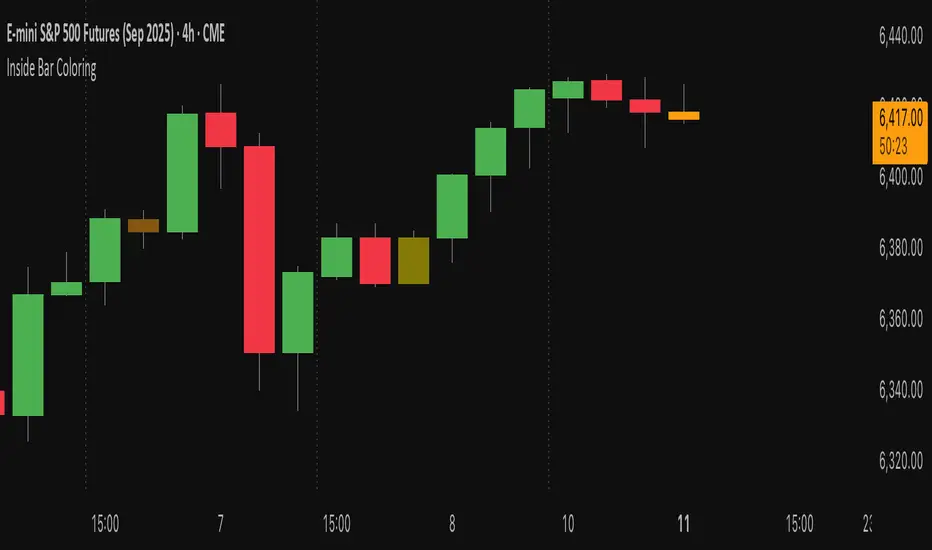
Inside Bar Coloring (Real-time + Historical) w/ AlertsDescription
This Pine Script v6 indicator identifies and colors inside bars, whose entire range (high and low) stays within the previous bar's range. It gives the option to color the real-time bar as well as historical inside bars.
Inside bars are colored differently based on whether they close above or below their opening price (bullish vs bearish). The indicator offers flexible display options including real-time-only highlighting, historical inside bar visualization with transparency, and optional triangle markers for enhanced visibility.
Utility
Inside bars represent periods of market consolidation and reduced volatility, and are by nature consolidating. During this equilibrium, it can be valuable to observe price development rather than engage with it. Conversely, a break of the equilibrium often marks a shift in volatility and provides opportunity. This indicator provides instant visual identification of this price action on your chart.
Features
Smart Coloring System: Separate colors for bullish (close ≥ open) and bearish (close < open) inside bars
Flexible Display Modes: Show only real-time bar, all historical bars, or customize transparency levels
Visual Markers: Optional triangles above or below inside bars
Real-time Alerts: Configurable alerts notify you when new inside bars form
Optimized Performance: Efficient Pine Script v6 code with minimal resource usage
Open Source: Released under Mozilla Public License 2.0
Settings
Customizable colors for bullish/bearish inside bars (real-time and historical)
Toggle historical inside bar display
Real-time bar only mode for clean charts
Adjustable marker position (above/below bars)
Alert activation with detailed price information
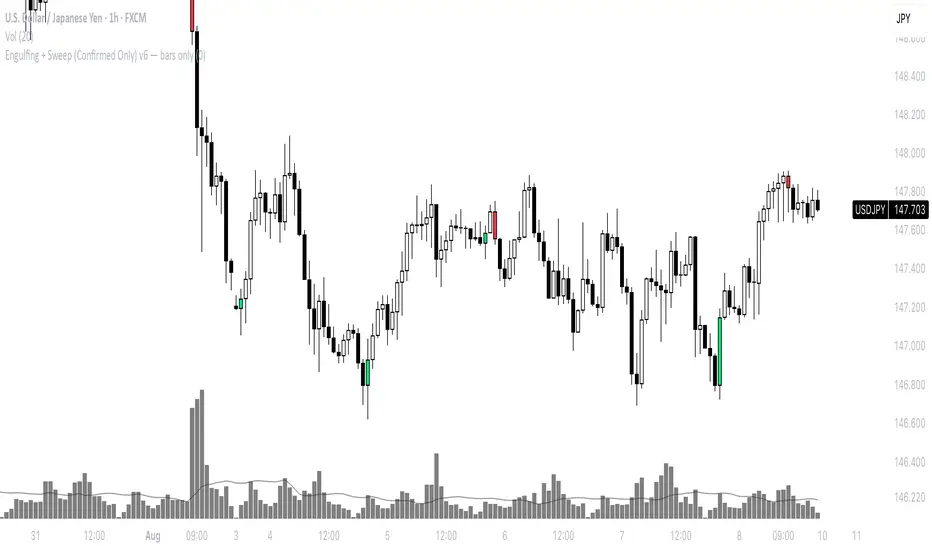
Engulfing + Sweep (Confirmed Only) v6 — bars onlyMarks bullish/bearish engulfing candles with liquidity sweeps and confirms them on the next candle — no repaint.
✳️ Features:
• 🟩 Bullish Engulfing + Low Sweep
• 🟥 Bearish Engulfing + High Sweep
• 🎛 Require opposite-color previous candle (optional)
• 📏 Min body-to-range filter
• 🔔 Alerts on confirmation candle
🎯 Best for:
• Price action & reversal traders
• Liquidity sweep confluence setups
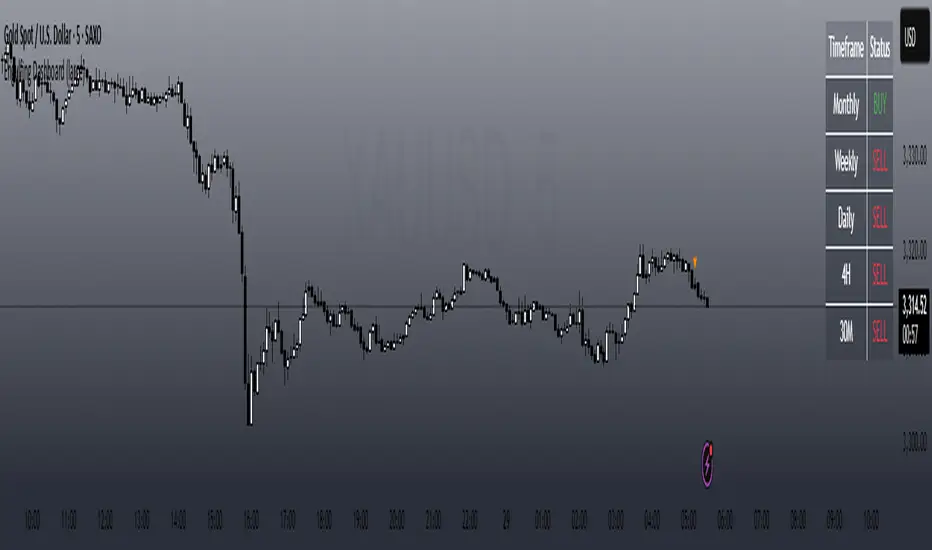
Silver BulletSilver Bullet is a trading tool built for finding cleaner, higher-probability setups. It focuses on key windows of market movement and adds helpful tools like daily range levels and candlestick patterns.
Whether you’re trading breakouts or reversals, Silver Bullet gives you a clearer view of the market and more confidence in your setups.
⸻
🔹 Trading Setup #1: Macro Time
The Macro Time setting offers two modes: Macro Bullet and Silver Bullet. Both help traders focus on specific times when the market tends to deliver clean moves.
• Macro Bullet is based on the high and low of a full macro session. It automatically detects the session’s range and bias, then offers optimal entries for either Long or Short setups. Once the session resolves, it provides Fibonacci-based levels for entry, target, and stop loss.
• Silver Bullet is based on ICT concepts and focuses on the hourly range for London, NY AM, and NY PM sessions. It’s designed for quick time blocks and highlights key levels as the session unfolds.
To use this setup, set Macro Time to “ICT Sessions” and select your preferred mode under Bullet Mode.
⸻
🔹 Trading Setup #2: Daily Range
Enable Daily Range to draw Fibonacci levels based on either the previous day’s candle or the current day’s developing range. These levels help you identify potential support, resistance, and midpoint zones throughout the day.
With the current day’s range, levels automatically update in real time as new highs or lows form — keeping your chart aligned with evolving price action.
⸻
🔹 Trading Setup #3: Candlestick Patterns
Turn on Candlestick Patterns to automatically highlight clean reversal signals such as Hammers, Hanging Men, Shooting Stars, and Tweezers. Each pattern is detected using specific criteria and trend filters to reduce noise and improve reliability. They work especially well as confirmation signals around key levels or session zones.
Silver Bullet brings structure, clarity, and precision to your intraday trading. By combining time-based bias, price action levels, and pattern recognition, it helps you trade with purpose — not guesswork. Use one setup or combine all three for a complete view of the market, tailored to your style and session of choice.

Internal Pivot Pattern [LuxAlgo]The Internal Pivot Pattern indicator is a novel method allowing traders to detect pivots without excessive delay on the chart timeframe, by using the lower timeframe data from a candle.
It features custom colors for candles and zigzag lines to help identify trends. A dashboard showing the accuracy of the pattern is also included.
🔶 USAGE
We define a pivot as the occurrence where the middle candle over a specific interval (for example, the most recent 21 bars) is the highest (pivot high) or the lowest (pivot low). This method commonly allows for identifying swing highs/lows on a trader's chart; however, this pattern can only be identified after a specific number of bars has been formed, rendering this pattern useless for real-time detection of swing highs/lows.
This indicator uses a different approach, removing the need to wait for candles to form on the user chart; instead, we check the lower timeframe data of the current candle and evaluate for the presence of a pivot given the internal data, effectively providing pivot confirmation at the candle close.
An internal pivot low pattern is indicative of a potential uptrend, while an internal pivot high is indicative of a potential downtrend.
Candles are colored based on the last internal pivot detected, with blue candle colors indicating that the most recent internal pivot is a pivot low, indicating an uptrend, while an orange candle color indicates that the most recent internal pivot is a pivot high, indicating a downtrend.
🔹 Timeframes
The timeframe setting allows controlling the amount of lower timeframe data to consider for the internal pivot detection. This setting must be lower than the user's chart timeframe.
Using a timeframe significantly lower than the user chart timeframe will evaluate a larger amount of data for the pivot detection, making it less frequent, while using a timeframe closer to the chart timeframe can make the internal pivot detection more frequent, and more prone to false positives.
🔹 Accuracy Dashboard
The Accuracy Dashboard allows evaluating how accurate the detected patterns are as a percentage, with a pattern being judged accurate if subsequent patterns are detected higher or lower than a previous one.
For example, an internal pivot low is judged accurate if the following internal pivot is higher than it, indicating that higher highs have been made.
This dashboard can be useful to determine the timeframe setting to maximize the respective internal pivot accuracy.
🔶 SETTINGS
Timeframe: Timeframe for detecting internal swings
Accuracy Dashboard: Enable or disable the Accuracy Dashboard.
🔹 Style
Internal Pivot High: Color of the dot displayed upon the detection of an internal pivot high
Internal Pivot Low: Color of the dot displayed upon the detection of an internal pivot low
Zig-Zag: Color of the zig-zag segments connecting each internal pivot
Candles: Enable candle coloring, with control over the color of the candles highlighting the detected trend

Engulfing DashboardThis is an indicator that detects candles based on the **Engulfing system** I’ve studied — from **wick to wick**.
It determines whether it’s a Buy or Sell based on the **opening price** and how the candle moves.
Anyone familiar with the Engulfing system will know how to use it.
It’s especially useful for people who use only **one screen** and can’t constantly monitor multiple timeframes.
And don’t forget:
**Trend is your friend.**
Candle Ghosts: MTF 3 Candle Viewer by Chaitu50cCandle Ghosts: MTF 3 Candle Viewer helps you see candles from other timeframes directly on your chart. It shows the last 3 candles from a selected timeframe as semi-transparent boxes, so you can compare different timeframes without switching charts.
You can choose to view candles from 30-minute, 1-hour, 4-hour, daily, or weekly timeframes. The candles are drawn with their full open, high, low, and close values, including the wicks, so you get a clear view of their actual shape and size.
The indicator lets you adjust the position of the candles using horizontal and vertical offset settings. You can also control the spacing between the candles for better visibility.
An optional EMA (Exponential Moving Average) from the selected timeframe is also included to help you understand the overall trend direction.
This tool is useful for:
Intraday traders who want to see higher timeframe candles for better decisions
Swing traders checking lower timeframe setups
Anyone doing top-down analysis using multiple timeframes on a single chart
This is a simple and visual way to study how candles from different timeframes behave together in one place.
