Doji-creatorsFinds doji and its breakout. It'll find the doji, detect the breakout and alert the user. Also will tell the possible reward based of rr ratio.
Análise de Candles
MTF Market Structure Highs and LowsThe indicator marks the last fractal highs and lows (W,D,4H and 1H options) to help determine current market structure. The script was created to help with directional bias but also as a MTF visual aid for stop hunts/liquidity raids.
Liquidity areas are where we assume trader's stop losses would be when buying or selling. Liquidity lies above and below swing points and institutions need liquidity to fill large orders.
Monitor price action as it hits these areas for a potential reversal trade.

Sessions with High/Low DiffThe main purpose of this indicator is to facilitate backtesting, but it may also be useful for traders to easily identify the current
active/open trading sessions on lower-timeframe charts.
This indicator also tracks the session high/low difference and plots it as a label on the last candle of the session once the last
bar of that session has finished printing and a new candle opened. The position and direction of the label is based on the
session open and close - if the session open is greater than the session close (which would equate to the equivalent of a red candle),
the label will be printed UNDER the last candle, and vice versa if the session close is above the session open.
The number printed inside the label is the difference between the session high and the session low, scaled to the minimum tick value of the chart.
Note #1: There is a Pinescript maximum of 500 labels allowed on any chart. While I could have gotten fancy and done some wizardry with label arrays,
I didn't really see a point to it. If labels are enabled for all 4 sessions at the same time, that would still have them available for the past 125
sessions, which would be about 6 months (approx 252 trading days per year, and this would cover 125 of them). If you limit to 2 sessions, you double
your potential look-back to almost a year (250 days out of the 252 average trading days each year), and for a single session, you double it yet again
to just under 2 years.
Note #2: As this indicator tracks open, high, low, and close for each session, it can potentially be enhanced (or forked) to construct "session candles".
I'm not sure what use this would be to anyone, but the pieces are there should someone find a use for it.
While it would be easy to add alerts on sessions opening/closing, I didn't see a purpose or value in that as it would be little more than a
glorified alarm clock. If I get enough demand to add them, I will gladly consider it.

Synthetic Price Action GeneratorNOTICE:
First thing you need to know, it "DOES NOT" reflect the price of the ticker you will load it on. THIS IS NOT AN INDICATOR FOR TRADING! It's a developer tool solely generating random values that look exactly like the fractals we observe every single day. This script's generated candles are as fake as the never ending garbage news cycles we are often force fed and expected to believe by using carefully scripted narratives peddled as hypnotic truth to psychologically and emotionally influence you to the point of control by coercion and subjugation. I wanted to make the script's synthetic nature very clear using that analogy, it's dynamically artificial. Do not accidentally become disillusioned by this scripts values, make trading decisions from it, and lastly don't become victim to predatory media magic ministry parrots with pretty, handsome smiles, compelling you to board their ferris wheel of fear. Now, on to the good stuff...
BACKSTORY:
Occasionally I find myself in situations where I have to build analyzers in Pine to actually build novel quantitative analytic indicators and tools worthy of future use. These analyzers certainly don't exist on this platform, but usually are required to engineer and tweak algorithms of the highest quality with the finest computational caliber. I have numerous other synthesizers to publish besides this one.
For many reasons, I needed a synthetic environment to utilize the analyzers I built in Pine, to even pursue building some exotic indicators and algorithms. Pine doesn't allow sourcing of tuples. Not to mention, I required numerous Pine advancements to make long held dreams into tangible realities. Many Pine upgrades have arrived and MANY, MANY more are in need of implementation for all. Now that I have this, intending to use it in the future often when in need, you can now use it too. I do anticipate some skilled Pine poets will employ this intended handy utility to design and/or improved indicators for trading.
ORIGIN:
This was inspired by the brilliance from the world renowned ALGOmist John F. Ehlers, but it's taken on a completely alien form from its original DNA. Browsing on the internet for something else, I came across an article with a small code snippet, and I remembered an old wish of mine. I have long known that by flipping back and forth on specific tickers and timeframes in my Watchlist is not the most efficient way to evaluate indicators in multiple theatres of price action. I realized, I always wanted to possess and use this sort of tool, so... I put it into Pine form, but now have decided to inject it with Pine Script steroids. The outcome is highly mutable candle formations in a reusable mutagenic package, observable above and masquerading as genuine looking price candles.
OVERVIEW:
I guess you could call it a price action synthesizer, but I entitled it "Synthetic Price Action Generator" for those who may be searching for such a thing. You may find this more useful on the All or 5Y charts initially to witness indication from beginning (barstate.isfirst === barindex==0) to end (last_bar_index), but you may also use keyboard shortcuts + + to view the earliest plottable bars on any timeframe. I often use that keyboard shortcut to qualify an indicator through the entirety of it's runtime.
A lot can go wrong unexpectedly with indicator initialization, and you will never know it if you don't inspect it. Many recursively endowed Infinite Impulse Response (IIR) Filters can initialize with unintended results that minutely ring in slightly erroneous fashion for the entire runtime, beginning to end, causing deviations from "what should of been..." values with false signals. Looking closely at spg(), you will recognize that 3 EMAs are employed to manage and maintain randomness of CLOSE, HIGH, and LOW. In fact, any indicator's barindex==0 initialization can be inspected with the keyboard shortcuts above. If you see anything obviously strange in an authors indicator, please contact the developer if possible and respectfully notify them.
PURPOSE:
The primary intended application of this script, is to offer developers from advanced to even novice skill levels assistance with building next generation indicators. Mostly, it's purpose is for testing and troubleshooting indicators AND evaluating how they perform in a "manageable" randomized environment. Some times indicators flake out on rare but problematic price fluctuations, and this may help you with finding your issues/errata sooner than later. While the candles upon initial loading look pristine, by tweaking it to the minval/maxval parameters limits OR beyond with a few code modifications, you can generate unusual volatility, for instance... huge wicks. Limits of minval= and maxval= of are by default set to a comfort zone of operation. Massive wicks or candle bodies will undoubtedly affect your indication and often render them useless on tickers that exhibit that behavior, like WGMCF intraday currently.
Copy/paste boundaries are provided for relevant insertion into another script. Paste placement should happen at the very top of a script. Note that by overwriting the close, open, high, etc... values, your compiler will give you generous warnings of "variable shadowing" in abundance, but this is an expected part of applying it to your novel script, no worries. plotcandle() can be copied over too and enabled/disabled in Settings->Style. Always remember to fully remove this scripts' code and those assignments properly before actual trading use of your script occurs, AND specifically when publishing. The entirety of this provided code should never, never exist in a published indicator.
OTHER INTENTIONS:
Even though these are 100% synthetic generated price points, you will notice ALL of the fractal pseudo-patterns that commonly exist in the markets, are naturally occurring with this generator too. You can also swiftly immerse yourself in pattern recognition exercises with increased efficiency in real time by clicking any SPAG Setting in focus and then using the up/down arrow keys. I hope I explained potential uses adequately...
On a personal note, the existence of fractal symmetry often makes me wonder, do we truly live in a totality chaotic universe or is it ordered mathematically for some outcomes to a certain extent. I think both. My observations, it's a pre-deterministic reality completely influenced by infinitesimal amounts of sentient free will with unimaginable existing and emerging quantities. Some how an unknown mysterious mechanism governing the totality of universal physics and mathematics counts this 100.0% flawlessly and perpetually. Anyways, you can't change the past that long existed before your birth or even yesterday, but you can choose to dream, create, and forge the future into your desires and hopes. As always, shite always happens when your not looking for it. What you choose to do after stepping in it unintentionally... is totally up to you. :) Maybe this tool and tips provided will aid you in not stepping in an algo cachucha up to your ankles somehow.
SCRIPTING LESSONS PORTRAYED IN THIS SCRIPT:
Pine etiquette and code cleanliness
Overwrite capabilities of built-in Pine variables for testing indicators
Various techniques to organize Settings panel while providing ease of adjustment utility
Use of tooltip= to provide users adequate valuable information. Most people want to trade with indicators, not blindly make adjustments to them without any knowledge of their intended operation/effects
When available time provides itself, I will consider your inquiries, thoughts, and concepts presented below in the comments section, should you have any questions or comments regarding this indicator. When my indicators achieve more prevalent use by TV members , I may implement more ideas when they present themselves as worthy additions. Have a profitable future everyone!

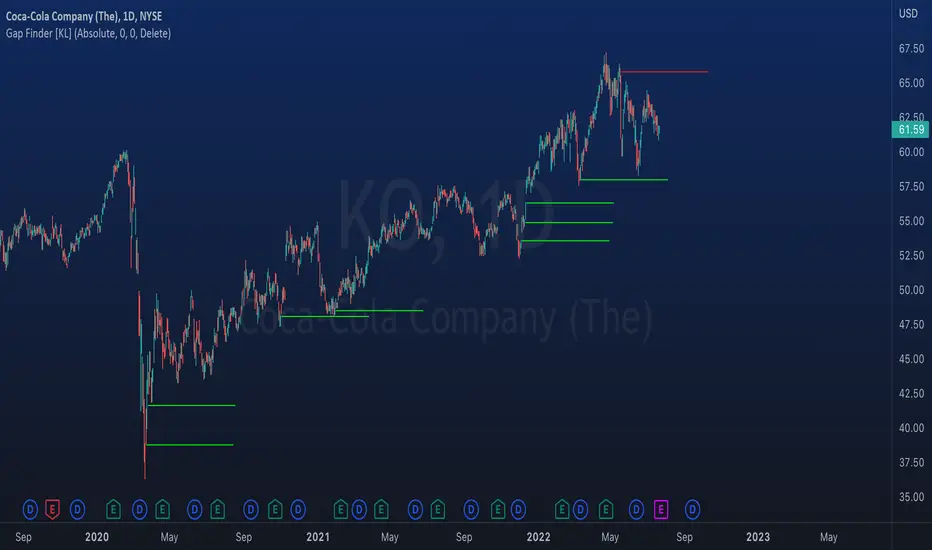
Indicator: Gap Finder [KL]
About gaps:
A gap is a “jump” in a security’s price between the Open and the Prior Close . Gaps are very common in stocks during opening hours, especially when accompanied by catalysts.
What this indicator does:
This script will identify gaps that remained unfilled for at least one candle.
It is very common for gaps to be filled on the first candle, these gaps are arguably less meaningful, so they are ignored by the indicator to reduce the number of lines drawn.
Applications:
Since most gaps eventually get filled, the question is a matter of when . If going with the trend, a trader will open a long/short position when seeing an up/down gap. When going against the trend, then short/long the stock on up/down gaps and consider taking profits when price returns to where the gap originally occurred.
Originally intended for 1D timeframes, but gaps can occur in all timeframes. Applications are limitless.
xRamiq v1test edilir! guvenli deyildir! Super Trend kullanarak hazirland/
Test Aşamasındadır.
çok küçük bakiyeler kullanın.
Waves Change SignalsAn extension (supporting script) for Waves series (e.g. Waves + ZOOnes). It detects candlestick patterns and:
supports merging few candles into one to get more sensitive candlestick patterns detection
supports filtering in the context of current wave (but it cannot draw the wave by itself)
It supports filtering based on 2 rulesets/wave variants:
Low - More sensitive (trend will change more ofter).
Meddium - Less sensitive ( trend will change less ofter).
Script with limited access, contact author to get authorization
Features:
- Detect candlestick formations
- Merge candles to detect hidden patterns
- Filter results with the current wave state (bullish signals for corrections, bearinsh signals for impulses) with use of Low or Medium waves.
- Limit results to last x patterns.
Script settings:
Trend type - You can switch what kind of waves should be used for filtering.
Limit - You can limit resutls to last X formations.
Include bar merges - You can pich which merge patters should be included. e.g. 3 2 2 means that 7 bars are merged into 3 with the sequence 3 bars as first, 2 bars as second, 2 bars as third.

Color Palette OptionsA quick, easy way to swap out colour palettes. Simple cosmetic, but charts are allowed to be fun too!

Heikinashi Candles Biggest problem that when we use normal heikin-ashi candlestick pattern then all applied indicator values also changes
Like Pivot Point with CPR ,,, EMA,,, SMA including VWAP indicator value
So , this indicator help us plot Heikinashi candles on Normal candles
Please follow below steps:
Add this indicator to chart
Go to setting >> un-tick Body, Border and Wick color
That will hide candles on chart and Plot heikinashi candles on Normal candles without changing any indicator value
Remember use normal candle stick pattern that

Hammer / Shooting Star ScannerAlways missing hammer and shooting star candlestick pattern?
This script will help you to alert hammer shooting star candlestick.
Please leave your comments for improving this script.

*SSS 50% [Intra]SSS 50% Rule Indicator - Intraday 5/15/30/60 Version
This indicator is based on Sara Strat Sniper's - 50% Rule for trading Outside Bars and helps you visual the method quickly.
This indicator allows you to select: Outside 5/15/30/60 minute Warning Levels with Previous High and Low Levels all available within the indicators settings.
Please note - 60 minute warning and high/low levels are set to the indicators default. Feel free to change and save as required. Any issues let me know.
** Indicator Setup Requirements **
For Indicator to correctly display the 50% price level you need to setup your chart correctly. Right-click your chart background, select Settings, select Scales and Tick “Indicator Last Value Label". Now your 50% Price level will be displayed.
Nov 30, 2021
Custom functions added as requested by users to produce cleaner charts.
H Line added for 50% level
Ability to change color for H/L Levels and Labels.
Adjust Line Width and Line Style
Adjust 50% and High/Low Label Offsets
Basic Alert Function added for 50% Level. Add Alert and Select Condition: SSS 50%, followed by your desired Outside Day Warning.
Please note alert functions have been tested and work once the current close price crosses the 50% level. Any issues please let me know and I will update when required.

Fear and Greed Index CandlesticksThis colours the candlesticks based on my 'Fear and Greed Index'.
All calculations are explained in the code.
The index is mainly based upon the components of the popular fear and greed index website. I've annotated the components in the code for you to look at.
If you're interested, you can replace the final variable 'Total' (within the 'barcolor' function at the very end) with any of the final outputs of the subcomponents to see the results of that single part.
Red = Greed
Green = Fear
Enjoy!

Find Master Candle(MC)Description.
1. This indicator finds and displays master candles.
2. Master Candle (MC)? After the MC, the first candle becomes the MC if there is a movement of 4 candles trapped in the master candle.
3. Option setting
3.1. Specify min/max size and pip conversion variables to specify the size of the master candle (MC).
3.2. The size of the master candle (MC) can be specified by the size of the pip.
3.3. The body size of the master candle (MC) can be specified as a percentage of the total candle.
4. trading strategy
4.1. Master Candle Identification
4.2. Enter trading when the master candle is broken
4.3. The target return is basically the same as the size of the master candle (however, you want to find a valid value according to the stock)
※ It is recommended to set the master candle size and target profit range according to the trading time chart.
※ This trading strategy is useful for judging when to break through a certain range, and is useful both for scalping and beyond.
------------------------------------------------------------------------------------------
설명.
1. 이 인디케이터는 마스터 캔들을 찾아서 표시 해줍니다.
2. 마스터캔들(MC)? MC 이후 캔들 4개가 마스터캔들에 갇힌 움직임이 나오는 경우에 첫 캔들이 MC이 됩니다.
3. 옵션 설정
3.1. 마스터캔들(MC)의 크기를 지정하기 위해 최소/최대 사이즈 및 핍 변환 변수를 지정합니다.
3.2. 마스터캔들(MC)의 크기는 핍의 크기로 지정할 수 있습니다.
3.3. 마스터캔들(MC)의 몸통 크기는 전체 캔들의 %비율로 지정할 수 있습니다.
4. 매매 전략
4.1. 마스터 캔들 식별
4.2. 마스터 캔들 돌파 시 거래 진입 ( cf . MC +-5 pips 인 경우 진입)
4.3. 목표 수익은 기본적으로 마스터 캔들의 크기 만큼 (그러나, 종목에 따라 유효한 값을 찾기 바람)
※ 거래 시간대 차트에 따라 마스터 캔들 크기 및 목표 수익의 범위를 정하기 바람
※ 이 거래 전략은 특정 범위의 돌파 시점을 판단하는데 유용하고, 스캘핑 또는 그 이상의 거래에 모두 유용합니다.
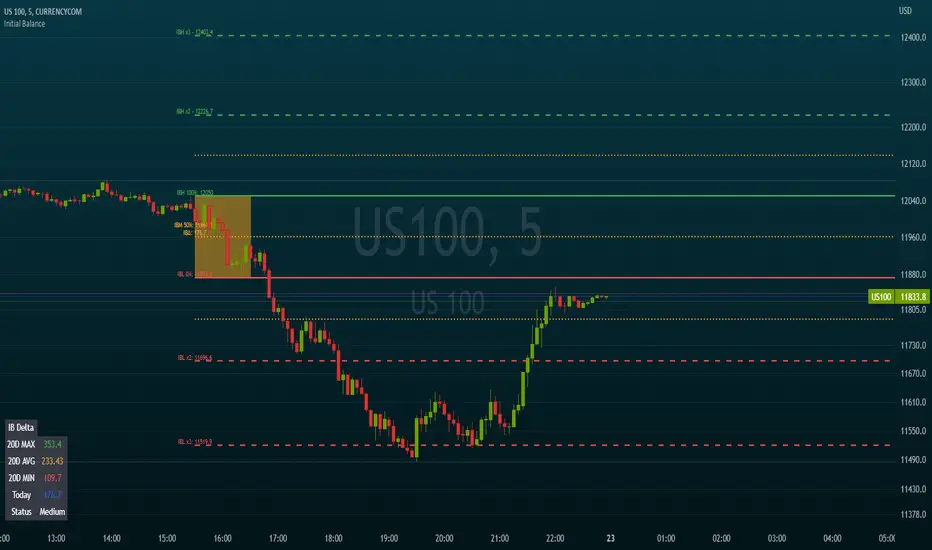
Initial BalanceThis script calculates and draws the initial balance price levels which can be really interesting for intraday activities.
Note: Obviously, you need to wait for the calculation period to finish in order to see your daily levels
The tool includes the following options
Customization of the session used to calculate the initial balance (default 0930-1030)
Show/Hide the calculation period (as a background color)
Show/Hide extra levels (report the IBH-IBL delta above and under the IB area)
Show/Hide intermediate levels (displays 50% price levels in the IB and extra areas)
Show labels (Display levels names as well as their price on corresponding lines)
Levels names:
- IBH (Initial Balance High)
- IBH (Initial Balance Low)
- IBM (Initial Balance Middle)
- IBH x2
- IBL x2
Default colors are green for high levels, red for low levels, and orange for intermediate levels
Extend levels (extends the current levels to left/right/both/none sides of the chart)
SMART4TRADER - BREAKOUTThis indicator shows the breakthrough of extremes for the selected period. The default period is set = 3
The indicator checks on the current bar whether the maximum or minimum prices for the selected period are broken
----------------
Данный индикатор показывает прорыв экстремумов за выбранный период. По-умолчанию выставлен период = 3
Индикатор проверяет на текущем баре пробиты ли максимальные или минимальные значения цен за выбранный период

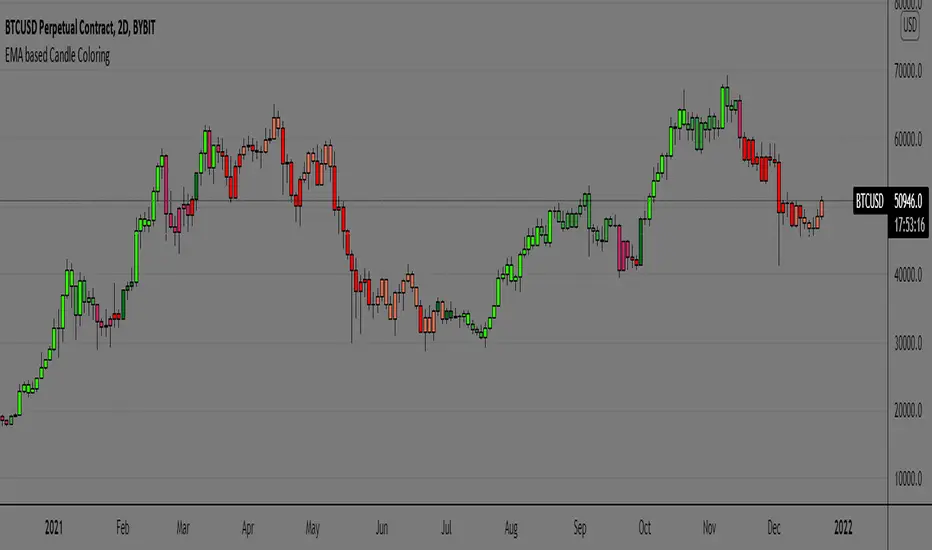
EMA based Candle ColoringEMA or Exponential Moving Average (EMA) is a technical indicator used in trading practices that shows how the price of an asset or security changes over a certain period of time. The EMA is different from a simple moving average in that it places more weight on recent data points (i.e., recent prices)
In this script plain EMA or MA is not used for candle coloring, but it takes multiple EMAs of the original EMA and then subtracts lag from the result to get data points of each candle of two certain periods defined. As it differs from traditional EMAs and MAs by reacting quicker to price changes and is able to subtract lag with its calculated formula.
The candle coloring is able to interpret short-term price direction and overall trend and its suitable for active traders. As it tracks price more closely than SMAs
Since EMAs can also provide support or resistance for price and is highly reliant on the asset’s lookback period we can make sure we stay with the trend rather than going against the trend.
*First of all here's what the colors represent and how to interpret them is shown in below image
Examples of how I use the Coloring pattern
Spotting a fakeout/stophunt
during trends:
* No strategy is 100% accurate this script is one of those too , traders must use this as an addition to their system rather than making it a standalone system.
* Context is important as the coloring is done using calculations, different timeframes has different context hence traders discretion is key.
Hope you find this helpful,
Thankyou.
happy trading.
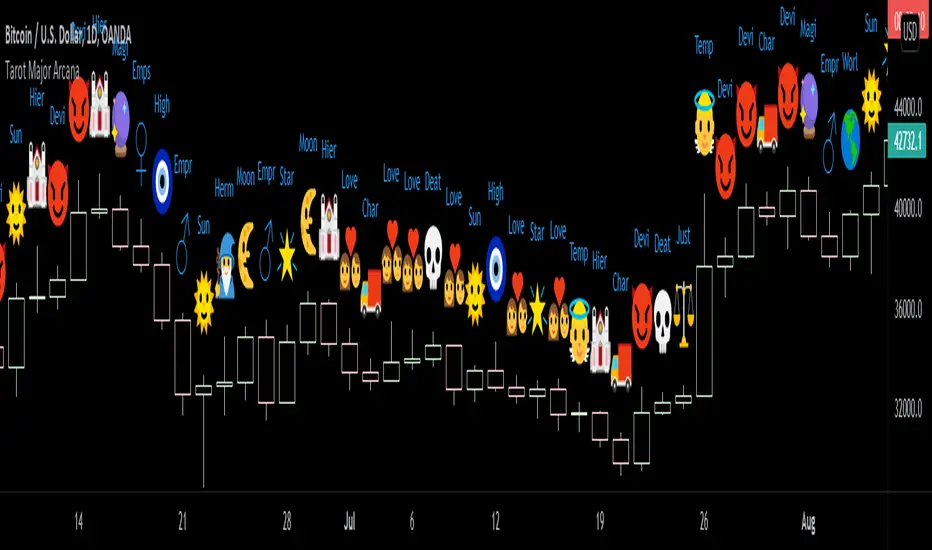
Tarot : Major ArcanaThis script generates a Major Arcana Tarot card for each candle at its close.
The candle is divided into 22 sections, each section corresponding to one of the Major Arcana.
When a candle closes, it closes in one of those 22 sections and that generates the card.
You could read green candles as upright and red candles as reversals.
Uses
----
Use this to pull a daily card on your chart.
Ask a question on the one-minute chart before the candle closes and wait for your answer.
Use it to forecast the upcoming market.
Anything else!
Enjoy.
TAPLOT Price Time Frame Continuity #TheStrat#TheStrat Price Continuity is a simple concept in where market participants across multiple time frames are in-sync with each other.
The concept looks at multiple time frames & assess if harmony exists between them. The way that is done is looking at closing price vs opening price on each time frame.
If monthly bar is up & weekly bar is up and daily bar is up, that means market participants across all of these 3 different time frames are in-sync with each other.
The indicator places an indicator at the top right side of the chart with each resolution closing price vs open. if Close is higher than open then green else red.
The indicator setting allows you to change the size of the data cells and text color.
How do I use this?
I am a swing/position trader. The indicator gives me more conviction when I see that daily, weekly and Monty chart are all in-sync with each other.
Please note that the indicator displays ONLY on daily charts.

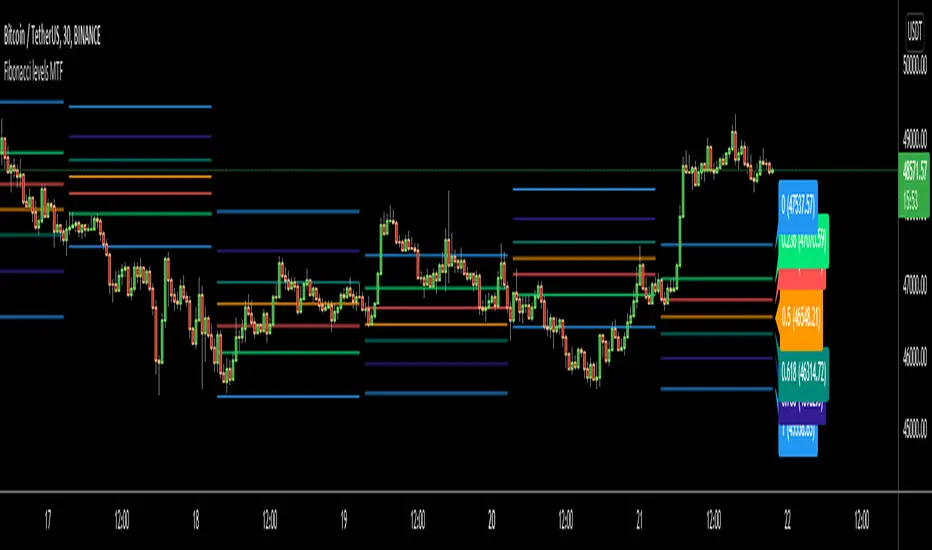
Fibonacci levels MTFHello All,
I got some requests for a script that shows Fibonacci Levels of Higher Time Frame Candles. so I made/published this script. I hope it would be useful for you.
Options:
You can set Higher Time Frame, by default it's 1 Day.
Optionally it can use Current or Last Candle of higher time frame to calculate/show its Fibonacci Levels.
It can show higher time frame candles at the background optionally. You can change its colors.
You can enable/disable/change each Fibonacci levels and their colors.
You can enable/disable Fibonacci Labels that is shown at the right ride and see only Fibonacci lines/levels
example, Fibonacci levels with higher time frame candles:
P.S. if you have ideas to improve this script, drop a comment under the script please
Enjoy!
Trailing Stop AlertsThis script is designed as an ATR-based trailing stop tool to assist in managing open positions.
Once you're involved in a profitable trade, if you add this script to your chart you'll be prompted to select a bar to begin trailing from.
You can then adjust the candle lookback distance for swing high/lows (7 by default), the ATR multiplier (1.0 by default), and the direction to trail (Long/Short).
You can also adjust the ATR period in the settings menu if you want to (14 period by default).
Once the script is added to your chart, it will begin drawing your trailing stop and you can then set up alerts.
Alert Options:
Any alert() function call : Will trigger an alert for both conditions (trailing stop updated, trailing stop hit)
Alert Conditions : Trailing Stop Update will trigger whenever the stop is updated, Trailing Stop Hit will trigger whenever the stop is hit.
Note: the alerts will only fire once per bar close and the trailing stop will not update on realtime bars.

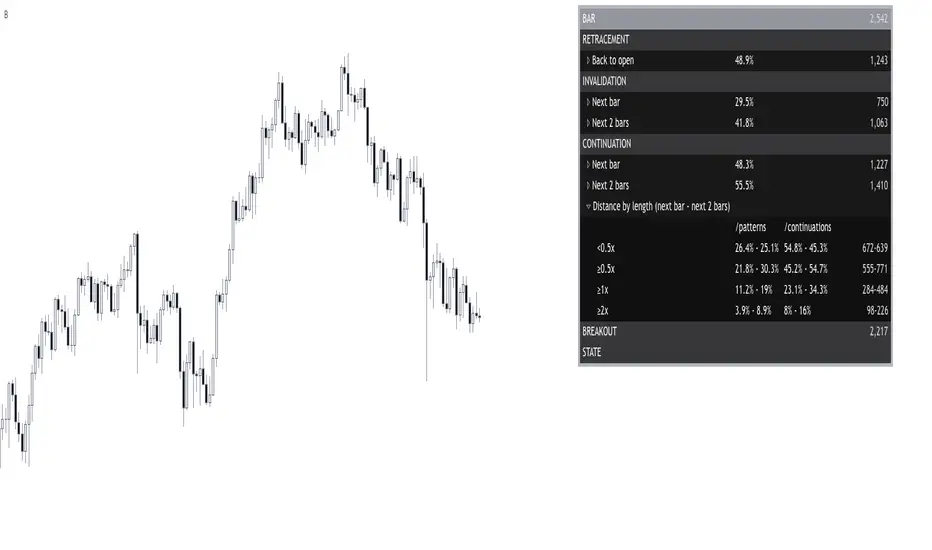
Bar█ OVERVIEW
This indicator demonstrates how we can use Pine script for collecting data to study the market.
By building a statistical report based on the chart candlestick analysis, discover if there is an edge or not, when and where?
Compare it with a specific candlestick pattern and know how its behavior diverges. I have already covered some here .
I hope it can bring you ideas for researching new edges, testing, and trying new things.
█ FEATURES
Sections
The report organizes the data into the following sections: retracement , invalidation , continuation , breakout , and state . Each of them provides insights into the price behavior and answers to questions such as: How often does price retrace? Does the pattern often invalidate? If it does not, does it break in the pattern's direction? How far does the price go? What are the odds of a false breakout? What is the likelihood of the next bar being a down candle?
Highlighter
The indicator highlights flat bars (open and close at the same price). It also highlights bullish and bearish bars once a filter is applied.
Settings
Filtering of bars closing beyond their prior bar’s high and low;
Filtering of reversal bars (two modes available);
Displaying distances relative to the bars length or Average True Range;
Collapsing/expanding each section;
Changing the report’s coloring and positioning;
█ NOTES
Computation
The script computation occurs on bar close.
Distances in ATR
When using a period of 20, for example, the first 19 candles are ignored because the ATR is not defined yet.
Waves + ZOOnesTrend visualization tool in Wave theory. Unlike Elliot waves, it has a constant pattern length. The formation consists of impulse and 3 corrections.
The script analyzes candle relationships in the currect trend, trend will be continueted until candle are not breaking trend rules.
Currently it supports 2 rulesets/wave variants:
Low - More sensitive (trend will change more ofter).
Meddium - Less sensitive ( trend will change less ofter).
Simultaneous observation of both types allows to detect consolidation before the overlapping movement and increase the probability of indicating the moment of the movement occurrence.
Script with limited access, contact author to get authorization
Features:
- Show Low and Middle type/order waves
- Show support/resistance areas for the Low and Middle type/order waves.
- Types for waves and support areas are picked independently. Script can show Middle Waves with Low Waves support areas.
- Shadow mode that show second wave moved to the wave max/min bars.
- Show historical support/resistance areas that are not valid any more.
Script settings:
Trend type - You can switch what kind of waves should be drawn.
ImpulsMode - Picking graphical reprezentation of first bullish arrow.
Line width - With of drawn line. Separate setting for Low and Medium trend type.
Impuls - Color of the first bullish arrow.
Correction - Color for other arrows.
Trend shadow - Showing second reprezentation of the trend with drawing with the use of minimal and maximal values. It's usefull to determine the delay between the peak and a wave change signal.
ZOOnes type - Determines what type of trend is used to designate areas of support.
Only nearest zones - Drawing only one nearest zone above and below current price.
Only nearest potencial zones - Drawing only one nearest potencial zone above and below current price.
Show history - Showing zones in historical data
Zone precision - Determines how many bars are included in area calculation.
Alerts:
Low trend DOWN - When Low trend type is changing from UP to DOWN
Low trend UP - When Low trend type is changing from DOWN to UP
middle trend DOWN - When Middle trend type is changing from UP to DOWN
middle trend UP - When Middle trend type is changing from DOWN to UP
middle trend from ZOOnes DOWN - When Middle trend type is changing from UP to DOWN after hiting resistance area .
middle trend from ZOOnes UP = When Middle trend type is changing from DOWN to UP after hiting support area .
Troubleshooting:
In case of any problems, send error details to the author of the script.

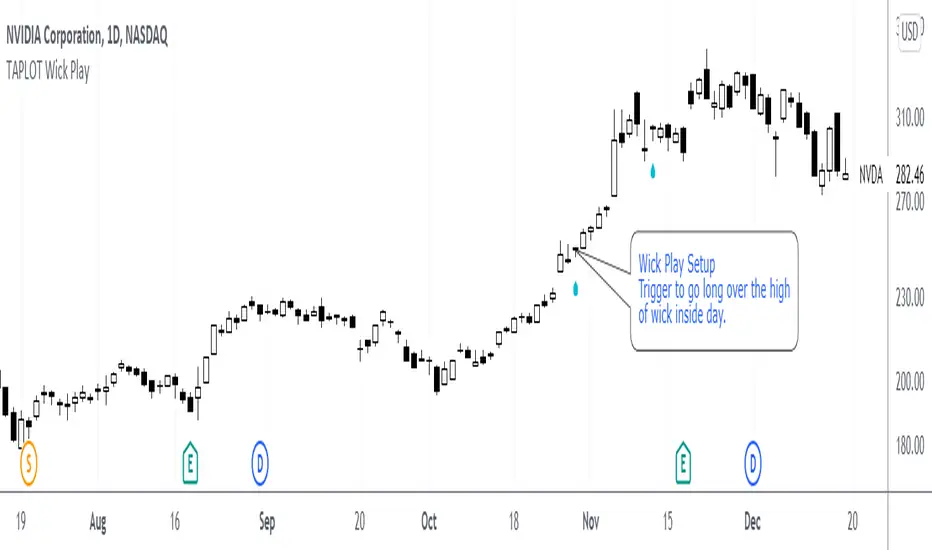
TAPLOT Wick PlayWick play is a candle stick long setup popularized by 2020 US Investing Champion Oliver Kell
Wick Play is a setup in which:
Strong stock with momentum to the upside closes off the highs of the day in yesterdays session.
Today's session opens in the candle "wick" of yesterdays bar.
If stock holds in the wick and doesn't trade in the body of yesterdays candle, it is a sign of strength.
Trigger happens on day 3 when price moves over the high of the wick inside day.
It is important to note that this setup should not be traded in isolation. Not every wick play is buyable.
This is to be used in the context of strong stocks like True Market Leaders and with buying momentum behind them.
Indicator places an up arrow under the candle setup. It also colors the candle itself. All configurable through indicator settings.
Cheers!