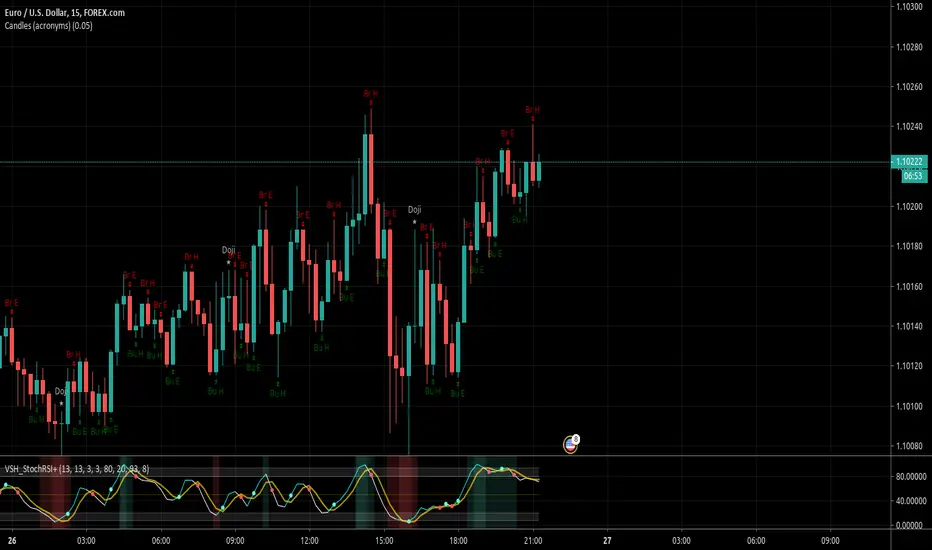
Candles (acronyms)Same script as "Candles" by TraderMentality but with acronyms for candle shape names.
Candle

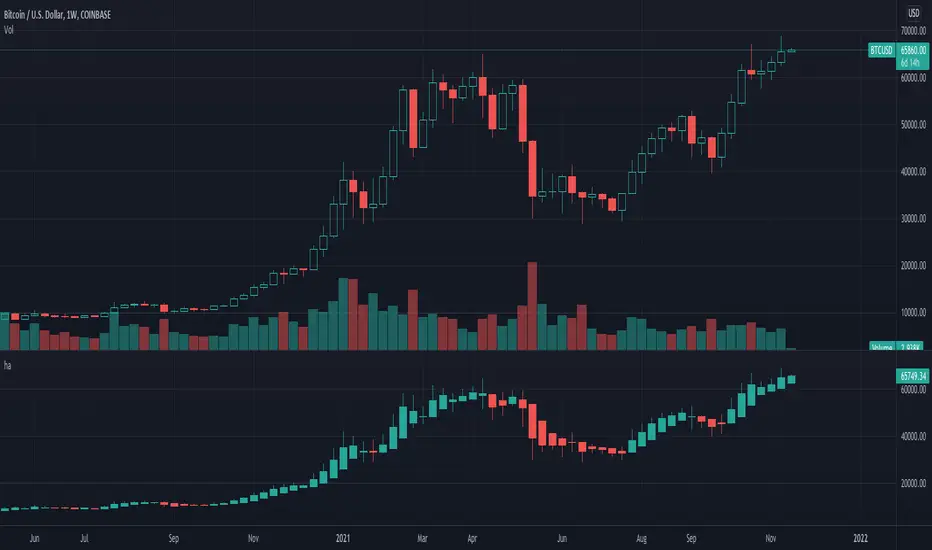
Heiken-Ashi CandlesSimple script to view Heiken-Ashi candles below a normal candles chart.
Could also be useful for using HA calcs in strategy scripts on normal candles chart for proper backtesting.
I adapted this to v4 from original v2 script by @samtsui. If you like please remember to give him a Thumbs Up for his original version! ->
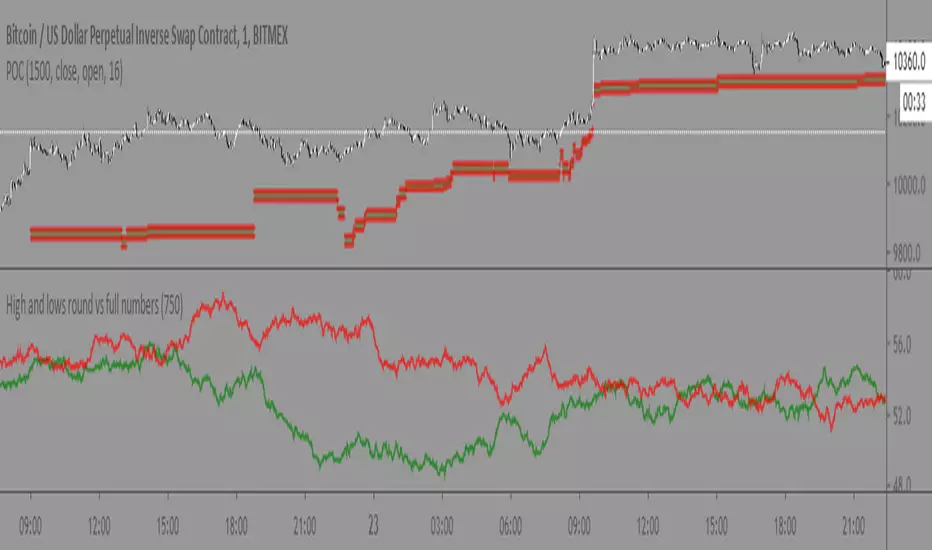
High and lows round vs full numbersLiterally the name, just checks if a high or low is a full number or decimal (i.e 100.5) then shows the percentage of full number highs vs percentage of full number lows.
I couldn't really find anything useful with it but maybe someone else can
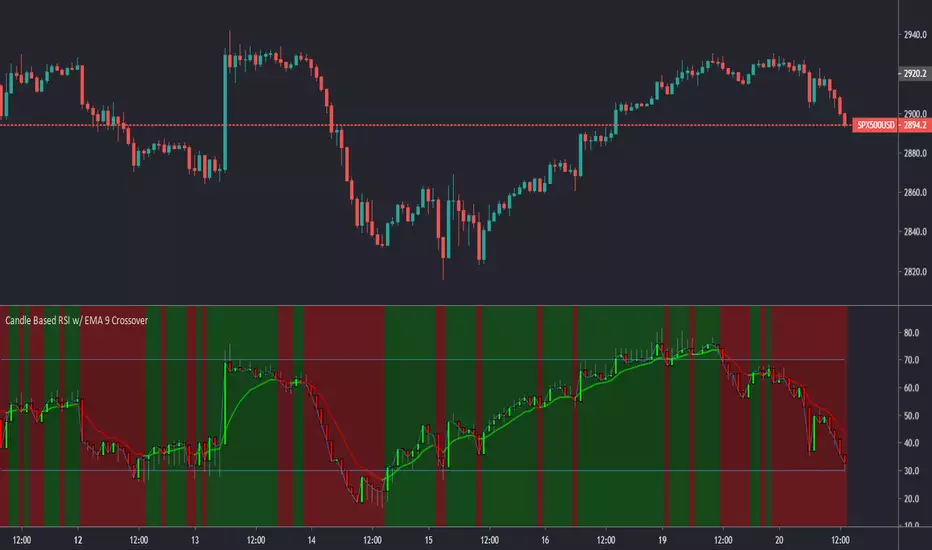
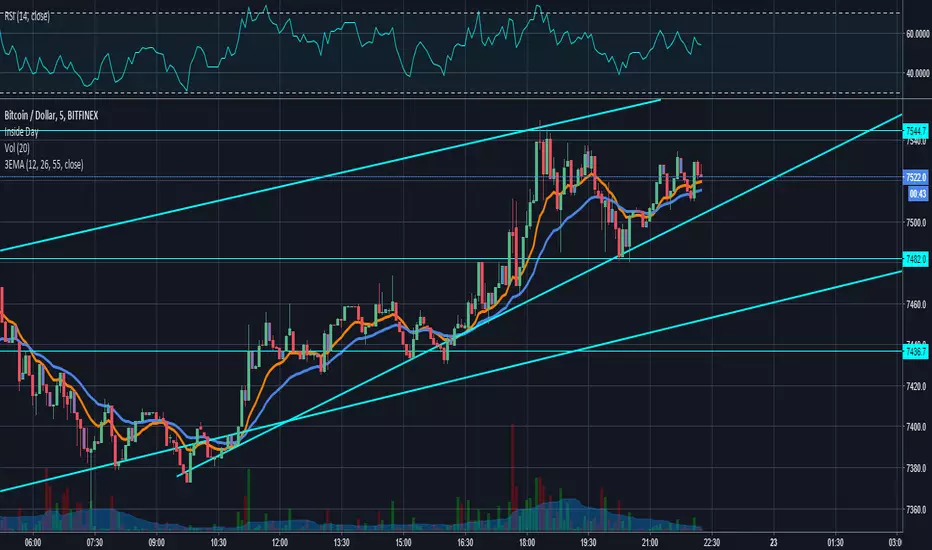
Candle Based RSI w/ EMA 9 CrossoverThis is my first published script. I hope you find it as useful as I have.
This is a modified version of olegnator's RSI script. Enjoy!
HTF Candle [Custom Time Period] by JustUncleL [SOMMI 1.0 edit]This is a custom High Time Frame indicator, originally created by JustUncleL. 💚
I have edited the Pine Script to allow a custom Time Period input. 💛
In the original version, you could only select from a few time periods as your High Time Frame. 💙
In this version you can put any time frame as your reference. 🧡
Example: 6-hour HTF or 2-Day HTF
SOMMI'S SPECIAL NOTES:
-This indicator works with Heikin-Ashi candles.
-Please change your candles to Heikin-Ashi and apply the indicator.
-Advised to disable "Body Wicks"
-Advised to also refresh your page a few times a day as it doesn't update properly due to limitations of TradingView / Pinescript currently.
💙💛💚🧡

Candles - Cheat SheetWhat is up y'all ? (french trying to sound American)
I found that in my script archives, way back in an old cave. I think this might be useful as a few really asked me how to define a green/red candle, how to capture the wick value, the body, etc..
This is not a fancy script as usual and I'm sure they're plenty of candles pattern scripts out there but I saw no one sharing a simple candle cheat sheet for pinescript coding
Being able to define candles using codes is an essential skill to have for any Pinescripter
Still on the train so won't write a roman as usual... Kidding... I actually did it here What-is-an-Hard-Exit-and-a-few-notes-on-trading-management/
It won't bring me as many likes as any magic p**p cannon accounts promising the moon at each trade but if I can help at least 1 trader a day not losing his/her money, I'll be happy and my daily goal will be fulfilled
All the best
Dave
____________________________________________________________
Be sure to hit the thumbs up
- I'm an officially approved PineEditor/LUA/MT4 approved mentor on codementor. You can request a coaching with me if you want and I'll teach you how to build kick-ass indicators and strategies
Jump on a 1 to 1 coaching with me
- You can also hire for a custom dev of your indicator/strategy/bot/chrome extension/python
MACD Profit CandlesThis tool is simple yet very effective. It creates new candles on the chart based on the MACD.
Candles are green when MACD is increasing and red when it is decreasing. All lengths can be adjusted in the input menu and there is an option to plot the signal line.
The rules for using it are pretty simple:
1.Buy on Green
2.Sell on red
~Happy Trading~

Engulfing Candles DetectorHello traders
Credit to HPotter for that script
I took his script and added alerts to it. 2 lines lol
But anyway, useful to detect reversals by coloring bullish/bearish engulfing candles :)
Enjoy
David

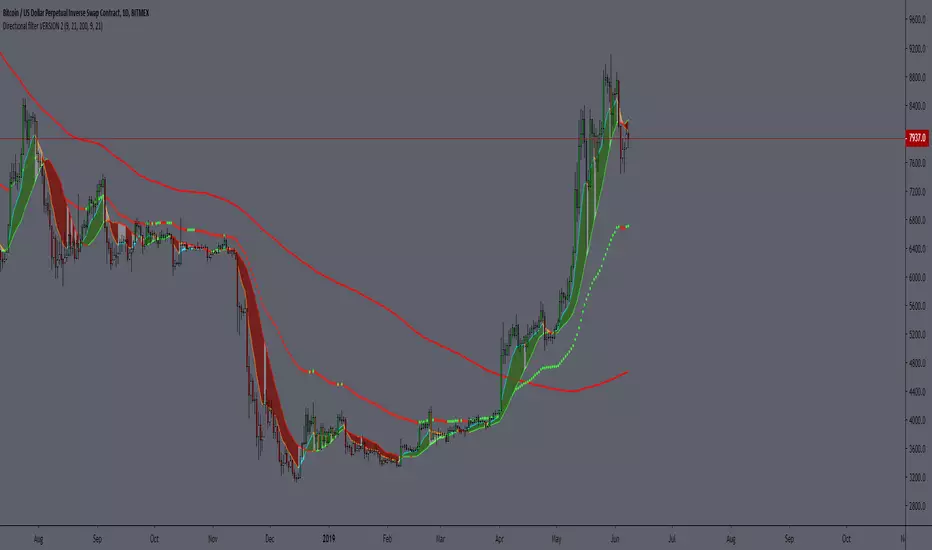
Directional filter VERSION 2The idea is to make it more visible if the moment is to seek buying or selling, based on moving averages, being SMA 21 and EMA 9.
best BUYBAR has the EMA9 and SMA21 rising and closing above them. "relevance A"
best SELLBAR has the EMA9 and SMA21 dropping and closing below them. "relevance A"
Conditions for all colors of the candlesticks:
BuyBar A = price closes above EMA9 and SMA21 with EMA9 and SMA21 rising.
BuyBar B = price closes above SMA21 with SMA21 rising OR price closes above EMA9 and SMA21.
BuyBar C = price closes above EMA9 with EMA9 rising and SMA21 falling.
BuyBar Neutral = close> open.
SellBar A = price closes below EMA9 and SMA21 with EMA9 and SMA21 falling.
SellBar B = price closes below SMA21 with SMA21 falling OR price closes below EMA9 and SMA21.
SellBar C = price closes below EMA9 with EMA9 falling and SMA21 rising.
SellBar Neutral = close abertura.
SellBar A = preço fecha abaixo de EMA9 e SMA21 com EMA9 e SMA21 caindo.
SellBar B = preço fecha abaixo de SMA21 com SMA21 caindo OU preço fecha abaixo de EMA9 e SMA21.
SellBar C = preço fecha abaixo de EMA9 com EMA9 caindo e SMA21 subindo.
SellBar Neutral = fechamento < abertura.
As medias moveis também alteram de acordo com a direção em que estão:
EMA 9 subindo = azul
EMA 9 caindo = laranja
SMA 21 subindo = verde
SMA21 caindo = vermelho
High Performance Candlestick Patterns Colors//Candle Patterns Ranked by Performance THOMAS N. BULKOWSKI
//1. Bearish Three Line Strike +Up 67.38%
//2. Bullish Three Line Strike -Down 65.23%
//3. Bearish Three Black Crows -Down 59.83%
//4. Bearish Evening Star -Down 55.85%
//5. Bullish Upside Tasuki Gap +Up 54.44%
//6. Bullish Inverted Hammer -Down 51.73%
//7. Bullish Matching Low -Down 50.00%
//8. Bullish Abandone Baby +Up 49.73%
//9. Bearish Two Black Gapping -Down 49.64%
//10. Brearish Breakaway -Down 49.24%
//11. Bullish Morning Star +Up 49.05%
//12. Bullish Piercing Line +Up 48.37%
//13. Bullish Stick Sandwich +Up 48.20%
//14. Bearish Thrusting Line During Dowtrend +Up 48.10%
//15. Bearish Meeting Line +Up 48.07%
//Down=Yellow Bar Color and Black Text
//Up=Blue Bar Color and Blue Text
//High Performance Candlestick Patterns Colors Top 15

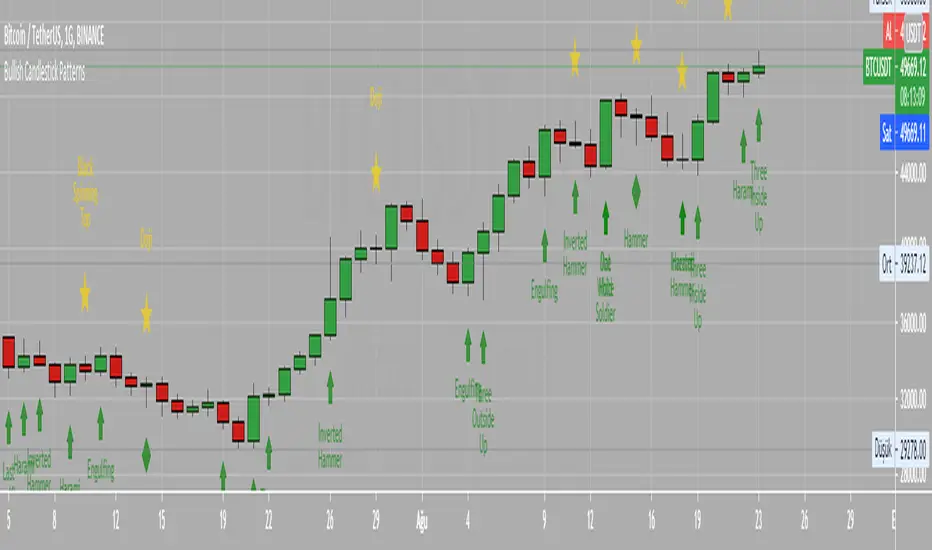
High Performance Candlestick Patterns//Candle Patterns Ranked by Performance THOMAS N. BULKOWSKI
//1. Bearish Three Line Strike +Up 67.38%
//2. Bullish Three Line Strike -Down 65.23%
//3. Bearish Three Black Crows -Down 59.83%
//4. Bearish Evening Star -Down 55.85%
//5. Bullish Upside Tasuki Gap +Up 54.44%
//6. Bullish Inverted Hammer -Down 51.73%
//7. Bullish Matching Low -Down 50.00%
//8. Bullish Abandone Baby +Up 49.73%
//9. Bearish Two Black Gapping -Down 49.64%
//10. Brearish Breakaway -Down 49.24%
//11. Bullish Morning Star +Up 49.05%
//12. Bullish Piercing Line +Up 48.37%
//13. Bullish Stick Sandwich +Up 48.20%
//14. Bearish Thrusting Line During Dowtrend +Up 48.10%
//15. Bearish Meeting Line +Up 48.07%
//Down=Yellow Bar Color and Black Text
//Up=Blue Bar Color and Blue Text
//High Performance Candlestick Patterns Top 15

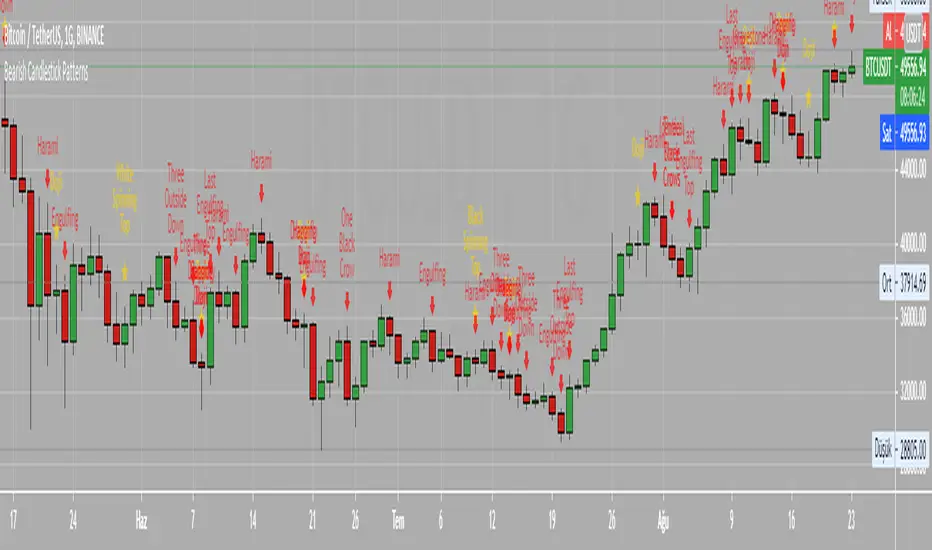
Bearish Candlestick PatternsDoji
Black Spinning Top
White Spinning Top
Bearish Abandoned Baby
Bearish Advance Block
Bearish Below The Stomach
Bearish Belt Hold
Bearish Breakaway
Bearish Counter Attack Lines
Bearish Dark Cloud Cover
Bearish Deliberation Blok
Bearish Descending Hawk
Bearish Doji Star
Bearish Downside Gap Three Methods
Bearish Downside Tasuki Gap
Bearish Dragonfly Doji
Bearish Engulfing
Bearish Evening Doji Star
Bearish Evening Star
Bearish Falling Three Methods
Bearish Falling Window
Bearish Gravestone Doji
Bearish Hanging Man
Bearish Harami
Bearish Harami Cross
Bearish Hook Reversal
Bearish Identical Three Crows
Bearish In Neck
Bearish Island Reversal
Bearish Kicking
Bearish Ladder Top
Bearish Last Engulfing Top
Bearish Low Price Gapping Play
Bearish Mat Hold
Bearish Matching High
Bearish Meeting Line
Bearish On Neck
Bearish One Black Crow
Bearish Separating Lines
Bearish Shooting Star
Bearish Side by side White Lines
Bearish Three Black Crows
Bearish Three Gap Up
Bearish Three Inside Down
Bearish Three Line Strike
Bearish Three Outside Down
Bearish Three Stars in the North
Bearish Thrusting Line During Dowtrend
Bearish Tower Top
Bearish Tristar
Bearish Tweezers Top
Bearish Two Black Gapping
Bearish Two Crows
Bearish Upside Gap Two Crows
Bullish Candlestick PatternsBullish Abandone Baby
Bullish Above The Stomach
Bullish Belt Hold
Bullish Breakaway
Bullish Concealing Baby Swallow
Bullish Counterattack Lines
Bullish Deliberation Block
Bullish Descent Block
Bullish Doji Star
Bullish Downside Gap Two Rabbits
Bullish Dragonfly Doji
Bullish Engulfing
Bullish Hammer
Bullish Harami
Bullish Harami Cross
Bullish High Price Gapping Play
Bullish Homing Pigeon
Bullish Hook Reversal
Bullish Inverted Hammer
Bullish Island Reversal
Bullish Kicking
Bullish Ladder Bottom
Bullish Last Engulfing Bottom
Bullish Mat Hold
Bullish Matching Low
Bullish Meeting Line
Bullish Morning Doji Star
Bullish Morning Star
Bullish On Neck
Bullish One White Soldier
Bullish Piercing Line
Bullish Rising Three Methods
Bullish Rising Window
Bullish Separating Lines
Bullish Side by Side White Lines
Bullish Stick Sandwich
Bullish Takuri Line
Bullish Three Gap Downs
Bullish Three Inside Up
Bullish Three Line Strike
Bullish Three Outside Up
Bullish Three Stars in the South
Bullish Three White Soldiers
Bullish Thrusting Line During Uptrend
Bullish Tower Bottom
Bullish Tristar
Bullish Tweezers Bottom
Bullish Two Rabbits
Bullish Unique Three River Bottom
Bullish Upside Gap Three Methods
Bullish Upside Tasuki Gap
MA CandlesOHLC calculated with a moving average.
You can replace sma with anything. EMA, Hull, sma(sma(sma(sma(close, etc.
You could also make it look clean like Heikin Ashi candlesticks if you include min/max for low/high wicks on candles.

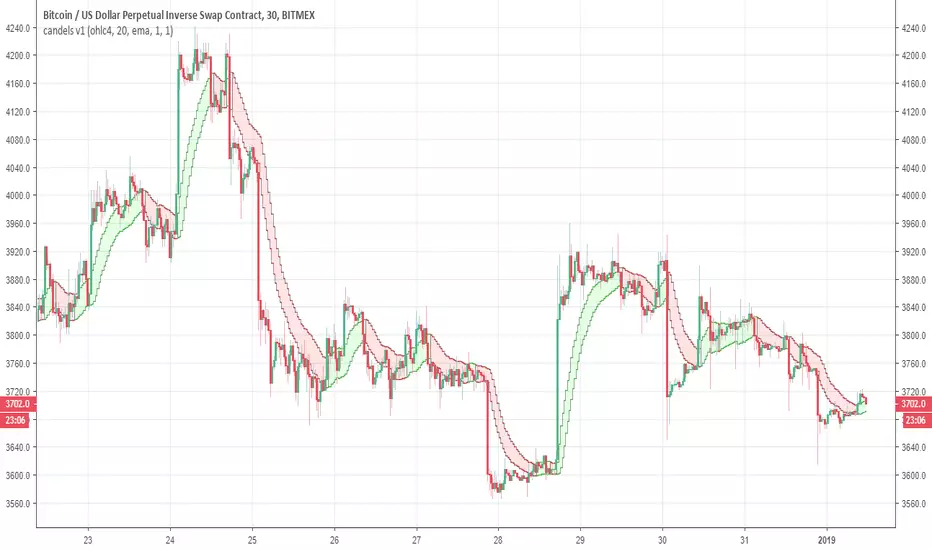
candels v1So this is a candel version with different smoothing methods (EMA ,KAMA 'WMA , ALMA etc)
you have option for MTF in the setting
the length is set to 1 -change it to the size you want (20 for example)
RSI Candles (with wicks)The script adds wicks to the RSI candle indicator.
It is based on the RSI candle indicator by cI8DH.
Note that the definition of these wicks is not unique.
The implementation uses an RSI calculated from the highs and lows for the wicks.

Bull/Bear CandleThis script will display a small triangle under the latest two candles to indicate whether that candle is bullish or bearish based on the following definition.
A bullish candle closes in the top portion of the trading range of the candle while a bearish candle closes in the bottom portion of the trading range of the candle.
The cutoff is currently set at 65% (you can adjust it) so the close must be outside or equal to 65% of the trading range to be considered bullish or bearish. If less than 65% the triangle will indicate a neutral candle.
Colours are;
green triangle = bullish candle
red triangle = bearish candle
yellow triangle = neutral candle
I hope this helps those using TraderCobb's cradle strategy.
Small candle indicatorI've modified the original script by WiscoDish to show candles as green while they are smaller than the median of the past 10 candles. Once they become larger than the median they'll change to gray.
I've also added a horizontal median line so you can see how close the candle is to the median candle size.
This is very useful if you're stalking a trade and waiting for the candle to close small.

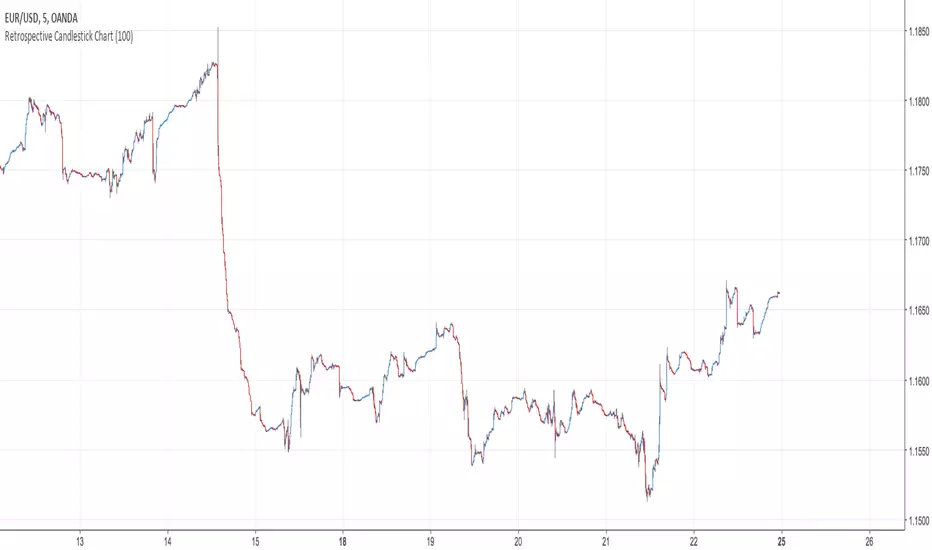
Retrospective Candlestick ChartWhen i was in Japan with some traders colleagues we talked about traditional charting tools from this country and how they changed the way we look at our charts today. Then suddenly one of the japanese traders i have met earlier said "Why not making another charting tool ? Smoother than Heikin-Ashi and including all the information a trader may need but easier to interpret".
So i had the idea of averaging the input and the output of the respective close / open / high and low price using a recursive exponential window functions, each values will be closer to their true value if they are volatile, if they are not then those values will look smoother, the length input represents the reactivity of the candles, high values represents smoother results but less reactive.The goal of those candles is to make all the information easier to interpret by a trader.
500 input length , the price look smoother, supports and resistances are easier to make.
The interpretation of highs and lows are important, the Retrospective Candlestick Chart save you time by showing only huge movements.
DRS - Daily Range SystemAn indicator that visualizes the evolution of a daily candle, inspired by a thread on forexfactory: www.forexfactory.com
Applied on a timeframe lower than D (actually lower than H4), it visualizes the evolution of the day's high and low, as well as mid and 25% and 75% lines.
The sole input parameters are the hour at which a day is supposed to start, and the extent of the "trade allowed" region as explained in the FF -1.44% thread.

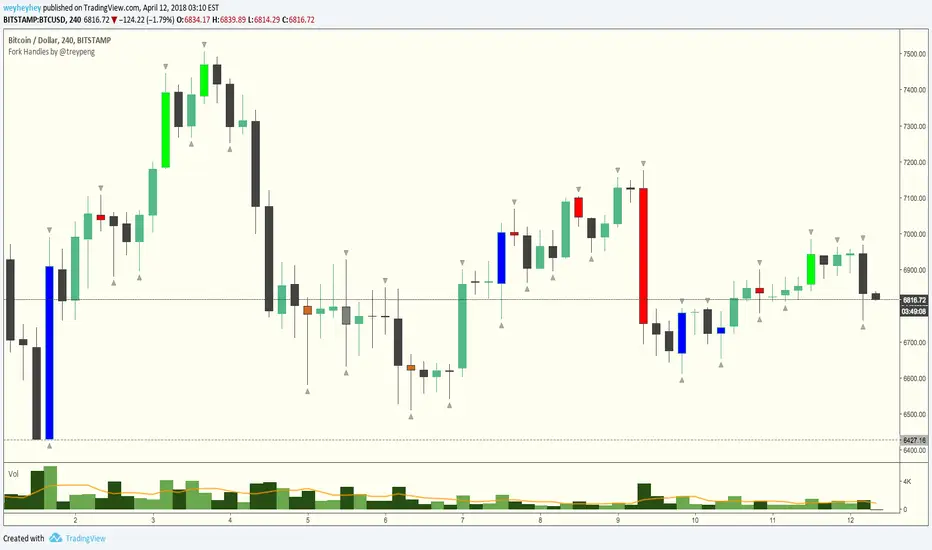
Fork Handles by @treypeng
Candle based indicator that shows swing highs and lows (pivots).
It draws an up or down arrow for simple three candle 'single' swings.
For stronger five candle 'double' swings, it colours the candle. Good for highlighting stronger reversals.
Both of these stylings can be toggled on/off individually.
Default colours
Swing HIGH on an UP candle: bright green
Swing HIGH on an DOWN candle: bright red
Swing LOW on an UP candle: blue
Swing LOW on an DOWN candle: brown
Double swings are grey or white.
Regular candles are just kept to your own default colours as specified in the chart settings.
👏 for anyone who gets the 'fork handles' joke reference.