MTF Deviation - Mtrl_ScientistHi everyone,
There are a lot of possible ways to look at markets and find valid patterns.
This time, I've looked at how shorter time frames deviate from the overall price consensus.
What you're seeing here is a range-bound difference of the lowest time frame from the overall price consensus (baseline), represented as blue line.
When lower time frames agree with the baseline, the difference becomes 0.
Logically, this difference cannot deviate too much from the baseline, and to quantify that, I've added fib-levels based on a deviation percentage that depends on price volatility and can be adjusted in the settings.
How it works:
First of all, you need to switch to the 1min time frame to get access to the lowest time frame data.
Look at how the blue line follows the support/resistance fib levels.
Oversold conditions are usually given by entering the lowest red band, whereas overbought conditions are given by entering the upper red band.
However, there are also extreme cases, where the blue line exceeds the set fib levels. In that case, price will reverse with very high likelihood.
Alternatively you can also ping-pong between two fib levels for frequent small trades.
Note that this indicator doesn't use any security functions to access time frame data. Instead, I found a different way to avoid repainting.
At the moment I'm just playing around with this to see how I can improve it. Feedback is very welcome!
BTC

XRPBTCBITFINEXLONGCHANGEBTC建てのロングポジションの変化を示します。
ゼロラインよりも上側のヒストグラムは、ロングポジションの増加を意味します。
ゼロラインよりも下側のヒストグラムは、ロングポジションの減少を意味します。
市場心理を推測し、今後の値動きを予想することに役立ちます。
機械翻訳 Machine translation
The change in long position of BTC is shown.
The histogram above the zero line means an increase in long position.
The histogram below the zero line means a decrease in long position.
It is useful for estimating market psychology and forecasting future price movements.

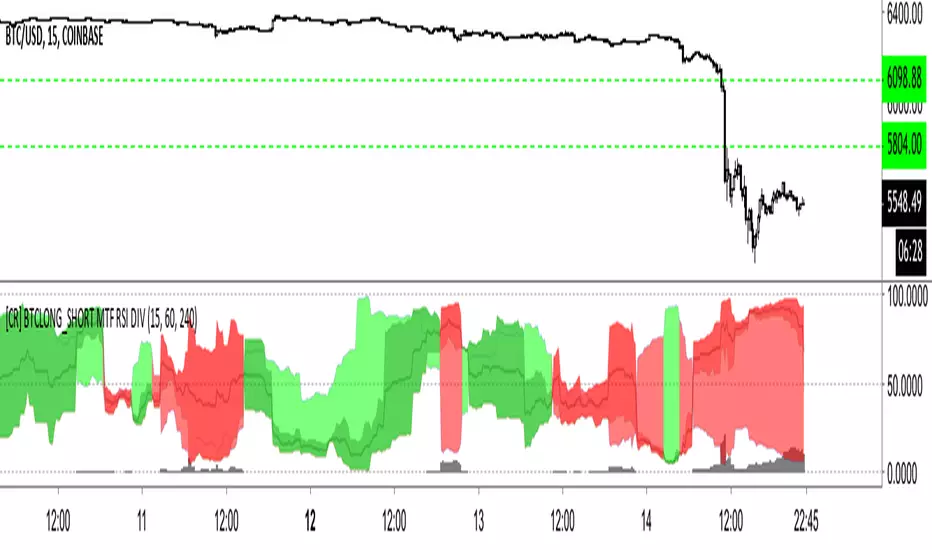
[CR] BTCLONG_SHORT MTF RSI DIVComparing BTCLONG and BTCSHORTS RSI on BITFINEX
+MTF
+RSI
+Difference
Simple indicator to show long/short contract association, including relative difference.

[CR] BTCLONG_SHORT MTF RSI DIV+ MTF x 3 BTCSHORT and BTCLONG on BITFINEX RSI
+ SHORT vs LONG RSI + Difference
This indicator demonstrates the difference between BTCLONG and BTCSHORT values on BITFINEX and compares their relative difference also in RSI.
Red = SHORT > LONG
Lime Over Green = LONG > SHORT difference RSI greater than LONG vs SHORT RSI.
Red Over Darker Red = SHORT > LONG difference RSI greater than SHORT vs LONG RSI.
Black trend line = Total SHORT/LONG RSI
Grey Columns = Total RSI / Difference RSI
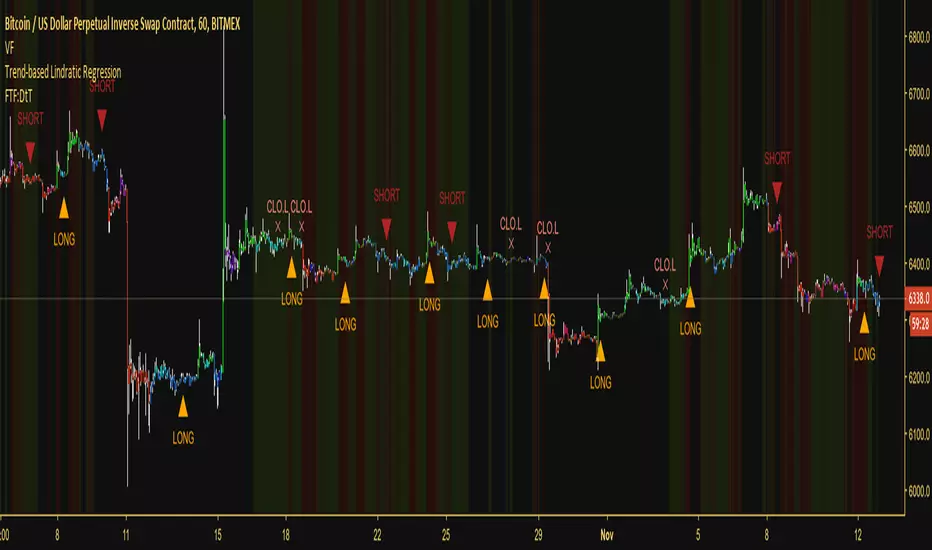
Trend-based Lindratic RegressionThis is an effective trend-following script that uses a finite volume element, linear regression, quadratic regression and multiple EMAs to define appropriate times to enter and exit the market. It can be applied to any asset that has volume data available for it.
As it follows the trend it's a very low-risk strategy, but it's not made to catch and ride reversals. It would rather close a long at the top and close a short at the bottom, although this means you can expect not to be stopped out on any trade you take.
Works on any timeframe, although I did create this with the intention of scalping, so shorter timeframes are recommended.
Combined with a volatility filter, this would be a very effective script, allowing you to stand away from the market during flat periods and trading with the trend during exciting periods.
Access to the script will be grated for 10$ of most low-fee cryptocurrencies, as well as BTC. If you're interested reach out to me through TradingView or, alternatively, contact @overttheraibow through Telegram.
If there's enough demand for it, I will also create a strategy version of this study which will be given for free to those who purchased the script. As always, maximum 250 places available.
Good luck!
VolumeChart BTC Volume Powered by BotBoys [v09/11/2018]Btc global volume by volumeChart team (BotBoys).
Takes volumes of all exchanges with BTC.
It includes Europe, EEUU, Asia and South-America.

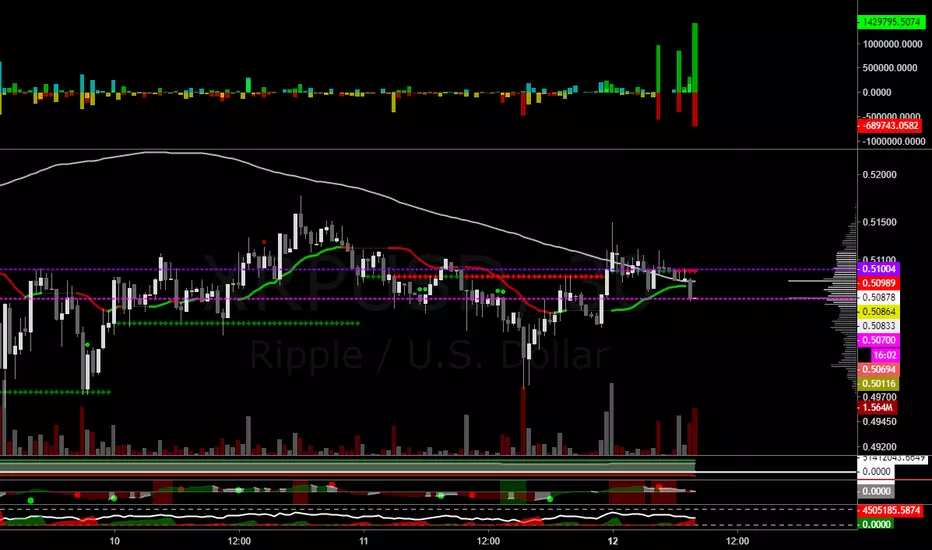
Bitfinex Margin ΔShows long/short position changes per chart period
Works for all Bitfinex margin pairs
Red = Short Open
Yellow = Long Close
Cyan = Short Close
Green = Long Open
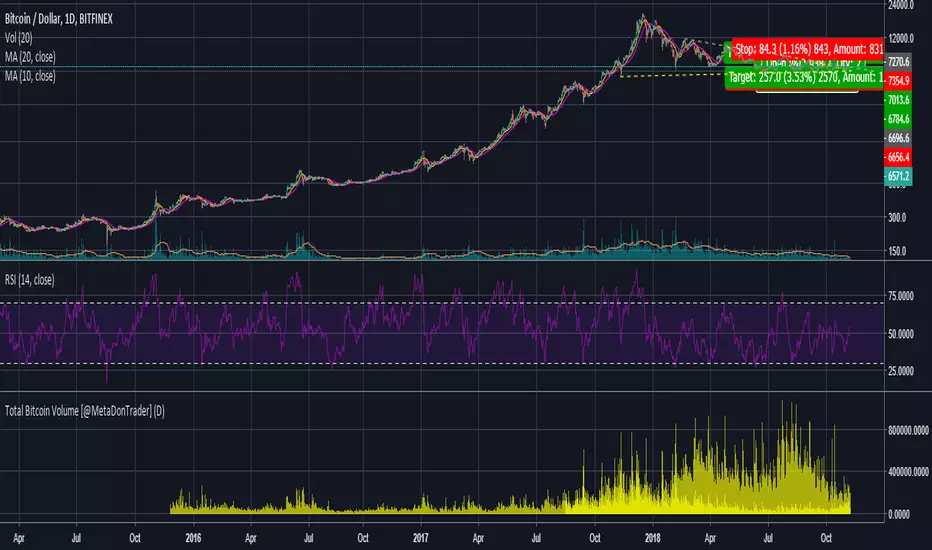
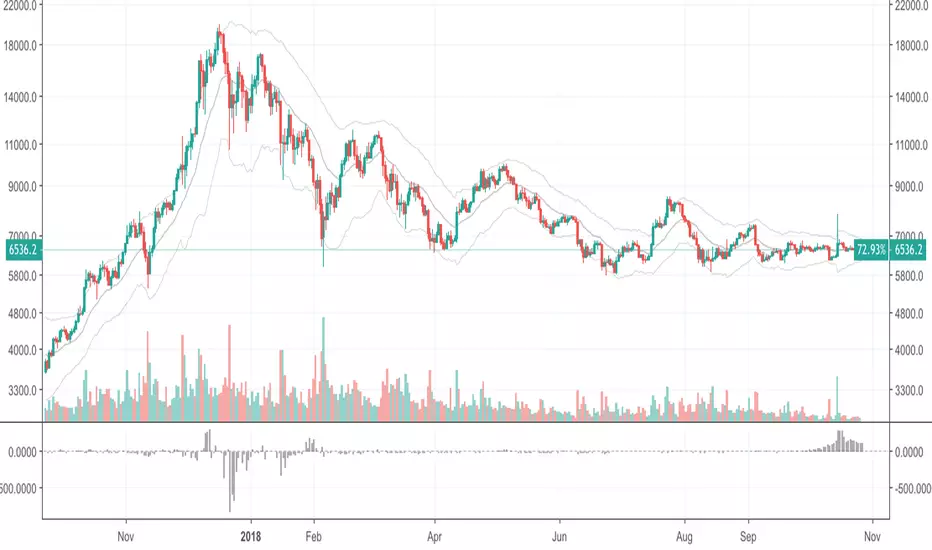
Total Bitcoin Volume [@MetaDonTrader]Aggregates all the bitcoin volume from different exchanges. Note that new exchanges like Binance and Bitmex will have an affect on this data as well. Who's to say how much of it is legit and how much is wash trading.
BITCOIN-INDEX- (*Beta Version*) _BTCXjust like the dollar index and any fiat currency index , this is Bitcoin index , But this is still Beta Version and just Demo

Crypto Correlations HeatmapHello friends,
This tool is designed for crypto traders who want a fast, visual way to understand how different coins move relative to each other. It builds a correlation heatmap between your current chart symbol and a customizable list of crypto pairs, helping you immediately see which assets tend to move together, move opposite, or behave independently.
🛠️ How It Works
You provide a comma-separated watchlist of cryptocurrency tickers (for example, a list of USDT or USD-margined pairs). The script then:
Filters this list using your chosen Display Mode - All pairs, or only BTC, ETH, USDT, or USDC-related pairs.
Splits long watchlists into pages of up to 40 tickers , so you can smoothly navigate large universes of coins using the page selector.
For each symbol on the active page, it calculates the Pearson correlation over a user-defined lookback period, based on your selected Correlation Source (close, alternative price averages, or other supported inputs via the custom source module).
The results are rendered as a color-coded heatmap: color and intensity reflect both the strength and direction of correlation with your chart symbol.
You can switch between multiple professional color palettes to fine-tune how positive, negative, and neutral correlations are visually separated on the chart.
🔥 Key Features
Custom watchlist input via a simple text area (paste long lists directly from your exchange or screener)
Pagination support - view up to 40 tickers per page for stable performance
Flexible Display Modes : All pairs, BTC pairs, ETH pairs, USDT pairs, USDC pairs
Adjustable correlation lookback length
Advanced correlation source selector via the custom source module
Multiple color palettes : Blue/Red, Blue/White/Red, Green/Pink, Green/Red, Green/Yellow/Red, Purple/Orange, Spectral, Viridis
Clear visual mapping of correlation strength and sign using color intensity and hue
👋 Good luck and happy trading!

Quantum All in One Crypto Indicator V1Quantum All in One Crypto Indicator V1
Features
6 EMA
6 MA + Slow & Fast
Ichimoku
Bollinger
Fractals
CDC Strategy
Colored Bars
Pivot´s and more..
have fun
Version V1.5 in Progress
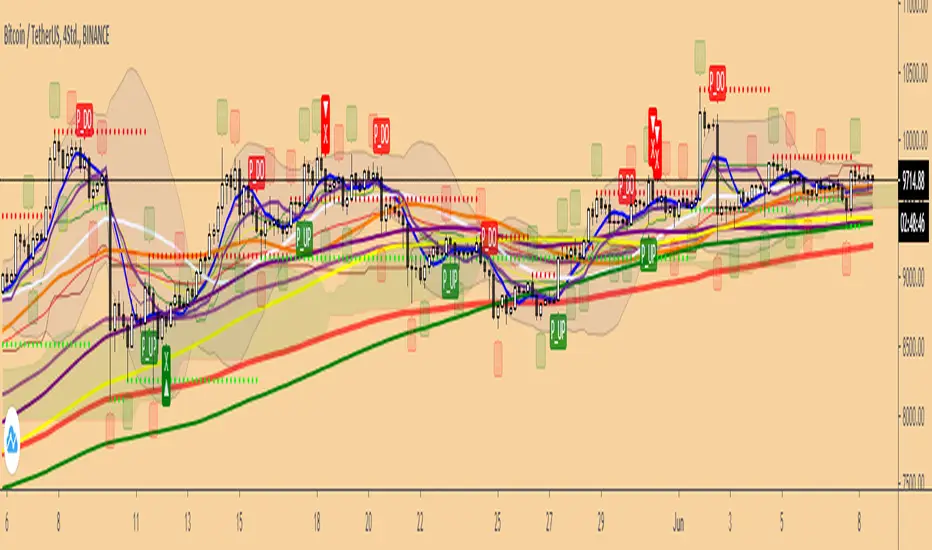
Trend Precognition - Mtrl_Scientist (arrow-only)Hey everybody,
Per request, I'm also adding the arrow-version to the updated base algorithm.
However, I advise everyone to also add the indicator version that I published previously.

ATR Entries & Stop Loss [Jigga]This is a simple script that displays multiples of ATR and shows you where the potential zones for longing and shorting are. The majority of people use ATR as a stop loss, so we can use it for our advantage and get in when they are stopped out. There is also a possibility to add a stop loss, so a trader can lose little when he is wrong and maximize profit when he is right. It works the best in ranging markets.
Do not forget to always use a proper stop loss and risk management.
Here you can see it in action:
BTC - BitMex - Range bound market

RSI Multi Time Frame [Jigga]This indicator simply displays RSI on 4 time frames. You can configure individual RSI lengths as well. The first two RSIs are more visible to prevent clustering. It is possible to define oversold / overbought areas and the script displays the middle line as well.
A couple of use cases:
Comparison of 7, 12, 18 and 24 RSIs on a given time frame
Comparison of 14 RSI on 30m, 1h, 2h and 3h time frame (Default settings)
Please, always use a proper stop loss and risk management.
Here you can see it in action:
BTC - BitMex
BTC - BitMex

RSI Bands Multi Time Frame [Jigga + LazyBear]This is a modified version of LazyBear's RSI Bands script. I added the possibility to display multiple RSI bands, so you can see the zones, where it is viable to enter a long or a short. You can also use different time frames, so you can visually see where any specific value of RSI is for your given time frame. This gives you a lot of possibilities. Default settings use 1h time frame and the most common reversal areas for RSI. Feel free to change the settings as you see fit. If the script makes your candles too small, you can go to style and turn off individual RSI bands. After that you will still be able to see the zones, but the scale of your chart won't be affected.
It also displays the middle line, which shows you the current trend and can prevent you from entering a long, when RSI is oversold during a strong downtrend or a short, when RSI is overbought during a strong uptrend.
Do not forget to use a proper stop loss and risk management.
Here you can see it in action in different markets:
BTC - BitMex
NASDAQ Composite - Stocks
EUR / USD - Forex

BTC South Korea_PricesSince BTC prices are diverging, this set of 4 indicators charts volume-weighted prices for different exchanges:
Spot, Tether, Futures and South Korea.
I tried doing EUR & JPY, but the divergence is minimal so its a little pointless.
Here is the 4 links:

BTC Futures_PricesSince BTC prices are diverging, this set of 4 indicators charts volume-weighted prices for different exchanges:
Spot, Tether, Futures and South Korea.
I tried doing EUR & JPY, but the divergence is minimal so its a little pointless.
Here is the 4 links:

BTC Spot_PricesSince BTC prices are diverging, this set of 4 indicators charts volume-weighted prices for different exchanges:
Spot, Tether, Futures and South Korea.
I tried doing EUR & JPY, but the divergence is minimal so its a little pointless.
Here is the 4 links:
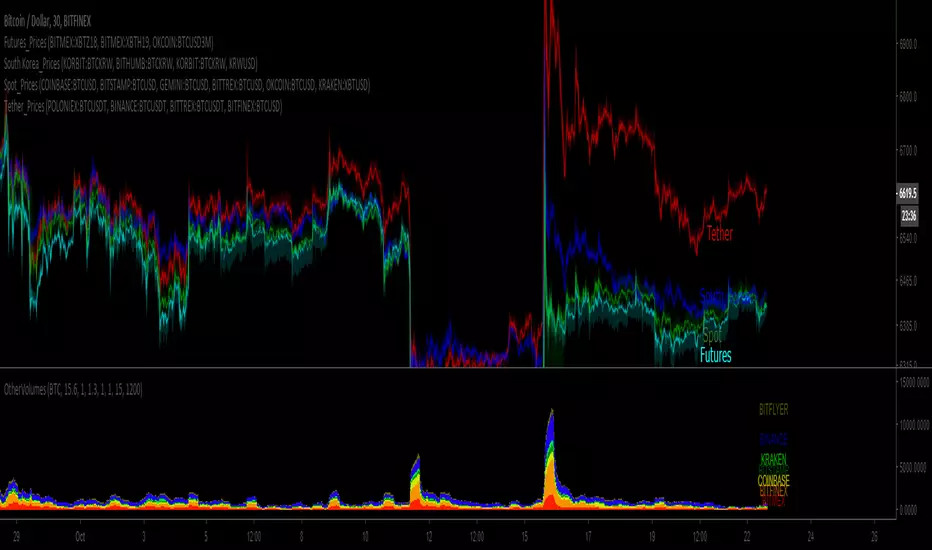
BTC Tether_PricesSince BTC prices are diverging, this set of 4 indicators charts volume-weighted prices for different exchanges:
Spot, Tether, Futures and South Korea.
I tried doing EUR & JPY, but the divergence is minimal so its a little pointless.
Here is the 4 links:

BTC Precognition - Mtrl_Scientist (Multi Time-Frame)Hi everyone,
This indicator is also based on the "BTC Precognition" algorithm, only this time, I've visualized the results on all time frames (1min, 5min, 15min,...,1W). It is supposed to give you confidence in the signals the algorithm already offers.
How it works:
The top blocks are the shorter time frames, whereas the bottom blocks are the longer time frames. As you can see, the signals gradually leak into the longer time frames when a trend is confirmed.
I'm still trying to find patterns, but the most obvious to me was that the best entry is signaled when most blocks of the same color are stacked (marked on chart).
Very good buy signals are often 7-8 green blocks (out of 10) in a row, whereas very good exit signals are 10/10 red blocks.
Note: For best results use Heikin Ashi.
This is still very much work-in-progress, so I'm only publishing it as a private build.
PM me if you want to help test and improve it.
P.S.
As it is with Trading View, accessing higher time frames can lead to repainting. After a lengthy debugging process, it looks like I fixed the repainting issue for higher time frames. However, now there's an issue with skewed calculations on the current time frame (selected time frame == block time frame), that I've only solved for the 1min chart so far (should be possible to fix on all). So please just keep that in mind. As it is now, I'd say everything is correctly displayed on the 1min chart only! You can verify this by refreshing the page and checking if any blocks changed. If they didn't, there's no repaint.
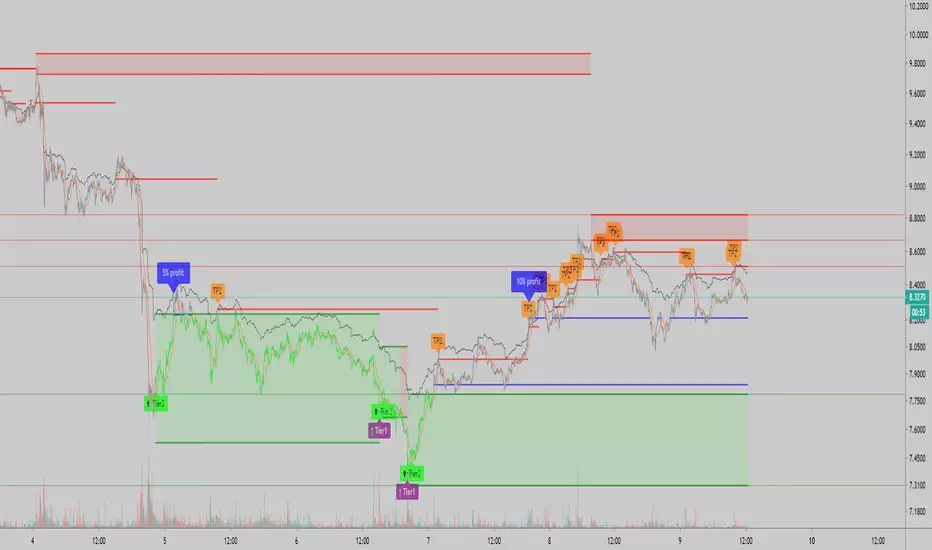

Acceleration / deceleration strategy As promised, the updated acceleration / deceleration strategy.
Added switchable shorts (for exchanges with no margin) and more understandable settings.
The idea of the strategy is to look for the distance between the fast and slow SMA. When it decreases, there is a slowdown in price growth and a change in trend, and at the moment it predicts well the breakdowns of Bitcoin.
In the settings you can configure length of fast SMA, the length of the slow SMA is calculated as the length of the fast + diff. Usually, I pick up the fast SMA length, and then looking for the optimal diff. TrendChangeCandles indicates how many columns are needed in order to form a signal. 1 - the signal will be at each slow/acceleration event, we need to filter it, otherwise there will be a lot of unnecessary signals.
At the moment I have a bot that works on the default settings on the Bitmex exchange, and it gives good results. However, I think it is possible to find other settings for other pairs or timeframes (at least 15 minutes) that would give good results.
