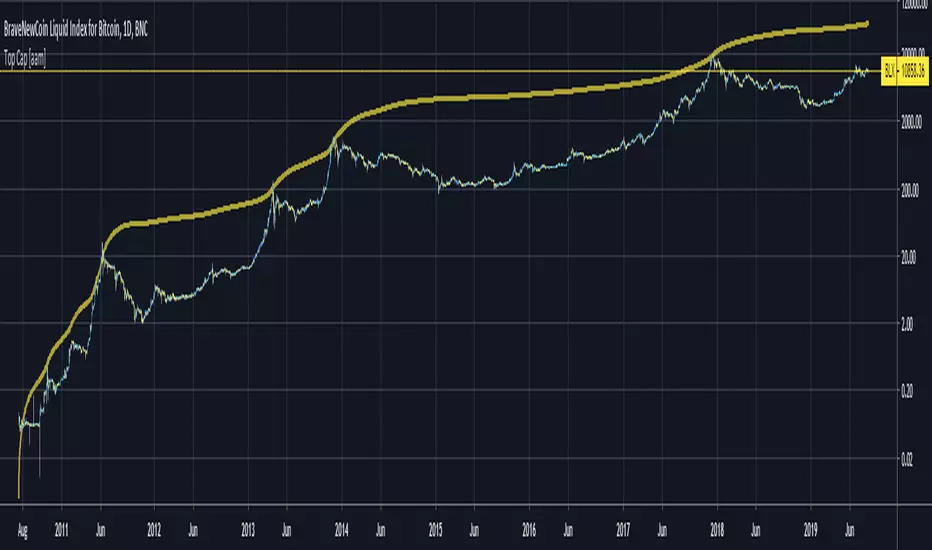
Top Cap [aamonkey]Historically matched market tops for BTC.
It's the Average Cap (see my other indicator) multiplied by 35.
The default settings are for BTC.
If you want to test this indicator on another chart you have to change the launch date settings (and maybe play around with the multiplier).
Some Interesting Launch dates:
- BTC: 3 JAN 2009
- ETH: 30. JUL 2015
- LTC: 7. OCT 2011
BTC-D

RSI Top & Bottom Warning [aamonkey]An enhancement of my RSI Bottom Indicator.
This one finds you Tops & Bottoms.
This indicator uses the RSI and prints you top & bottom warnings directly on the price chart.
The other special thing about this is that the RSI pulls the data from the weekly chart no matter on what timeframe you are on.
The preferred timeframe can, of course, be changed in the settings as well as any thresholds for tops and bottoms.
The default settings are very good for btc, but be free to try and test this indicator with different settings on different charts.

RSI Bottom [aamonkey]This is a modified RSI that prints a bottom signal directly on your price chart.
It pulls the data (in the default settings) from the weekly chart no matter on what timeframe you are on.
You can adjust the timeframe and threshold.
Default settings work best for big BTC cycles.

Cruzamento de MM para BTC 5MSão 3 médias móveis simples.
- 9 períodos
- 21 períodos
-105 períodos
A intenção desse estudo é me dar sinais para compra quando ocorre um cruzamento da média de 9 períodos com a de 21, somente dando o sinal se o cruzamento ocorrer acima da média de 105 períodos. Para sinais de venda segue-se o mesmo raciocínio, quando a média de 9 períodos cruzar com a de 21 e estiver nesse caso abaixo da média de 105 períodos.
O que eu tenho usado e tem dado bons resultados com o BTC 5M desde o início de julho, principalmente naquelas bart formations, é utilizar apenas o primeiro sinal de venda ou de compra após o cruzamento da média de 105
O sinal que se dá para compra seria o círculo verde
O sinal que se dá para vendas seria o círculo vermelho
Este indicador tem o propósito de eu testar a efetividade de um sistema desses.

Relative Vigor IndexHere we are looking at a trend strength indicator based on the Relative Vigor Index(RVI). The RVI measures trend strength by comparing the open-close and high-low ranges for the current and three most recent periods. As a zero-centered oscillator, the RVI oscillates above and below zero to signal the strength of the trend.
As there are different ways to interpret the RVI, we have included 3 different modes for traders to choose from in the input option menu:
1. Zero-Crossing:
The RVI Histogram will turn green when it crosses above zero and red when it crosses below. Therefore, a green RVI means the trend is bullish and red means bearish. This mode is better for longer-term swing trading in comparison to the other 2 modes.
2. Increasing / Decreasing:
The RVI histogram will turn green when it is increasing(rvi >= rvi ) and red when it is decreasing. A green RVI is viewed as a bullish signal and red means bearish. This mode is a good middle-ground between the Zero-Crossing and Signal Comparison modes.
3. Signal Comparison:
Here, the RVI is compared to its signal line. If the RVI is greater than its signal line, the histogram is green, indicating a bullish trend, while red means bearish. This mode is preferred for scalping.
Hope everyone finds this one useful!
You can check out our other invite only studies/strategies at our website: profitprogrammers.com

TOP & BOTTOM Cycle [aamonkey]Works best on BTC and only on the daily timeframe!
This is a TOP / BOTTOM indicator for big market cycles.
These tops and bottoms are based on the difference between the 200MA on the daily and the price.

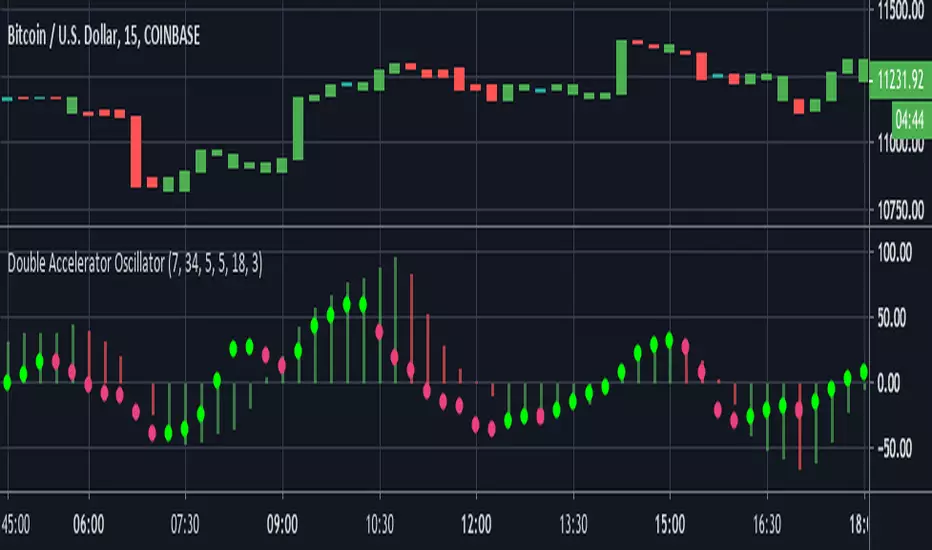
Double Accelerator OscillatorThis is a modified version of Bill Williams' Accelerator. The Accelerator measures the difference between the Awesome Oscillator(another Williams indicator) and its 5 day SMA.
This script plots 2 accelerators rather than 1. Users can define the lengths of the fast and slow SMA's used in the Awesome Oscillator calculation by adjusting the options in the input menu.
We set the default the lengths of the fast and slow SMA's used in the first Awesome Oscillator calculation as 34 and 7 periods. Then to find the Accelerator Oscillator, the difference between the Awesome Oscillator and its 7 period SMA is calculated. The second Accelerator uses shorter window lengths than the first. The fast SMA length is 5 by default and the slow SMA length is 18. Finally, the length of the Awesome Oscillator SMA used to calculate the second Accelerator Oscillator is 3.
By utilizing two Accelerator Oscillators with increasingly shorter window lengths, this indicator identifies changes in momentum very well.
The red and green histogram represents the first Accelerator Oscillator. It is green when the Accelerator is increasing and red when it is decreasing. I found this layout to be more practical than the standard, which plots the AC as green when it is greater than 0 and red when less than zero. The second Accelerator Oscillator is plotted as the bright green and pink circle line. It uses the same coloring conditions as above.
MACD Profit CandlesThis tool is simple yet very effective. It creates new candles on the chart based on the MACD.
Candles are green when MACD is increasing and red when it is decreasing. All lengths can be adjusted in the input menu and there is an option to plot the signal line.
The rules for using it are pretty simple:
1.Buy on Green
2.Sell on red
~Happy Trading~

Volatility Index Oscillator LargeCap [aamonkey]There are two versions of this indicator (Large and Small Cap).
Both work exactly the same the only difference are the default coins selected.
What does this indicator do?
- can be used on any timeframe
- plots the percentage change of the candles of the selected timeframe of 9 LargeCap coins (Default: ETH, EOS, TRX, IOTA, XLM, ADA, ATOM, Tezos, BTC)
- +1 line for the chart you are currently on (Default: red line)
Why use this indicator:
- compare selected coins to the LargeCap coins in terms of volatility
- see correlations in price movements
- see which coin outperforms the others
- find coins that are behind
Settings:
- pairs, exchanges, and colors changeable
- always write the pairs and exchanges in caps!

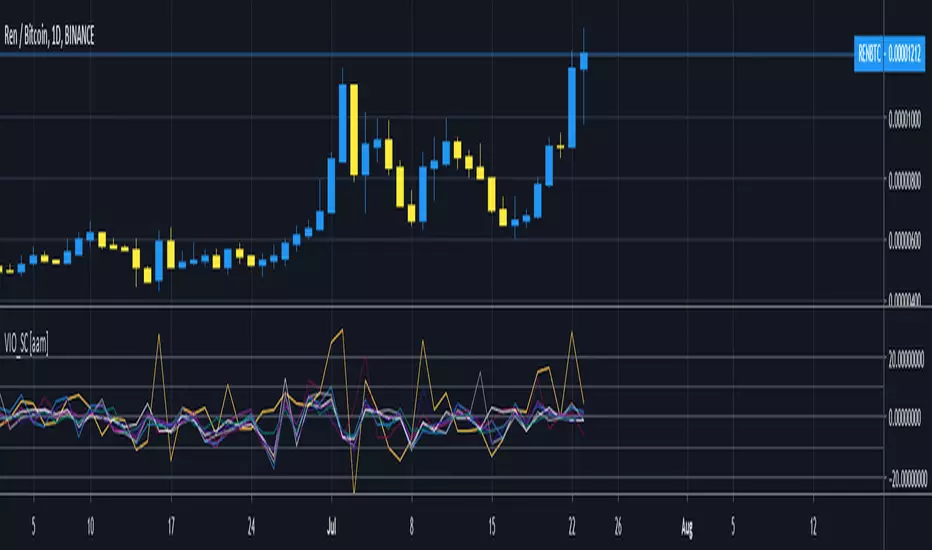
Volatility Index Oscillator SmallCap [aamonkey]There are two versions of this indicator (Large and Small Cap).
Both work exactly the same the only difference are the default coins selected (and this version compares only 9 coins in total instead of 10).
What does this indicator do?
- can be used on any timeframe
- plots the percentage change of the candles of the selected timeframe of 8 SmallCap coins (Default: REN, LOOM, MANA, ENJ , KNC, ZRX, BNT, REP)
- +1 line for the chart you are currently on (Default: red line)
Why use this indicator:
- compare selected coins to the SmallCap coins in terms of volatility
- see correlations in price movements
- see which coin outperforms the others
- find coins that are behind
Settings:
- pairs, exchanges, and colors changeable
- always write the pairs and exchanges in caps!
Triple Coppock CurveThe Coppock Curve is a zero-centered momentum oscillator that relies primarily on rate of change calculations. The Coppock Curve in its most basic form is already a great indicator, especially for spotting shifts in momentum. But, we wanted to see how we could modify it to get some better performance out of it.
As the ‘cop’ function demonstrates, the Coppock Curve has a pretty simple calculation. The first step is to calculate the rate of change at a longer and shorter window length. Next, the sum of the two rate of change values is calculated and finally a weighted moving average of a user defined length is calculated(this is the Coppock Curve).
The ‘cop()’ function set the foundation to allow us to implement our modifications. As you can see in the graph, there are 3 different lines (2 histogram and 1 normal line) comprising the Coppock values based on the rate of change of high, low, and closing prices. We liked this layout because it allows traders to easily identify the curve’s pivots and the balance of negative vs. positive momentum.
The Coppock Curve based on high prices is plotted as the teal histogram, wile the pink histogram represents the Coppock Curve of low prices. The curve based on closing prices is the red and green alternating line plotted on top of the two histograms.
We included some notes on the chart to help with interpreting the three curves.
There are two common approaches traders can take when trading with the indicator:
1. Trade based on closing price curve: Go long when line changes from bearish(red) to bullish(green). Then, go short when same line changes from bullish to bearish.
2. Trade based on crossings of the zero-line. This could be based on the high, low, or closing price curves, but closing price is the safest bet. So, go long when it crosses from negative into positive territory and short when it crosses under the zero line from positive into negative territory.

Brandon BollSecond day at Pinescript and I am attempting to tweak the Bollinger Bands directed strategy to send alerts to Zignaly in order to automate long buy/sells.
I've left in the short script though for completeness.
The buy and sell instructions work perfectly but I don't know how to do a cancel order alert (as included in the original strategy)

Bitcoin Prices InfoPanelHello traders
This script is based on the great Ricardo Santos InfoPanel script
It will display all the Bitcoin prices
The script is public so you can adjust according to your own needs
PS
You might have to scroll right on your chart to see the panel
Enjoy :)
Dave

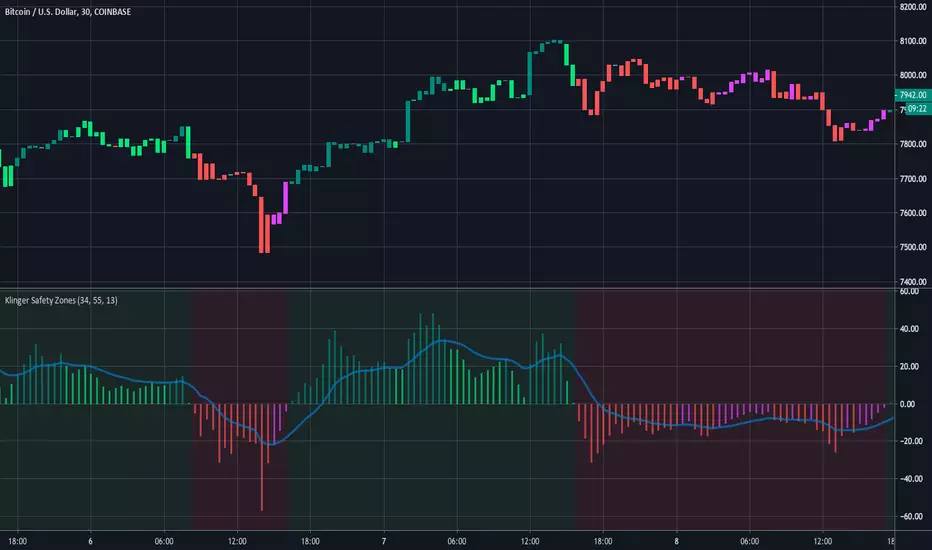
Klinger Safety ZonesThis indicator is based on the Klinger Volume Oscillator, or KVO. The KVO is pretty cool since it can track long-term changes in money flow (both into and out of a market), as well as respond and predict short term price fluctuations.
The Klinger Oscillator determines the direction (or trend) of money flow based on the high, low, and closing price of the security. It then compares all three values (HLC/3) to the previous period’s values to determine how volume should be factored into the KVO. If the current period’s price is greater than that of the previous period, then volume is added. It is subtracted, however, if the price is less than the previous period. This utilization of volume is what makes it an accurate tracker of money flow and a valuable confirmation indicator. This value is often called volume force or the “trend” line.
A fast and slow EMA of the volume force are then calculated. The fast EMA has a smaller window length, while the slow EMA has a larger window. Traders can adjust the lengths of each EMA in the input option menu, but we chose the standard 55 and 34 period lengths as the default settings. We are finally left with the actual KVO value after subtracting the slow EMA from the fast EMA.
The Klinger Oscillator uses a signal line similar to the MACD and many other indicators. The default length for it is 13, but that length can also be adjusted in the input menu. A shorter length will result in more responsiveness but possibly more false signals and whipsaws.
The Chart and Interpretation:
The histogram shows the KVO series. Remember, since the Oscillator represents the difference between the fast and slow EMA, the KVO is bullish when it is greater than zero and bearish when it is less than zero.
When the KVO is greater than zero, the background on the chart is green, meaning that the trend is bullish and traders should look to go long. On the flip side, the background is red when the KVO is less than zero meaning traders should look to go short.
The aqua line plotted on top of the histogram is the signal line.
Here is a quick summary of the histogram colors:
(if KVO > 0 and KVO > signal)
then (color = teal)
if (KVO > 0 and KVO < signal)
then (color = lime)
if (KVO < 0 and KVO < signal)
then (color = red)
if (KVO < 0 and KVO > signal)
then (color = pink)
Users can choose to have the candles change color to match the KVO histogram color by adjusting the setting in the input menu.
~Happy (and safe) trading~
ALMA Trend DirectionHere is a very simple tool that uses the Arnaud Legoux Moving Average(ALMA). The ALMA is based on a normal distribution and is a reliable moving average due to its ability to reduce lag while still keeping a high degree of smoothness.
Input Options:
-Offset : Value in range {0,1} that adjusts the curve of the Gaussian Distribution. A higher value will result in higher responsiveness but lower smoothness. A lower value will mean higher smoothness but less responsiveness.
-Length : The lookback window for the ALMA calculation.
-Sigma : Defines the sharpe of the curve coefficients.
I find that this indicator is best used with a longer length and a 4 Hour timeframe. Overall, its purpose is to help identify the direction of a trend and determine whether a security is in an uptrend or a downtrend. For this purpose, it is best to use a lower offset value since we are looking to identify long-term, significant price movement rather than small fluctuations.
The Chart:
The ALMA is plotted as the aqua and pink alternating line. It is aqua when bullish and pink when bearish.
The low price for each candle is then compared to the ALMA. If the low is greater than the ALMA, then there is a bullish trend and the area between the candles and ALMA is filled green. The area between the ALMA and candles is filled red when the low price is less than the ALMA.
The difference between the slow ALMA and candles can reveal a lot about the current market state. If there is a significant green gap between the two, then we know that there is a significant uptrend taking place. On the other hand, a large red gap would indicate a significant downtrend. Similarly, if the gap between the two is narrowing and the ALMA line switches from aqua to pink, then we know that a reversal could be coming shortly.
~Happy Trading~
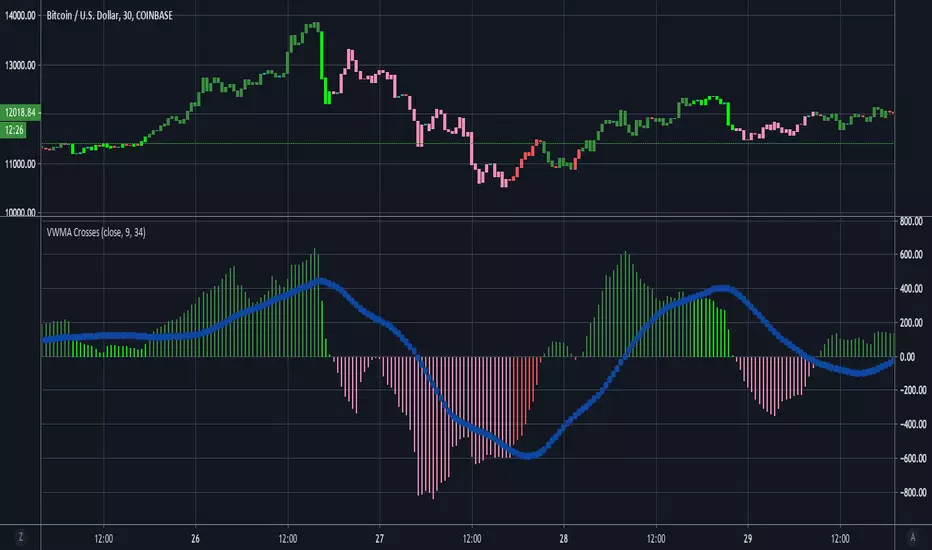
VWMA CrossesThis is a simple tool that gives traders a simple visual representation of Volume-Weighted Moving Average ( VWMA ) crossovers that is pretty similar to the MACD . We don't typically trade solely based on the VWMA , but it is definitely one of our go-to tools when combining multiple indicators.
When trading with VWMA's, it is common to enter a position when the fast VWMA crosses over the slow VWMA . In other words, the fast VWMA was previously less than the slow VWMA and is now greater in value than the slow VWMA . Conversely, traders often exit their positions when the fast VWMA crosses under the slow VWMA .
This tool plots the absolute value of the difference between the fast and slow VWMA's as a histogram. When the difference between the fast and slow VWMA's is greater than zero (meaning fast > slow), then the bars are green. The bars then turn red when the fast VWMA is less than the slow VWMA . The blue circle-line is a Simple Moving Average of the difference between the two lines.
Here's a quick guide to interpreting the chart:
if (fast VWMA > slow VWMA ) and (difference < sma of differences)
then color = lime green
if (fast VWMA > slow VWMA ) and (difference > sma of differences)
then color = dark green
if (fast VWMA < slow VWMA ) and (difference < sma of differences)
then color = light red
if (fast VWMA < slow VWMA ) and (difference > sma of differences)
then color = dark red
~Happy Trading~
Vortex Trend TrackerThough it may sound complex, the Vortex Indicator is essentially an uptrend line and a downtrend line. The vortex indicator can be used for a variety of purposes, including tracking the strength of trends, identifying/anticipating reversals, and generating entry/exit signals. It’s calculation is shown in the open-source code below.
To reduce the number of whipsaws produced by the indicator, we used an Exponential Moving Average of vmPlus and vmNegative values with a default length of 10. Decreasing this length will result in a more responsive vortex at the cost of more whipsaws and false signals.
The chart shows the absolute value of the difference between the uptrend and downtrend line displayed as the main histogram.
If the uptrend line is greater than the downtrend (thus indicating positive movement), then the histogram bars will be either light green or dark green. If the uptrend line has just now crossed the downtrend line, then the bar will be dark green. Bars will also be dark green when the uptrend line is greater than the downtrend line and the uptrend line is increasing. This means the trend is increasing in strength still. If the uptrend line is greater than the downtrend line, but is decreasing, then the bars will be light green. This means that the upwards trend is losing strength.
If the downtrend line is greater than the uptrend line, then there is a negative trend occurring and the bars will be either red or light red. If the downtrend line has just crossed over the uptrend line or is increasing in value, then the bar will be red. If the downtrend line is greater than the uptrend line, but is decreasing in value, then the bars will be light red (meaning the downtrend is weakening).
One way to trade using this vortex is to enter a long position when the bar color changes from red to light red. This would mean that the downtrend is decreasing in strength and an upwards reversal is likely to occur soon. Then, traders can exit their long position when the bars change from dark green to light green. When that color change occurs it means that the uptrend is running out of steam and price is unlikely to continue its upwards climb.
Traders can also choose to have the uptrend and downtrend lines plotted as well in the input menu. This may make it easier to visualize the Vortex and its usefulness in identifying reversals.

RSI + BTC Short & Long RSIsPlots the RSI for the current chart (same as the built-in RSI indicator) and adds the RSI values for the Shorts and Longs (S&L) from Bitmex. The main reason I've used the RSI value is to have it on the same scale as the price chart's RSI. The general trend of the S&L is preserved.
CME & XBT - BTC Futures Settlement DatesHi everyone
This in an indicator inspired by Scarrff
I added the XBT quarterly and yearly settlement dates
Enjoy
David

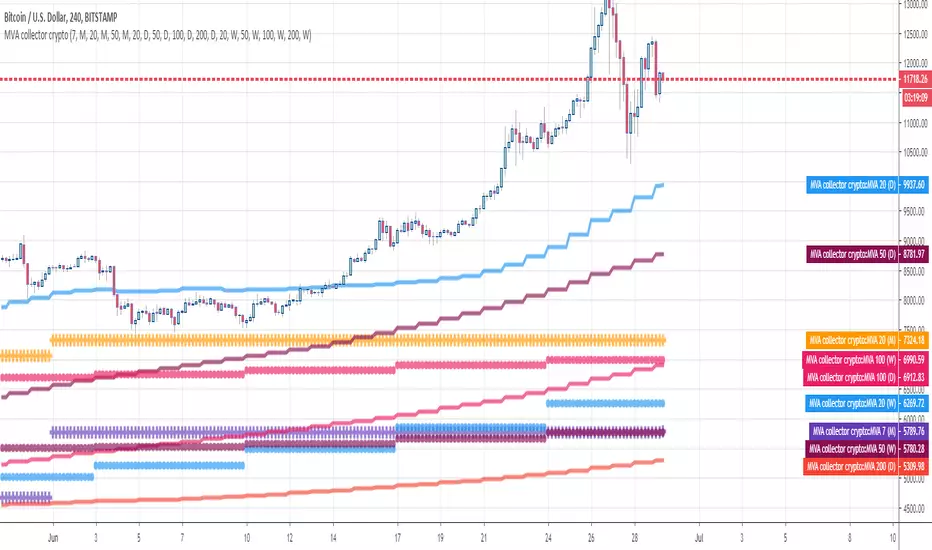
MVA collector cryptoHello Traders
This indicator draw multiple Simple Moving Averages multi-timeframes at once
I use it to define take profit zones for my crypto trading
Hope you'll like it
Enjoy
Dave
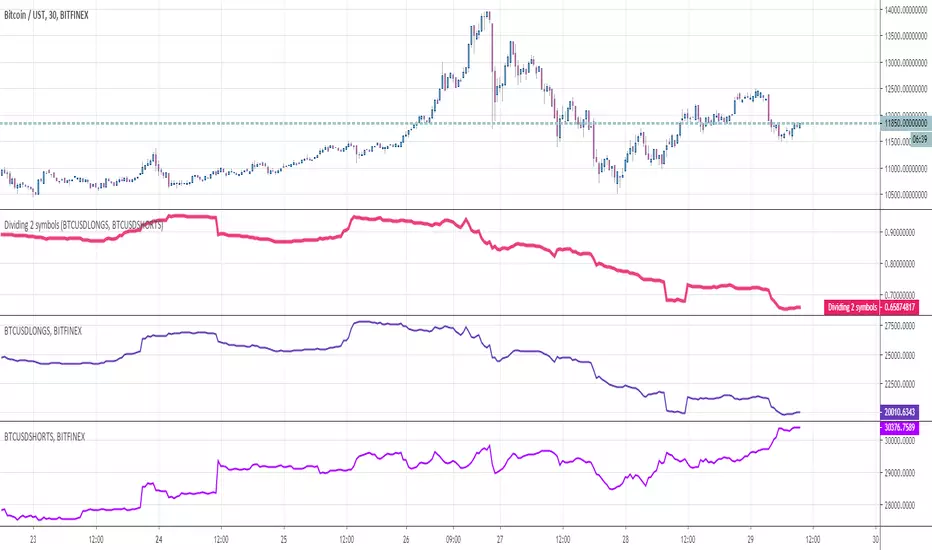
Dividing 2 symbolsHello Traders
This indicator is used to divide two assets between them. Why you would ask ?
For instance, in crypto trading, traders often look at the ratio Longs/Shorts or Shorts/Longs to figure out which side is leading the market and use this information as a powerful hedge for their next trade
Enjoy
Dave
OBV Z-ScoresThis study calculates the On-Balance Volume (OBV) and displays it in terms of its Z-Score.
OBV is a great momentum indicator . As the name suggests, OBV predicts changes in price based on the security's volume flow.
Formula:
if (Current Price > Previous Price)
then Current OBV = Previous OBV + Current Volume
if (Current Price < Previous Price)
then Current OBV = Previous OBV - Current Volume
if (Current Price == Previous Price)
then Current OBV = Previous OBV
As the formula shows, the OBV goes a step beyond just looking at the pure volume of a security. Instead, it factors in relative price action from period to period to reflect investor sentiment. As a result, we often look to the OBV to spot bullish or bearish trends while they are in the early stages of development or simply predict impending uptrends or downtrends.
To make the OBV easier to visualize, we converted the value to a Z-Score. The Z-Score is a simple statistical measurement and represents the current OBV value's distance from the mean OBV value in terms of # of standard deviations.
Users can adjust the values for the 2 upper bounds for Z Scores and 2 lower bounds. Additionally, the n value for z score calculation can be adjusted in the input menu. A higher n value means the z score will be based on a longer lookback period. A lower value will result in more sensitive readings.
Overall, I think this is an interesting way to represent OBV values and will be a valuable leading indicator.
~Happy Trading~
