TrendLine ChannelsAbstract
This script provides a set of Trendline Channels which can be tighter than Donchian Channels.
This script computes the most suitable active upper and lower trendlines and updates them as soon as possible.
We can use it for breakout signals earlier than Donchian Channels.
Introduction
Channels are tools which can mark area of values of ranging markets.
Once the price leaves the original region, range traders may start admitting they are wrong and trigger trend.
Donchian Channels (misheard as Dungeon Channels) use the highest and the lowest price to define area of values.
When the price breakouts, it just like it got released from a dungeon.
However, waiting for the price making even higher or lower may be too late and risk reward ratio may be lower.
Trendlines can make the channels tighter and we can find earlier breakout signals.
Computing Trendline Channels
(1) Find the most active trendlines
In this script, a valid trendline connects two high values or two low values.
A high value means the highest value in a trading day.
A low value means the lowest value in a trading day.
In this script, every trendline does not crossover any bar but can exactly touch them.
The most flat trendline is taken. (one for upper and one for lower)
(2) Continue to use or Change a trendline
If there is a tighter trendline available, this script changes to use it.
If the previous active trendline is broken, this script re-computes the trendline available.
When this case happens, this script display with an another color.
Otherwise, this script continues using the previous trendline.
(3) Middle line
The middle line indicates the middle value between the upper and the lower.
Parameters
Length : how many days are used for computation. The default value is 16 just because 16=4*4, using binary characteristic.
x_go_on : If the previous trendline is not breakout and there are no tighter trendlines available, we continue use it.
Color Options
(1) Upper trendline (no update or tighter)
(2) Upper trendline (changed due to breakout)
(3) Middle line
(4) Lower trendline (no update or tighter)
(5) Lower trendline (changed due to breakout)
Conclusion
Trendline Channels can be tighter than Donchian Channels and evaluate earlier breakout signals.
Comparing to known auto trendline scripts, Trendline Channels is continuous.
Once a trendline is broken, Trendline Channels can instantly point out the next available one.
If you think the price movement is boring or you cannot have good risk reward ratio, you can go to an another timeframe.
Reference
How to trade with Donchian Channels
How to trade with Trendlines
Breakout

Linear Regression ChannelHello Traders,
There are several nice Linear Regression Channel scripts in the Public Library. and I tried to make one with some extra features too. This one can check if the Price breaks the channel and it shows where is was broken. Also it checks the momentum of the channel and shows it's increasing/decreasing/equal in a label, shape of the label also changes. The line colors change according to direction.
using the options, you can;
- Set the Source (Close, HL2 etc)
- Set the Channel length
- Set Deviation
- Change Up/Down Line colors
- Show/hide broken channels
- Change line width
meaning of arrows:
⇑ : Uptrend and moment incresing
⇗ : Uptrend and moment decreasing
⇓ : Downtrend and moment incresing
⇘ : Downtrend and moment decreasing
⇒ : No trend
An example for how color of lines, arrow direction and shape of label change.
Enjoy!

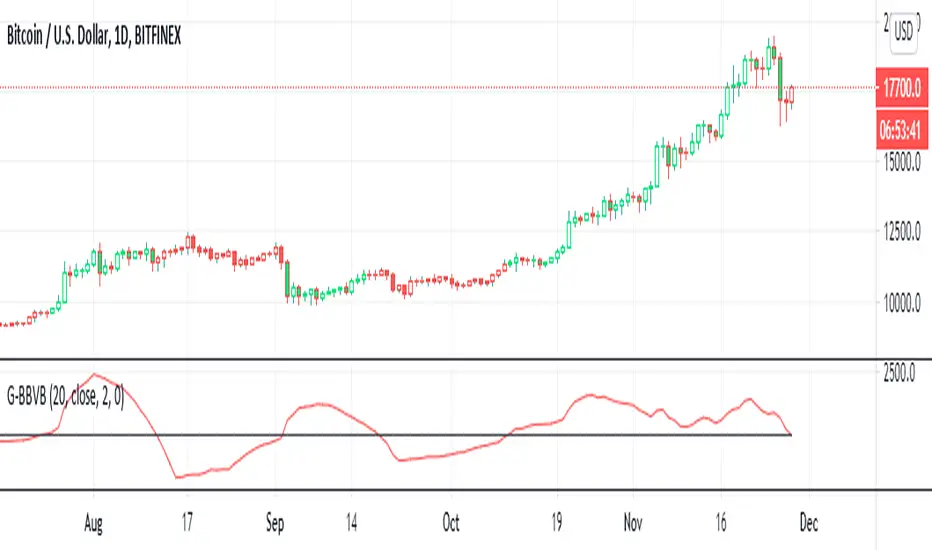
G-Bollinger bands volatility breakout v.1This is my frist publish scrpit. I developed this indicator origin is BB. It make from easy idea but powerful for sideway to breakout
1. I findout volatility by upper band of BB - lower band of BB (I called "Aline")
2. I created SMA of Aline (I called Bline)
3. I created the special line is "Cline" from Aline - Bline
4. I created 0 line " Baseline "
G-BBvB is the very good indicator to detect low volatility to begin the volatility = Buy signal
Now I can't find the sell signal form indicator. I try backtest sell at Cline cross zeroline but it not work.
I'll develop "G" indicator for free .
Goodluck :D
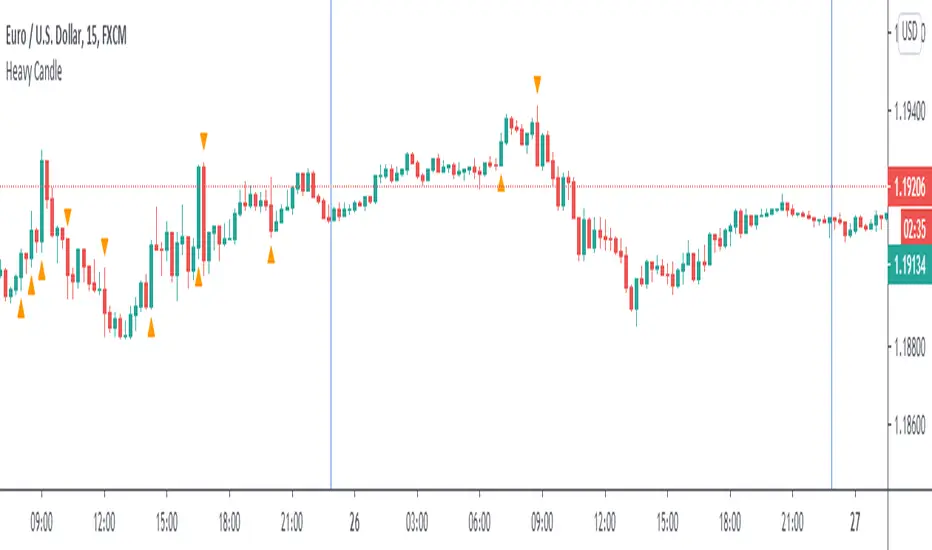
Heavy CandleHeavy Candle compares current candle size to its previous, the one before that and different Average True Ranges. The point is to objectively highlight a sizeable candle to enter the market with. The direction is based on if the close is above VWAP or below it.
To plot a signal, the new candle has to:
►Oversize previous candle times multiplier 1 one OR the candle before that times multiplier 1.
►Be higher than at least two Average True Ranges.
There is no built-in algorithm to judge the character of where the signal appears and of what quality it is. It can be used as a non-subjective entry trigger but only in conjunction with other analysis.
Traders are free to adapt the script to their needs and change the code as they see fit. Just mention me if you decide to make it public.
Session Range and Breakout Summary
This script presents the session range and post session movements relative to that range of all the majors and crosses on a single page. You can also set it to a daily range and weekly range (beta). It will even show you the pip value of the range. I made the indicator to easily stay on top of market movements at london open relative to the Asia session range. Its very easy to see which entire currency group is breaking its asia range WHIST ITS HAPPENING. Focus on NZD in the examples as it was the market lead today - I was able to get some of it when I saw the entire group breaking its range
Showing all the majors and crosses relative to the Asia range (00:00 - 07:00 GMT)
Active 'show on chart' to verify the indicator is measuring the range correctly. Compare below to the NZD box above - you can see how NZD had control of the market this morning and all NZD pairs broke out of their ranges.
'PIP MODE' - active pip mode to see what the pip range was of the session
Notes
The information is presented RELATIVELY - this means that all the ranges and movements are scaled to be the same size. You are therefore seeing the movements relative to their ranges. When you see a breakout it relative to the size of the range - for example, if GBPJPY had a range of 50pips and breaks out of the range by 100 pip and GBPEUR has a range of 20 pips and breaks out by 40 pips they have both broken out double the range and will be displayed as the same distance.
The indicator will show the movements whilst the range is forming. I did this so I can see what the groups are doing before Europe open and be ready - such as lingering at the top end of its INCOMPLETE asia range. Be aware through that if the lines are flat at the top of the range WHILST THE RANGE IS STILL FORMING this does not mean price was flat, it means that price was pushing up and growing the range. (Price can't breakout until the range has formed at the end of the session)
The currency pairs are organised to show the strength or weakness of the selected group - this means that the base currency is always the select group. This is to present the data with currencies moving in the same direction rather than some reversed but meaning the same in relation to currency strength. In the NZD example:
NZDAUD (not AUDNZD )
NZDCAD
NZDCHF
NZDEUR (not EURNZD )
NZDGBP (not GBPNZD )
NZDJPY
NZDUSD
I hope its useful. This is the most powerful indicator I've managed to write yet. It was difficult to make the code efficient enough to fit into the pinescript limit and still do everything.

Percent Drop from Highest HighBuy and hold investors may decide to use trailing stops to protect profits and capital from market crashes, especially during bull markets.
The purpose of this indicator is to hep investors to identify a location to place them. The indicator plots the highest high from 'x' bars ago. It then plots a trailing stop loss 'y' percent below that line.
The indicator enables its users to input different 'x' and 'y' values to observe what they think works best for them in different markets.
Users might choose to pair the indicator with trend confirming indicators, such as moving average cross overs, to determine that the market is trending and not ranging.
There is no magic in this indicator, only maths. Like every indicator, it has no ability to predict anything. Just because the market is doing one thing now, it might do something different later. The past does not equal the present nor the future. Make your own decisions and be responsible for them.
All the best to you and your family.

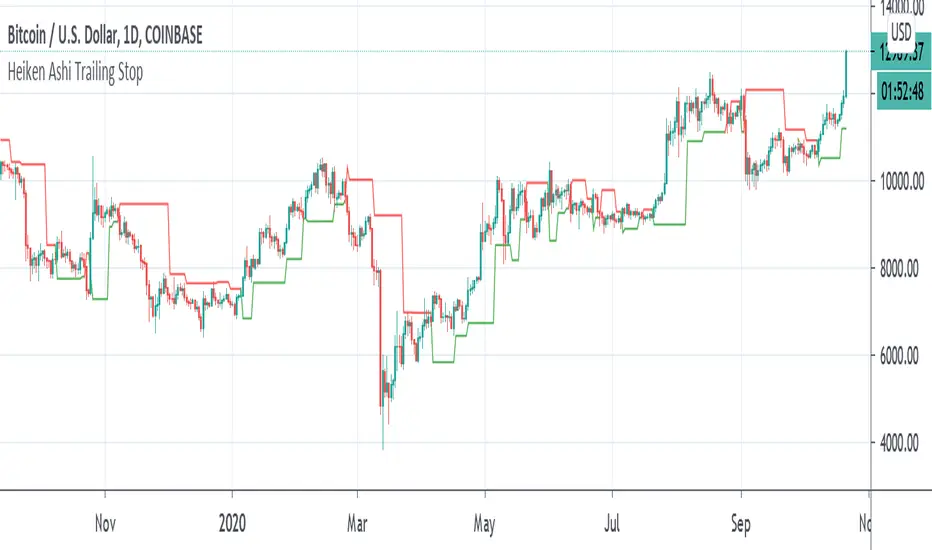
Heiken Ashi Pivot Breakout Trailing StopThis is a heiken ashi pivot based trailing stop for breakout entries and exits. It's possibly related to the Swing Index System by Welles Wilder or an alternative to it that I came up with, in case determining the swings on the Accumulative Swing Index is too much of a burden. It is believed that the ASI uses the calculation of heiken ashi in its formula. This does not use the ASI as a bottom indicator in the chart but instead uses the heiken ashi bars on the top of the chart to objectively find the swing pivots . These swings pivots act as support and resistance and can be used to confirm the start of a breakout or the end of one.
Suppose you find a chart pattern or setup, such as divergence or a pennant in the RSI , a pattern on the ASI, and/or on the chart, or the end of an elliot wave , etc and want to confirm a strong breakout and ride it to the end. Many trailing stops won't be able to confirm the beginning or would last too long or not long enough to exit out of one. On an uptrend, when the price breaks below the last swing low pivot , it can confirm the end of the breakout. On a downtrend, when the price breaks above the last swing high pivot , it can confirm the end of the breakout.
This trailing stop is not meant to replace trend following ones. The swing pivots can vary yet the price can still continue at an uptrend whereas this heiken ashi pivot based trailing stop exits as soon as it goes above or below the last resistance point. These swing points can end up being too close for trend following but can work well for breakout trading. The bigger the chart pattern or breakout, the more reliable the exit signal will be in my opinion. This is an experimental idea that I came up with from trying to interpret the ASI.
72s: Adaptive Hull Moving Average+One challenging issue for beginner traders is to differentiate market conditions, whether or not the current market is giving best possibility to stack profits, as earliest, in shortest time possible, or not.
On intraday, we've seen some big actions by big banks are somewhat can be defined --or circling around-- by HMA 200 . I've been thinking on to make the visuals more conform to price dynamics (separating major movement and minor noise) to get clearer signs of when it starts to happen. So it will be easier to see in a glance when the strength starts really taken place, with less cluttered chart.
This Adaptive HMA is using the new Pine Script's feature which now support Dynamic Length arguments for several Pine functions. ( read: www.tradingview.com). It hasn't support the built-in HMA() directly, but thankfully we can use its wma() formula to construct. (Note: I tweaked a bit HMA formula already popular here by using plain int() instead of round() on its wma's length, since I find it precisely match tradingview's built-in HMA).
You can choose which aspect the Adaptive HMA period will adapt to.
In this study I present it with two options: Volume and Volatility . It will "moves" faster or slower depends on which situation the aspect is currently into. ie: When volume is generally low or volatile readings is not there, price won't move very much, so the adapting MA will slow down by dynamically lengthen the lookback period, and vice versa, and so on.
Colour-markings in the Adaptive resembles which situation explained above. In addition, I also combine it with slope calculation of the MA to help measuring trend-strength or sideway/choppy conditions.
This way when we use it as dynamic support/resistance it will be more visually-reliable.
Secondly, and more important, it might help us traders with better probability info of whether or not a trade should even worth to be made . ie: If in the mean time market won't give much movement, any profit would also only as much. In most cases, we might better save our dime for later or place it somewhere else.
HOW TO USE:
Aside from better dynamic support/resistance and clearer breakout confirmation, MA is coloured as follow:
YELLOW:
Market is in consolidation or flat. Be it sideways, choppy, or in relatively small movements. If it shows up in a trending market, it may be an earlier sign that current trend might about to change its direction, or confirming a price broke-out to another side.
LIGHT GREEN or LIGHT RED:
Tells if a trend is forming but still relatively weak (or getting weaker), as it doesn't have volume or volatility to support.
DARKER GREEN ot DARKER RED:
This is where we can expect some good and strong price movement to ride. If it's strong enough, many times it marks a start of new long-lasting major trend.
SETTINGS:
Charger:
Choose which aspect your HMA should plug itself into, thus it will adapt to it.
Minimum Period, Maximum Period:
172 - 233 is just my own setting to outmatch the static HMA 200 for intraday. I find it --in my style of trading-- best in 15m tf in almost any pair, and 15m to 1H for some stocks. It also works nicely with conventional EMA 200, sometimes as if they somewhat work hand-in-hand in defining where the price should go. But you can, ofcourse, experiment with other ranges, broader or narrower. Especially if you already have an established strategy to follow to. As you might do with:
Consolidation area threshold:
This has to do with slope calculation. The bigger the number means your MA needs bigger degree to define the market is out of flat (yellow) area. This can be useful if needed to lighten up the filter or vice-versa.
Background colouring:
Just another colouring to help highlighting the difference in market conditions.
ALERTS:
There are two alerts:
Volume Break: when volume is breaking up above average, and
Volatility Meter: when the market more likely is about to have its moment of the big wiggling brush.
USAGE:
Very very nice BUY entry to catch big up-movement if:
1. Price is above MA. (It is best when price is also not to far distance from the MA, or you can also use distance oscillator to help out too)
2. HMA's color is in darker green. Means it's on the charging plug with your chosen aspect.
3. RSI is above 50. This is to help as additional confirmation.
Clear SELL entry signal is same as above, just the opposite.
-------------------------------------------------------
Note:
Lower timeframe of course means more noise to be filtered. Depends on the instrument, you might need to tweak the settings a bit till it conform nicely and shows lots of good trades in history. Here's another example on GBPUSD 5m timeframe:
For exit/take-profit point, you can use a second faster period static HMA. Or you can also use RSI. Here's an example:
Don't get me wrong, on few occasions I found it's still best using static MA to spot fakeouts, breakouts, etc, especially ones that's been already use widely. If that's the case or price actions seems suspicious, simply put the same value for minimum and maximum period settings, and there you have the original HMA with extra features.
For developer, check in the code if you need to customise your own charger.
-------------------------------------------------------
That's it. Hopefully this Adaptive HMA+ could at least be a good sidekick to your own strategy, as it does mine. ;)

[blackcat] L2 Swing Oscillator Swing MeterLevel: 2
Background
Swing trading is a type of trading aimed at making short to medium term profits from a trading pair over a period of a few days to several weeks. Swing traders mainly use technical analysis to look for trading opportunities. In addition to analyzing price trends and patterns, these traders can also use fundamental analysis.
Function
L2 Swing Oscillator Swing Meter is an oscillator based on breakouts. Another important feature of it is the swing meter, which confirms the top or bottom's confidence level with different color candles. The higher of the candles stack up, the higher confidence level is indicated.
Key Signal
absolutebot ---> absolute bottom with very high confidence level
ltbot ---> long term bottom with high confidence level
mtbot ---> middle term bottom with moderate confidence level
stbot ---> short term bottom with low confidence level
absolutetop ---> absolute top with very high confidence level
lttop ---> long term top with high confidence level
mttop ---> middle term top with moderate confidence level
sttop ---> short term top with low confidence level
fastline ---> oscillator fast line
slowline ---> oscillator slow line
Pros and Cons
Pros:
1. reconfigurable swing oscillator based on breakouts
2. swing meter can confirm/validate the bottom and top signal
Cons:
1. not appliable with trading pairs without volume information
2. small time frame may not trigger swing meter function
Remarks
This is a simple but very comprehensive technical indicator
Readme
In real life, I am a prolific inventor. I have successfully applied for more than 60 international and regional patents in the past 12 years. But in the past two years or so, I have tried to transfer my creativity to the development of trading strategies. Tradingview is the ideal platform for me. I am selecting and contributing some of the hundreds of scripts to publish in Tradingview community. Welcome everyone to interact with me to discuss these interesting pine scripts.
The scripts posted are categorized into 5 levels according to my efforts or manhours put into these works.
Level 1 : interesting script snippets or distinctive improvement from classic indicators or strategy. Level 1 scripts can usually appear in more complex indicators as a function module or element.
Level 2 : composite indicator/strategy. By selecting or combining several independent or dependent functions or sub indicators in proper way, the composite script exhibits a resonance phenomenon which can filter out noise or fake trading signal to enhance trading confidence level.
Level 3 : comprehensive indicator/strategy. They are simple trading systems based on my strategies. They are commonly containing several or all of entry signal, close signal, stop loss, take profit, re-entry, risk management, and position sizing techniques. Even some interesting fundamental and mass psychological aspects are incorporated.
Level 4 : script snippets or functions that do not disclose source code. Interesting element that can reveal market laws and work as raw material for indicators and strategies. If you find Level 1~2 scripts are helpful, Level 4 is a private version that took me far more efforts to develop.
Level 5 : indicator/strategy that do not disclose source code. private version of Level 3 script with my accumulated script processing skills or a large number of custom functions. I had a private function library built in past two years. Level 5 scripts use many of them to achieve private trading strategy.

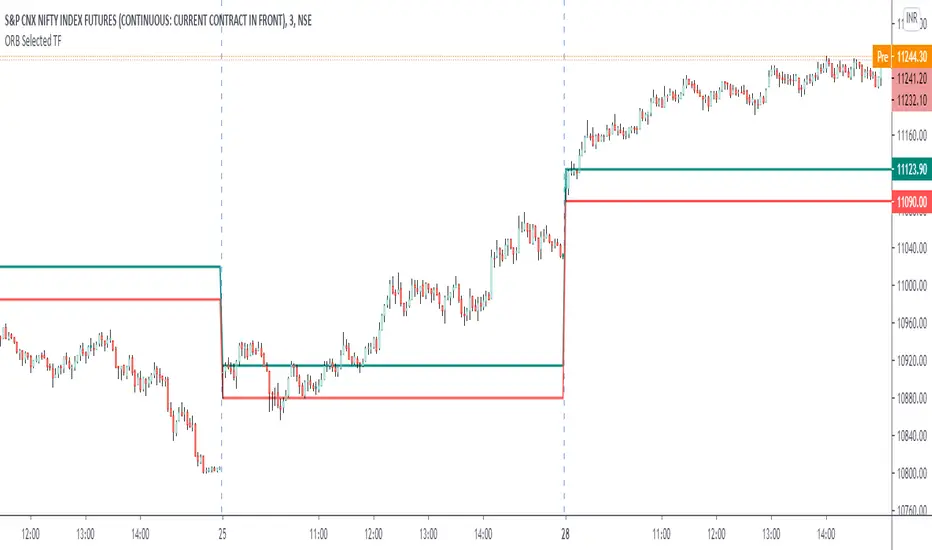
ORB Current TimeframePlot high and low of first candle from the current timeframe.
The levels are adjusted automatically when the timeframe is changed.
Trade breakout in either direction with other as a stop loss.
Can be used for any instrument.
Support and Resistance Levels with Breaks [LuxAlgo]This script provides basic pivot point Support and Resistance Levels to the user whilst displaying Break signal tags. It also has the ability to let the user display more significant breaks by filtering using the Volume Oscillator.
Only more significant breaks of these basic levels are displayed to the user when optimized which avoids noise and messy signals.
It will also display breaks with candles it deems to be bullish (e.g. having a longer upper or lower wick).
Notation
The notation of "B" denotes a break of either a Support or Resistance level with a volume greater than the threshold.
The notation of "Bull or Bear Wick" denotes a bullish or bearish candle on the break.
Settings:
Left Bars - the number of bars left hand side of the pivot.
Right Bars - the number of bars right hand side of the pivot.
Volume Threshold - the threshold value (%) for the Volume Oscillator.
Usage & Details:
Knowing when a pivot S/R level is broken with significance can be of great help to a trader. Many times significant levels may not be broken with significant force and the move is therefore weaker and possibly not worth trading.

Support Resistance - Aging [Example]Hello All,
First all of Thanks to Pine Team for adding Arrays to Pine!
In this script I tried to make example for
1. Finding S/R lines using highest/lowest function
2. Using 1D array as 2D (we keep S/R levels and age)
3. "Age" usage for S/R levels, getting older on each candle and changing colors by their age (maximum age is 127 then it disappears)
You can use "Close"/Open " or " High/Low " as source.
There is an option for the background color, by default it's Black, do not forget to set it accordingly :)
Enjoy!

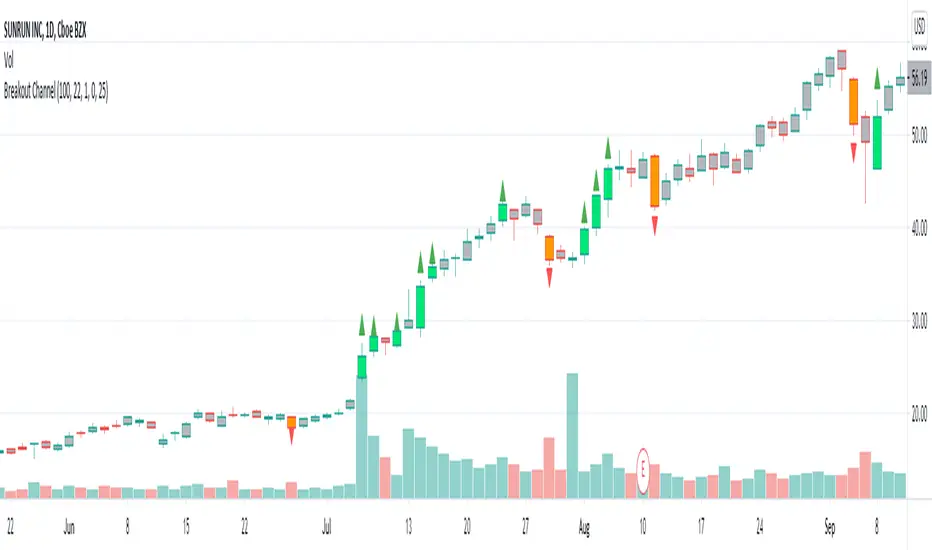
Breakout CandlesCandle is considered breakout upon two conditions:
1. Volume is higher than volume ema. Input allows you to add markup so that you can check if volume > 10% more than EMA
2. Change from previous close or distance between open and close is greater than ATR Multiplier * ATR.
Breakout color is based on whether the value of previous close is higher or lower than present close.
I would love to have wick and border color changed too. But, looks like not possible :(
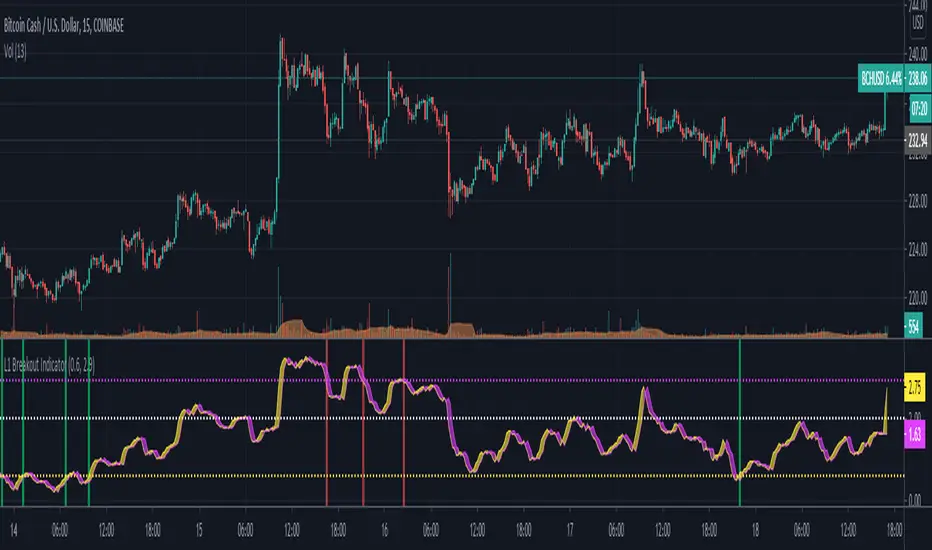
L1 Breakout IndicatorLevel: 1
Background
A breakout refers to when the price of an asset moves above a resistance area or below a support area. Breakouts indicate that the price may be trending in the direction of the breakout.
Function
L1 Breakout Indicator utilizes highest() and lowest() functions to define breakout levels. Use ema() to draw a trade line to detect the distance to breakout points. By doing that, you will know whether is overbought or oversold. Then, by applying a set of simple threshold inputs, you can locate the long and short entries points.
Key Signal
trade line and its lag version
Pros and Cons
Pros:
1. Simple but powerful to know overbought and oversold regions
2. Flexible input threshold values to adapt various market conditions
Cons:
1. It may satruate for extreme conditions of long and short.
2. Multiple long and short entries may be generated.
Remarks
Just simple
Readme
In real life, I am a prolific inventor. I have successfully applied for more than 60 international and regional patents in the past 12 years. But in the past two years or so, I have tried to transfer my creativity to the development of trading strategies. Tradingview is the ideal platform for me. I am selecting and contributing some of the hundreds of scripts to publish in Tradingview community. Welcome everyone to interact with me to discuss these interesting pine scripts.
The scripts posted are categorized into 5 levels according to my efforts or manhours put into these works.
Level 1 : interesting script snippets or distinctive improvement from classic indicators or strategy. Level 1 scripts can usually appear in more complex indicators as a function module or element.
Level 2 : composite indicator/strategy. By selecting or combining several independent or dependent functions or sub indicators in proper way, the composite script exhibits a resonance phenomenon which can filter out noise or fake trading signal to enhance trading confidence level.
Level 3 : comprehensive indicator/strategy. They are simple trading systems based on my strategies. They are commonly containing several or all of entry signal, close signal, stop loss, take profit, re-entry, risk management, and position sizing techniques. Even some interesting fundamental and mass psychological aspects are incorporated.
Level 4 : script snippets or functions that do not disclose source code. Interesting element that can reveal market laws and work as raw material for indicators and strategies. If you find Level 1~2 scripts are helpful, Level 4 is a private version that took me far more efforts to develop.
Level 5 : indicator/strategy that do not disclose source code. private version of Level 3 script with my accumulated script processing skills or a large number of custom functions. I had a private function library built in past two years. Level 5 scripts use many of them to achieve private trading strategy.
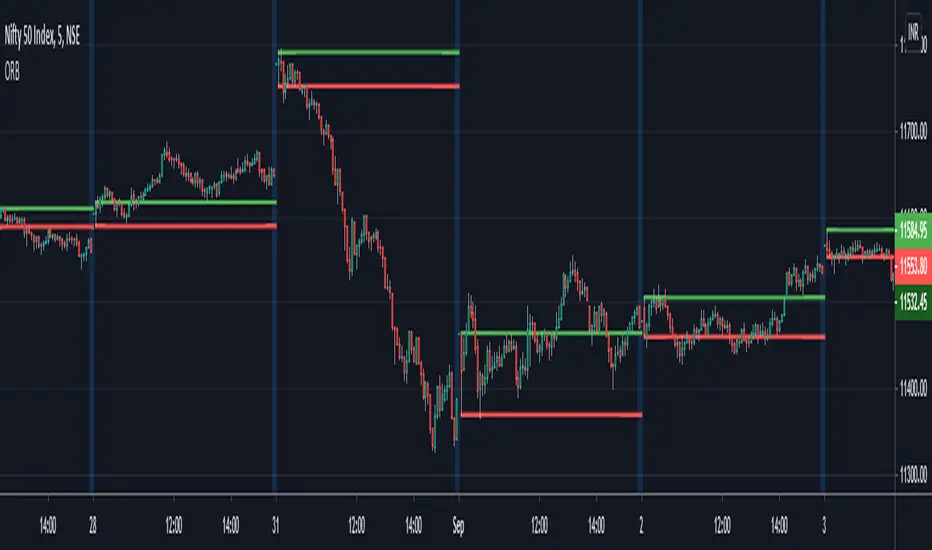
ORB - Opening Range BreakoutThis script plots the high/low of any custom session and extends it until the daily close. It does not show on the timeframe higher than the length of custom opening session by default.
The time period of opening range & the max timeframe to display it on can be adjusted from the settings.
So for eg. if want to use 5m ORB to trade, then set "ORB total time" as 5min & "Session Time" as whatever is the opening 5mins time period of ticker that are trading.
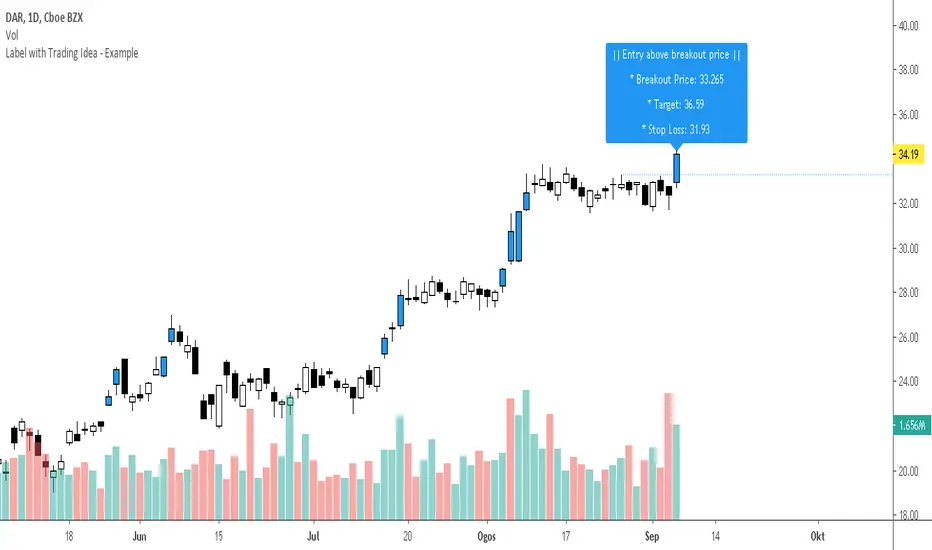
Label with Trading Idea - ExampleThis is just simple trading idea draw into chart using labels and lines.
Please use it as educational purpose and you are free to modify any part of the script.
Semoga Terhibur.
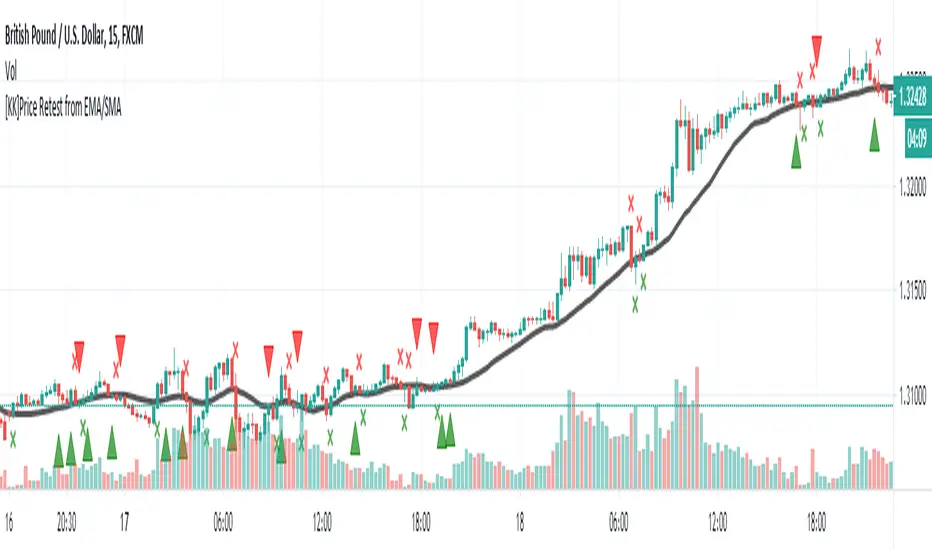
[KK]Price Retest from EMAScript show fractals on chart when price retest after breaking Exponential Moving Average.
Breakout Trend FollowerThis is a Study mirroring the Breakout Trend Follower Strategy I made. I use this one during live trading and the other for backtesting. It will also give alerts when buy and sell signals are hit.

High & Low Of Custom Session - OpeningRange Breakout (Expo)High & Low Of Custom Session - OpeningRange Breakout (Expo) prints the high and the low of a custom session.
I use the indicator to trade the re-test of opening range (high/low) as well as breakouts from the opening range. The same logic can be applied to the session you have chosen.
HOW TO USE
1. Use the indicator to trade the re-tests of the session range.
2. Use the indicator to trade breakouts of session range.
INDICATOR IN ACTION
1-min chart
I hope you find this indicator useful , and please comment or contact me if you like the script or have any questions/suggestions for future improvements. Thanks!
I will continually work on this indicator, so please share your experience and feedback as it will enable me to make even better improvements. Thanks to everyone that has already contacted me regarding my scripts. Your feedback is valuable for future developments!
-----------------
Disclaimer
Copyright by Zeiierman.
The information contained in my scripts/indicators/ideas does not constitute financial advice or a solicitation to buy or sell any securities of any type. I will not accept liability for any loss or damage, including without limitation any loss of profit, which may arise directly or indirectly from the use of or reliance on such information.
All investments involve risk, and the past performance of a security, industry, sector, market, financial product, trading strategy, or individual’s trading does not guarantee future results or returns. Investors are fully responsible for any investment decisions they make. Such decisions should be based solely on an evaluation of their financial circumstances, investment objectives, risk tolerance, and liquidity needs.
My scripts/indicators/ideas are only for educational purposes!

ALT_FLAMES00.00 - alt-flames
component breakdown:
a) various combinations of EMA crossovers taken from the primeval_series to create a complete sequence of background colored-lines that subdivide into a bullish portion
and a bearish portion for directional identification
b) specific macd crossovers for predictive power in the form of directional flames located directly above the chart price (navy & yellow flames)
c) unique fast & slow rsi combinations for momentum + strength in the form of power flames located directly above the chart price (orange, red, green, & lime flames)
when the alternation of flames are used in concert with the sequence of background colors, one can identify impending explosive price action, can better navigate through periods of slower activity, identify where they are currently in the trend's lifecycle and, MOST IMPORTANTLY, improve the TIMELINESS of entry and exit strategies
00.01 - primeval_series - overview
the primeval_series is a group of transformed universally-renowned mathematical constants that have been transformed and embedded into a series of EMAs
each of these EMAs relates in some meaningful way to the "original wave' or 'wave_0': i.e. the wave that began at t=0, when humanity first made technological progress
the transformations made ensure that the inherent linkages to the original wave remain intact while being applicable to the structures inherent to indicator development
for the purposes of the alt-flames indicator, certain numbers selected from the primeval_series exist and are the basis of each ema , MACD and RSI calculation made herein
00.02 - alt-flames - best practices, and ideal targets
for best use: start with the daily timeframe for broad pattern, then use hourly going forward
ideal for swing trades, shorter-term options, and stocks that already have well-established uptrends, but have also started consolidating for 1+ week
patience is required to catch the ideal break, so best to use mildly OTM calls with at least 2 weeks on them before expiry.
for great use: pick out stocks that have recently broken out heavily from their pivot . Do not enter until the retracement from the top has a defined local low
for average use: any sort of intraday play. this tool is meant for swing trades and sustained breakouts. picking out significant bottom reversals.
the MACD portion is not geared for big reversals here. Rather, it is complementary to the EMA sequences, which are at the core of the indicator
not useful for: shorting stocks that are trending downward or that are in sideways trends

Pre-session rangeSimple tool to capture high and low of pre-session period (not restricted to stock market, by any means!) and then plotting it on your trading session time.

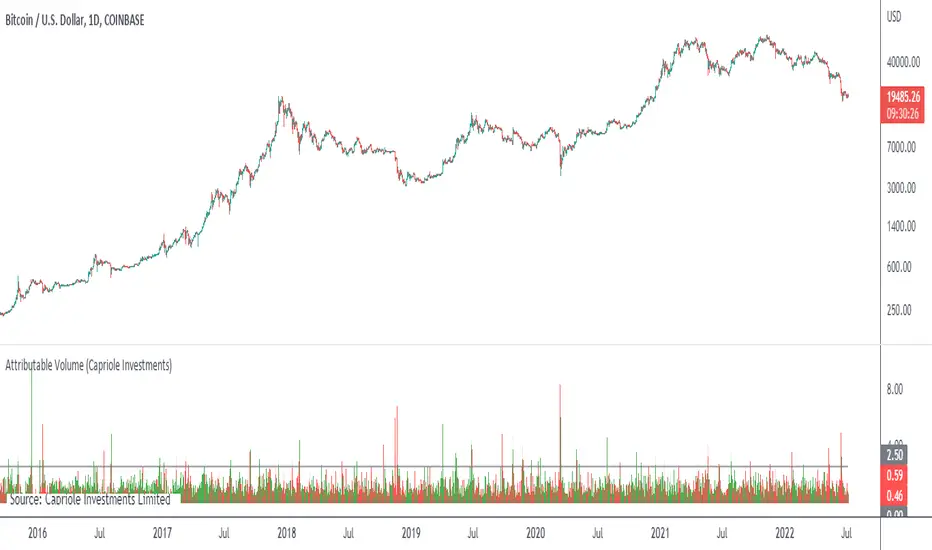
Attributable VolumeA volume indicator which calculates "Attributable Volume”, the portion of volume which contributed to the direction in which the candle moved.
Attributable Volume is calculated as: Total volume excluding the "counter wick" volume.
Where for a green (up) candle, the "counter wick" volume is the top wick volume.
In theory, Attributable Volume should better represent the effort of directional thrust of each candle.
By default, this indicator displays “Attributable RVOL”, but can be set to:
Attributable RVOL
RVOL
Attributable Volume
Volume
Note: RVOL = Relative Volume, the current volume divided by the Volume moving average. RVOL can be used to identify major moves, and potential starts/ends to trends.
Dual SuperTrend, Ichimoku and DMI Color Weighted by DGTThis study interprets SuperTrend with Ichimoku Cloud, one of the popular technical analysis indicator, and interprets Directional Movement (DMI), which is another quite valuable technical analysis indicator.
Then combines the interpreted SuperTrend with interpreted Directional Movement (DMI) and Volume Based Colored Bars indicator created by Kıvaç ÖZBİLGİÇ (permission has been granted from the author)
Here are details of the concept applied
1- SuperTrend Line colored based on Ichimoku Cloud
Definition
The Ichimoku Cloud, developed by Goichi Hosoda and published in the late 1960s, is a collection of technical indicators that give it a unique capacity to show support and resistance levels, momentum and trend direction
What Does the Ichimoku Cloud Tells?
The overall trend is up when price is above the cloud, known as Kumo Cloud, down when price is below the Kumo Cloud, and trendless or transitioning when price is in the Kumo Cloud
When Senkou Span A (Leading Span A) is rising and above Senkou Span B (Leading Span B), this helps confirm the uptrend and space between the lines is typically colored green. When Senkou Span A is falling and below Senkou Span B, this helps confirm the downtrend. The space between the lines is typically colored red
Traders often use the Kumo Cloud as an area of support and resistance depending on the relative location of the price. The Kumo Cloud provides support/resistance levels that can be projected into the future. This sets the Ichimoku Cloud apart from many other technical indicators that only provide support and resistance levels for the current date and time
Crossovers, also known as TK Cross among Ichimoku Cloud traders, are another way the indicator can be used. Watch for the Tenkan-Sen Line, or Conversion Line, to move above the Kijun-Sen Line, or Base Line, especially when price is above the Kumo cloud. This can be a powerful buy signal. One option is to hold the trade until the Tenkan-Sen drops back below the Kijun-Sen Line. Any of the other lines could be used as exit points as well.
With this study:
Allow Traders to use the Ichimoku Cloud in conjunction with other technical indicators to maximize their risk-adjusted returns
The Ichimoku Cloud can make a chart look busy with all the lines. To Remedy this a different approach is applied in this study showing the Price and the Kumo Cloud relation as well as TK Crosses displayed. The SuperTrend Indicator is chosen to display Ichimoku Indicator, where the SuperTrend is another trend following indicator.
How it works:
SuperTrend Line is colored as:
Green when the Price is above the Kumo Cloud
Red when the Price is below the Kumo Cloud
Black when the Price is within the Kumo Cloud
And Finally Blue when the Kumo Cloud Is not ready to be drawn or not Kumo Cloud available
Additionally intensity of the colors used in all cases above are defined by values of Tenkan-Sen and Kijun-Sen Line, which allows us to detect TK Crosses
2- Plots Colored Directional Movement Line
Definition
Directional Movement (DMI) (created by J. Welles Wilder ) is actually a collection of three separate indicators combined into one. Directional Movement consists of the Average Directional Index (ADX) , Plus Directional Indicator (+D I) and Minus Directional Indicator (-D I) . ADX's purposes is to define whether or not there is a trend present. It does not take direction into account at all. The other two indicators (+DI and -DI) are used to compliment the ADX. They serve the purpose of determining trend direction. By combining all three, a technical analyst has a way of determining and measuring a trend's strength as well as its direction.
This study combines all three lines in a single colored shapes series plotted on the top of the price chart indicating the trend strength with different colors and its direction with triangle up and down shapes.
What to look for
Trend Strength : Analyzing trend strength is the most basic use for the DMI. Wilder believed that a DMI reading above 25 indicated a strong trend, while a reading below 20 indicated a weak or non-existent trend
Crosses : DI Crossovers are the significant trading signal generated by the DMI
With this study
A Strong Trend is assumed when ADX >= 25
Bullish Trend is defined as (+D I > -DI ) and (ADX >= 25), which is plotted as green triangle up shape on top of the price chart
Bearish Trend is defined as (+D I < -DI ) and (ADX >= 25), which is plotted as red triangle down shape on top of the price chart
Week Trend is assumed when 17< ADX < 25, which is plotted as black triangles up or down shape, depending on +DI-DI values, on top of the price chart
Non-Existent Trend is assumed when ADX < 17, which is plotted as yellow triangles up or down shape, depending on +DI-DI values, on top of the price chart
Additionally intensity of the colors used in all cases above are defined by comparing ADX’s current value with its previous value
3- Volume Based Colored Bars indicator created by Kıvaç ÖZBİLGİÇ
Volume Based Colored Bars colors the bars into volume weighted signals increasing the visibility of the Volume changes. Intensity of the colors of the bars varies according to average value of the volume for given length of bars (default value set to 30 bars)
Disclaimer: The script is for informational and educational purposes only. Use of the script does not constitutes professional and/or financial advice. You alone the sole responsibility of evaluating the script output and risks associated with the use of the script. In exchange for using the script, you agree not to hold dgtrd tradingview user liable for any possible claim for damages arising from any decision you make based on use of the script
