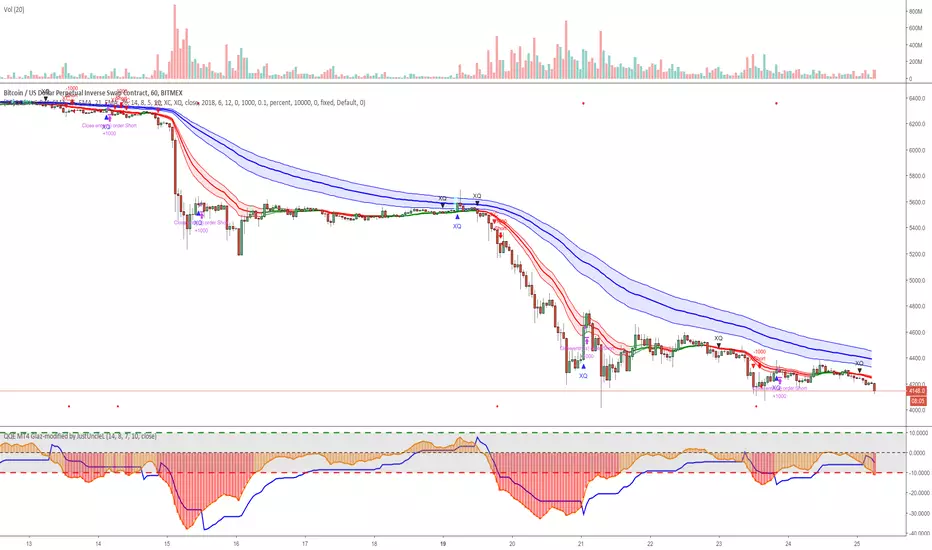
[Backtest]QQE Cross v6.0 by JustUncleLDescription:
This is the Backtest version of the " QQE Cross v6.0 by JustUncleL" Tool, can be used to optimize settings.
Bot
14/28 Day SMA Divergence and RSI - No RepaintIf you are interested in purchasing my algorithmic trading bot that receives Tradingview indicator alerts via email and then executes them in Bittrex, please visit my product page here: ilikestocks.com Additionally, I would love to create video/blog guides on creating Tradingview scripts or strategies. If you are a knowledgeable in finance or other related fields and would like to be featured on my page, please contact me at tanner@ilikestocks.com.
No crossovers were used in this script, and this is likely the reason for the no repaint(Correct me if wrong).
This strategy script uses a 14-day SMA signal line, a 28-day SMA and RSI. The strategy works by determining whether the (14-day SMA is above the 28-day SMA and the RSI levels are overbought(below 30)) or RSI is very overbought(below 13 or so). Once either of these conditions have been met, a long position is opened.
The initial long position must be partially closed by the take profit first and then the final close is executed if the 14-day signal SMA is below the 28-day SMA; you may also exclusively use take profit to close positions.
The green plotted spikes are the initial long position conditions. The orange plotted spikes are take profit signals once a long position is opened. The red plotted spikes are plotted when the SMA 14-day is below the 28-day SMA.
Please do leave constructive criticism or comments below because it helps me better create scripts!

CMYK XIAM OPEN◊ Introduction
This is project XIAM, a work in progress.
Recently i came across the repainting problem.
Since then i haven't seen any bot-code that makes > 5% profit in two weeks with 0.25% fees/trade.
People who make good bots either bluff or don't share the code.
they let you rent it.
I aim to understand, learn it, write it myself. And share my findings with whoever shares with me.
◊ Origin
Based on RMI (RSI with momentum) and SMA, and values derived from those.
◊ Usage
Currently an investigative script.
◊ Theoretical Approaches
Philosophy α :: Cleansignal
:: Cleaning up the signal, from irregularities that cause unpredictable results.
Merging available tickers of a pair into one.
Merging available tickers of different coins into one in the correct proportion. (eg. Crypto market cap)
Removing Jitter, and smoothing signal without delay.
Philosophy β :: Rythmic
:: Syncing into the rythm's, to never miss the que, and trade on every theoretical low/high
Searching Amplitude, Period, Phase Shift, Frequency's of the carrier waves.
Marking Acrivity/inactivity of the carrier waves.
Partial Fractal repetition asses-able with above data?
Philosophy γ :: consequential
:: Seeking for Indicatory events and causal relations
Probability / reward.
Confirmation and culmination.
...
◊ Community
Wanna share your findings ? or need help resolving a problem ?
CMYK :: discord.gg
AUTOTVIEW :: discordapp.com


CMARSI Strategy (on ETHUSD) Seems working goodthere it is, it's using the Connor RSI with little variations.
C onnor M oving A verage RSI

simple botthe AI=
value of close of candle < value of close of candle previous by 1 = sell
close > close1 = buy
closeorder on SL
closeorder on AutoProfit
closeorder on signal reverse (if openorder not in profit)

MACDouble + RSI (rec. 15min-2hr intrv) Uses two sets of MACD plus an RSI to either long or short. All three indicators trigger buy/sell as one (ie it's not 'IF MACD1 OR MACD2 OR RSI > 1 = buy", its more like "IF 1 AND 2 AND RSI=buy", all 3 match required for trigger)
The MACD inputs should be tweaked depending on timeframe and what you are trading. If you are doing 1, 3, 5 min or real frequent trading then 21/44/20 and 32/66/29 or other high value MACDs should be considered. If you are doing longer intervals like 2, 3, 4hr then consider 9/19/9 and 21/44/20 for MACDs (experiment! I picked these example #s randomly).
Ideal usage for the MACD sets is to have MACD2 inputs at around 1.5x, 2x, or 3x MACD1's inputs.
Other settings to consider: try having fastlength1=macdlength1 and then (fastlength2 = macdlength2 - 2). Like 10/26/10 and 23/48/20. This seems to increase net profit since it is more likely to trigger before major price moves, but may decrease profitable trade %. Conversely, consider FL1=MCDL1 and FL2 = MCDL2 + (FL2 * 0.5). Example: 10/26/10 and 22/48/30 this can increase profitable trade %, though may cost some net profit.
Feel free to message me with suggestions or questions.

MACD, backtest 2015+ only, cut in half and doubledThis is only a slight modification to the existing "MACD Strategy" strategy plugin!
found the default MACD strategy to be lacking, although impressive for its simplicity. I added "year>2014" to the IF buy/sell conditions so it will only backtest from 2015 and beyond ** .
I also had a problem with the standard MACD trading late, per se. To that end I modified the inputs for fast/slow/signal to double. Example: my defaults are 10, 21, 10 so I put 20, 42, 20 in. This has the effect of making a 30min interval the same as 1 hour at 10,21,10. So if you want to backtest at 4hr, you would set your time interval to 2hr on the main chart. This is a handy way to make shorter time periods more useful even regardless of strategy/testing, since you can view 15min with alot less noise but a better response.
Used on BTCCNY OKcoin, with the chart set at 45 min (so really 90min in the strategy) this gave me a percent profitable of 42% and a profit factor of 1.998 on 189 trades.
Personally, I like to set the length/signals to 30,63,30. Meaning you need to triple the time, it allows for much better use of shorter time periods and the backtests are remarkably profitable. (i.e. 15min chart view = 45min on script, 30min= 1.5hr on script)
** If you want more specific time periods you need to try plugging in different bar values: replace "year" with "n" and "2014" with "5500". The bars are based on unix time I believe so you will need to play around with the number for n, with n being the numbers of bars.
