Bollinger Bands with 4 Moving AveragesCombines Bollinger Bands (BB) with up to four optional Moving Averages (MA) to read volatility, trend direction, and dynamic support–resistance in one overlay.
How It Works
BB: basis = MA(length, type) with standard deviation mult. upper = basis + dev, lower = basis − dev.
MA1–MA4: additional averages you can toggle (default only MA4/200 enabled).
Key Features
Flexible basis MA type for BB: SMA / EMA / RMA (Wilder) / WMA / VWMA.
Four optional MAs with independent length, color, and width (defaults: 7, 25, 99, 200; only 200 on by default).
Offset to shift BB for visual testing.
Overlay on price with shaded band between Upper–Lower.
Inputs & Defaults
BB Length = 20, StdDev = 2.0, Source = close.
Basis MA Type = SMA.
MA4 active (200), MA1–MA3 off (7/25/99 ready).
Offset = 0.
Practical Use
Use BB for volatility context: squeeze → potential breakout; expansion → strong trend.
Treat Basis / Upper / Lower as dynamic levels:
Pullbacks to Basis often become decision zones in trends.
Upper/Lower touches = relative extremes.
Add MA4(200) for primary bias; enable MA1–MA3 for finer timing.
Typical behavior:
Price > MA200 and rising basis → bullish bias; watch pullbacks to basis/MA25-like zones.
Price < MA200 and falling basis → bearish bias; watch rejections at basis/MAs.
Common Signals (not financial advice)
Breakout + BB expansion confirms momentum.
Squeeze + basis break can preface volatility expansion.
Confluence: Lower touch + fast MA in uptrends → mean-reversion setups; inverse for downtrends.
Notes
MA1–MA4 are SMA in the code; BB basis follows the selected MA type.
Test across timeframes; tune length and mult to the asset.
Disclaimer
Visual tool only. Combine with risk management, multi-timeframe confirmation, and a tested plan.
Bandas de Bollinger (BB)

10MAs + BB10 MAs riboon + Bollinger Bands
I used two basic Multiple MA ribbons. so I just merge them to one indicaotor

BB Crosses Optimized - [JTCAPITAL]BB Crosses Optimized - is a modified way to use Bollinger Bands combined with volatility filtering (ATR) and flexible smoothing methods for Trend-Following.
The indicator works by calculating in the following steps:
Source Selection & Smoothing
The script begins by letting the user select a preferred price source (default is Close, but options include Open, High, Low, HL2, etc.). This raw input is then passed through a smoothing process.
Multiple smoothing techniques can be chosen: SMA, EMA, HMA, DEMA, TEMA, RMA, and FRAMA. Each method reduces short-term noise differently, ensuring flexibility for traders who prefer faster or slower reaction speeds in trend detection.
Bollinger Band Construction
Once the smoothed source is prepared, Bollinger Bands are calculated. The middle band is a moving average of the smoothed data over the defined BB Period . The upper and lower bands are then generated by adding and subtracting the Standard Deviation × Deviation multiplier . These dynamic bands capture volatility and help define breakout zones.
ATR Volatility Measurement
Parallel to the band calculation, the Average True Range (ATR) is computed over the chosen ATR Period . This measures market volatility. The ATR can optionally act as a filter, refining buy and sell levels so signals adapt to current market conditions rather than being fixed to price alone.
Bollinger Band Signals
-If the smoothed price closes above the upper band, a potential bullish event is marked.
-If the smoothed price closes below the lower band, a potential bearish event is marked.
Trend Line Construction
When a bullish event occurs, the script anchors a trend-following line beneath price. If ATR filtering is enabled, the line is set at Low – ATR , otherwise at the simple Low. Conversely, when a bearish event occurs, the line is anchored above price at High + ATR (or just High without the filter). The line is designed to only move in the direction of the trend—if price action does not exceed the prior value, the previous level is held. This prevents unnecessary whipsaws and keeps the indicator aligned with dominant momentum.
Final Trend Detection
The slope of the trend line defines the trend itself:
-Rising line → bullish trend.
-Falling line → bearish trend.
Visual Output
The indicator plots the trend line with dynamic coloring: Blue for bullish phases, Purple for bearish phases. A subtle filled background area emphasizes the active trend zone for clearer chart interpretation.
Buy and Sell Conditions:
- Buy Signal : Triggered when smoothed price closes above the upper Bollinger Band. Trend line then anchors below price (with or without ATR offset depending on settings).
- Sell Signal : Triggered when smoothed price closes below the lower Bollinger Band. Trend line then anchors above price (with or without ATR offset).
Additional filtering is possible via:
- ATR Toggle : Switch ATR on or off to adapt the strategy to either volatile or steady markets.
- Smoothing Method : Adjust smoothing to speed up or slow down responsiveness.
- Deviation Multiplier : Tight or wide bands adjust the sensitivity of signals.
Features and Parameters:
- Source : Choose between Close, Open, High, Low, HL2, etc.
- Average Type : Options include SMA, EMA, HMA, DEMA, TEMA, RMA, FRAMA.
- ATR Period : Defines how ATR volatility is measured.
- BB Period : Lookback length for Bollinger Band construction.
- Deviation : Multiplier for the standard deviation in Bollinger Bands.
- Smoothing Period : Controls how much the source data is smoothed.
- ATR Filter On/Off : Enables or disables ATR integration in signal calculation.
Specifications:
Smoothing (MA Types)
Smoothing is essential to reduce chart noise. By offering multiple MA choices, traders can balance between lag (SMA, RMA) and responsiveness (EMA, HMA, FRAMA). This flexibility allows the indicator to adapt across asset classes and trading styles.
Bollinger Bands
Bollinger Bands measure price deviation around a moving average. They help identify volatility expansion and contraction. In this script, the bands serve as breakout triggers—price crossing outside suggests momentum strong enough to sustain a trend.
Standard Deviation
Standard Deviation is a statistical measure that quantifies the dispersion of price data around the mean. With a multiplier applied, it creates bands that contain a probabilistic portion of price action. Crossing beyond these suggests a higher likelihood of trend continuation.
ATR (Average True Range)
ATR measures the degree of volatility. Instead of simply reacting to price crossing the bands, ATR ensures the trend line placement adapts to current conditions. In volatile markets, wider buffers prevent premature signals; in calmer markets, tighter placement keeps signals responsive.
Trend Line Logic
The trend line only adjusts in the direction of the trend. If new values do not exceed the prior, the line remains unchanged. This prevents false reversals and makes the line a reliable visual confirmation of trend direction.
Signal Detection
The indicator does not repaint: signals are based on confirmed closes relative to the Bollinger Bands. This makes it more reliable for both live trading and backtesting scenarios.
Visual Enhancements
The use of dual plots and fill shading creates a clearer separation of bullish vs. bearish phases. This helps traders visually align entries and exits without second-guessing.
Enjoy!

FlowSpike ES — BB • RSI • VWAP + AVWAP + News MuteThis indicator is purpose-built for E-mini S&P 500 (ES) futures traders, combining volatility bands, momentum filters, and session-anchored levels into a streamlined tool for intraday execution.
Key Features:
• ES-Tuned Presets
Automatically optimized settings for scalping (1–2m), daytrading (5m), and swing trading (15–60m) timeframes.
• Bollinger Band & RSI Signals
Entry signals trigger only at statistically significant extremes, with RSI filters to reduce false moves.
• VWAP & Anchored VWAPs
Session VWAP plus anchored VWAPs (RTH open, weekly, monthly, and custom) provide high-confidence reference levels used by professional order-flow traders.
• Volatility Filter (ATR in ticks)
Ensures signals are only shown when the ES is moving enough to offer tradable edges.
• News-Time Mute
Suppresses signals around scheduled economic releases (customizable windows in ET), helping traders avoid whipsaw conditions.
• Clean Alerts
Long/short alerts are generated only when all conditions align, with optional bar-close confirmation.
Why It’s Tailored for ES Futures:
• Designed around ES tick size (0.25) and volatility structure.
• Session settings respect RTH hours (09:30–16:00 ET), the period where most liquidity and institutional flows concentrate.
• ATR thresholds and RSI bands are pre-tuned for ES market behavior, reducing the need for manual optimization.
⸻
This is not a generic indicator—it’s a futures-focused tool created to align with the way ES trades day after day. Whether you scalp the open, manage intraday swings, or align to weekly/monthly anchored flows, FlowSpike ES gives you a clear, rules-based signal framework.

Advanced Trend & Volatility Indicator (VWAP & EMA360)Bollinger band with adjustable NO TRADE tool. green buy and red sell signals for 20 moving average added 360 moving average for micro trading. Has VWAP and additional EMA defaulted to 9 (adjust to your style). For confluence use this along with an RSI over bought and over sold WMA with similar green buy and red sell signals.
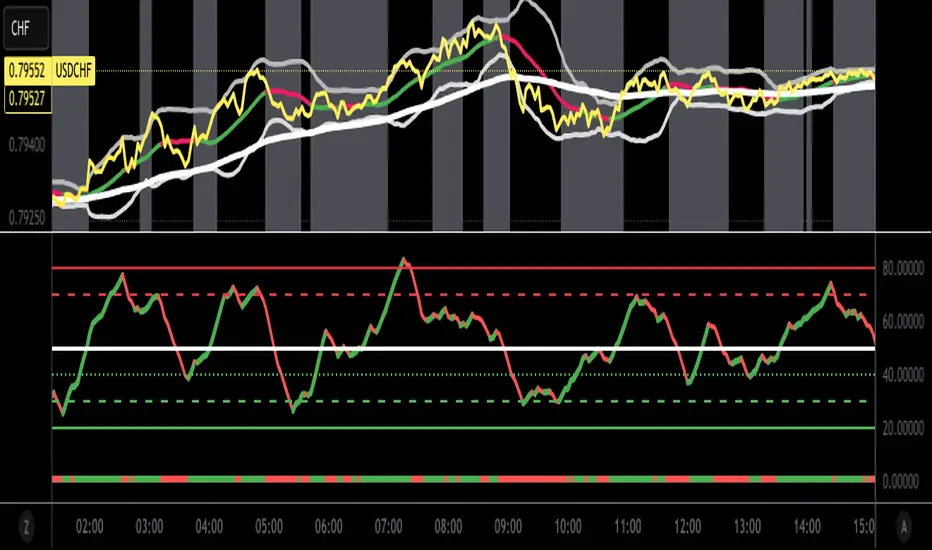
RSI/Stochastic with overlays a moving average + Bollinger BandsCompact oscillator panel that lets you switch the base between RSI and Stochastic %K, then overlays a moving average + Bollinger Bands on the oscillator values (not on price) to read momentum strength and squeeze/expansion.
What’s added
Selectable base: RSI ↔ Stochastic %K (plots %D when Stoch is chosen).
MA + BB on oscillator to gauge momentum trend (MA) and volatility (bands).
Adjustable bands 70/50/30 with optional fill, plus optional regular divergence and alerts.
How to read
Bull bias: %K above osc-MA and pushing/closing near Upper BB; confirm with %K > %D.
Bear bias: %K below osc-MA and near Lower BB; confirm with %K < %D.
Squeeze: BB on oscillator tightens → expect momentum breakout.
Overextension: repeated touches of Upper/Lower BB in 70/30 zones → strong trend; watch for %K–%D recross.
Quick settings (start here)
Stoch: 14 / 3 / 3; Bands: 70/50/30.
Osc-MA: EMA 14.
BB on oscillator: StdDev 2.0 (tune 1.5–2.5).
Note
Analysis tool, not financial advice. Backtest across timeframes and use risk management.

BB + OBV + RSI Strategy (Enhanced + Daily Table) Script Brief – *BB + OBV + RSI Strategy (Enhanced + Daily Table)*
This TradingView Pine Script combines **Bollinger Bands (BB)**, **On-Balance Volume (OBV)**, **Relative Strength Index (RSI)**, and **Exponential Moving Average (EMA)** to help traders identify potential trend conditions and market strength.
**Key Features:**
* **Bollinger Bands** (20-period SMA ± 2 Std Dev by default) to track volatility and price extremes.
* **OBV & OBV Moving Average** to confirm buying or selling pressure.
* **RSI** to highlight overbought and oversold zones.
* **200 EMA** as a long-term trend filter.
* **Daily Comparison Table** (top-right corner):
* Displays today’s vs. yesterday’s values for Close, RSI, OBV vs MA, BB Position, and EMA Trend.
* Helps quickly assess whether momentum and trend conditions are strengthening or weakening.
**Usage:**
* The chart shows **BB lines and EMA** for real-time analysis on any timeframe.
* The **table provides higher-timeframe context** (daily values), making it easier to confirm signals across multiple timeframes.
* Best applied with backtesting and proper risk management.

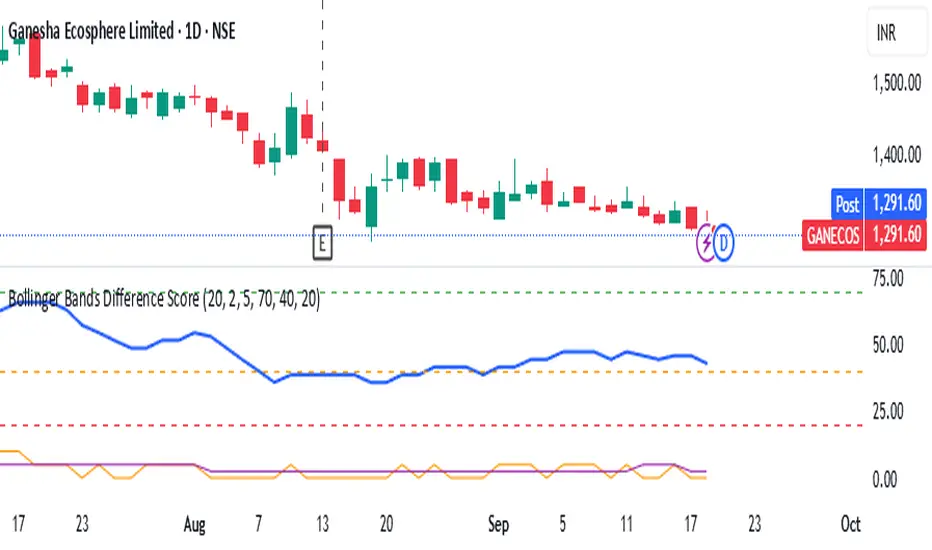
Bollinger Bands Difference Score
Bollinger Bands Difference Score (TradingView – Pine Script v6)
The **Bollinger Bands Difference Score** is a volatility-based scoring system designed to help traders quickly assess whether a stock is in a **strong trend, neutral zone, or weak setup**. It transforms the raw **Bollinger Band Width (BB-Diff)** into a **normalized score (0–100)** and classifies conditions with intuitive thresholds.
---
### 🔹 What is Bollinger Bands Difference (BB-Diff)?
* **Bollinger Bands** are built from a moving average with upper and lower bands set by standard deviations.
* The **difference (or width)** between the bands reflects market volatility.
* A **high difference** = wide bands = strong volatility (breakout/trend).
* A **low difference** = narrow bands = low volatility (consolidation).
This indicator standardizes BB-Diff into a score and smooths it for cleaner signals.
---
### 🔹 Key Features
1. **BB-Diff Scoring System**
* Converts Bollinger Band width into a **0–100 normalized score**.
* Higher score → higher volatility/trend strength.
* Lower score → consolidation or weaker momentum.
2. **Signal Levels**
* **Strong Zone (≥ 70):** Indicates strong trend strength or expansion in volatility.
* **Neutral Zone (40–70):** Sideways or undecided price action.
* **Weak Zone (≤ 20):** Suggests very low volatility, potential upcoming squeeze.
3. **Score Smoothing**
* Applies a moving average to reduce noise.
* Helps avoid false signals during choppy markets.
4. **Visual Enhancements**
* Plots the score as a line (0–100 scale).
* Adds horizontal reference lines for **Strong**, **Neutral**, and **Weak** levels.
* Background colors automatically highlight **bullish strength (green)** or **weakness (red)**.
---
### 🔹 How to Use
* **Trend Confirmation:**
Look for scores **above 70** → suggests trend continuation or volatility breakout.
* **Consolidation Watch:**
Scores in the **20 or below** zone may precede volatility squeezes → breakout setups.
* **Neutral Zone:**
Scores between **40–70** suggest sideways price action; avoid aggressive trades.
* **Combine with Price Action:**
Use with support/resistance, candlestick patterns, or momentum indicators for confirmation.
---
### 🔹 Best Practices
* Great as a **volatility filter** before entries.
* Use in combination with **RSI, MACD, or OBV** for directional bias.
* Works well for **breakout trading** (when score rises from low levels).
* Monitor on multiple timeframes for alignment.
---
✅ **In summary:** The **Bollinger Bands Difference Score** is a simple yet powerful tool that quantifies volatility strength into an actionable score, making it easier to spot strong trends, consolidation phases, and potential breakout opportunities.
Outside the Bollinger Bands Alerting Indicator Overview
The Outside the Bollinger Bands Alerting Indicator is a comprehensive technical analysis tool that combines multiple proven
indicators into a single, powerful system designed to identify high-probability reversal patterns at Bollinger Band extremes. This
indicator goes beyond simple band touches to detect sophisticated pattern formations that often signal strong directional moves.
Key Features & Capabilities
🎯 Advanced Pattern Recognition
Bollinger Band Breakout Patterns
- Detects "pierce-and-reject" formations where price breaks through a Bollinger Band but immediately reverses back inside
- Identifies failed breakouts that often lead to strong moves in the opposite direction
- Combines multiple confirmation signals: engulfing candle patterns, MACD momentum, and ATR volatility filters
- Visual alerts with symbols positioned below (bullish) or above (bearish) candles
Tweezer Top & Bottom Patterns
- Identifies consecutive candles with nearly identical highs (tweezer tops) or lows (tweezer bottoms)
- Requires at least one candle to breach the respective Bollinger Band
- Confirms reversal with directional close requirements
- Customizable tolerance settings for pattern sensitivity
- Visual alerts with ❙❙ symbols for easy identification
📊 Multi-Indicator Integration
Bollinger Bands Indicator
- Dual-band configuration with outer (2.0 std dev) and inner (1.5 std dev) bands that can be adjusted to suit your own parameters
- Configurable MA types: SMA, EMA, SMMA (RMA), WMA, VWMA
- Customizable length, source, and offset parameters
- Color-coded band fills for visual clarity
Moving Average Suite
- EMA 9, 21, 50, and 200 (individually toggleable)
- Special "SMA 3 High" for help visualizing and detecting Bollinger Band break-outs
- Dynamic color coding based on price relationship
Optional Ichimoku Cloud overlay
- Complete Ichimoku implementation with customizable periods
- Dynamic cloud coloring based on trend direction
- Toggleable overlay that doesn't interfere with other indicators
🚨 Comprehensive Alert System
Real-Time JSON Alerts
- Sends structured data on every confirmed bar close
- Includes all indicator values: BB levels, EMAs, MACD, RSI
- Contains signal states and crossover conditions
- Perfect for automated trading systems and webhooks
{"timestamp":1753118700000,"symbol":"ETHUSD","timeframe":"5","price":3773.3,"bollinger_bands":{"upper":3826.95,"basis":3788.32,"lower":3749.68},"emas":{"ema_9":3780.45,"ema_21":3788.92,"ema_50":3800.79,"ema_200":3787.74,"sma_3_high":3789.45},"macd":{"macd":-10.1932,"signal":-11.3266,"histogram":1.1334},"rsi":{"rsi":40.5,"rsi_ma":39.32,"level":"neutral"}}
Specific Alert Conditions
- MACD histogram state changes (rising to falling, falling to rising)
- RSI overbought/oversold crossovers
- All pattern detections (BB Bounce, Tweezer patterns)
- Bollinger Band breakout alerts
🎨 Visual Elements
Pattern Identification
- ♻ symbols for Bollinger Band breakout patterns (green for bullish, red for bearish)
- ❙❙ symbols for tweezer patterns (green below for bottoms, red above for tops)
- Color-coded band fills for trend visualization
Chart Overlay Options
- All moving averages with distinct colors
- Bollinger Bands with inner and outer boundaries
- Optional Ichimoku cloud with trend-based coloring
Trading Applications
Reversal Trading
- Identify high-probability reversal points at extreme price levels
- Use failed breakout patterns for entry signals
- Combine multiple timeframes for enhanced accuracy
Trend Analysis
- Monitor moving average relationships for trend direction
- Use Ichimoku cloud for trend strength assessment
- Track momentum with MACD and RSI integration
Risk Management
- ATR-based volatility filtering reduces false signals
- Multiple confirmation requirements improve signal quality
- Real-time alerts enable prompt decision making
Suggested Use
- Use on multiple timeframes for confluence
- Combine with support/resistance levels for enhanced accuracy
- Set up alerts for hands-free monitoring
- Customize settings based on market volatility and trading style
- Consider volume confirmation for stronger signals

VIX CCI Oscillator [Compression + EMA Trigger + Bounce Glow]VIX CCI OSCILLATOR
ADJ CHART FOR YOUR LIKING
NOT AS SMOOTH AS PREVIOUS VERSION (STOCH)
SHOWS TIGER SIGNAL ON EMA
SAMEOUTPUT
HUD Box: emoji-coded tactical feedback
bounce 100 "💥 Expansion" :
bounce 0.8 "🔴 Overbought" :
bounce 0.618 "📉 Distribution" :
bounce 0.5 "🧠 Midline" :
bounce 0.382 "📈 Accumulation" :
bounce 0.2 "🟢 Oversold" :
bounce0.0 "💣 Expansion" : "⚪ Neutral"
Tiger EMA/STOCH
This logic checks if the oscillator is trending above or below its 48-period EMA,
If above, it paints the line GREEN🟢 (bullish),
If below, it paints it RED🔴 (bearish),
If compression is active, it overrides both with purple🟣 to highlight tactical squeeze conditions,
⚠️WARNING⚠️
ALWAYS REMEMBER THIS CHART IS VIX/USD
IN MOST CASES SPY MOVES VICE VERSA
I AM NOT RESPOSIBLE FOR YOUR OWN ACTIONS/TRADE IDEAS

EMA Envelope + SMA + Purple DotThis indicator combines three tools into one:
📈 EMA Envelope with wedge and range contraction signals to highlight volatility squeezes.
🔵 SMA with optional smoothing (SMA/EMA/WMA/SMMA/VWMA) and optional Bollinger Bands.
🟣 Purple Dot “PowerBars” that mark strong momentum bars when price ROC (%) and volume exceed user-defined thresholds.
It also includes:
Background highlighting of contraction zones (bullish/bearish/neutral colors).
A summary table showing PowerBar count and return (%) over custom lookback periods.
Flexible display settings (table position, dark/light theme, highlight toggle).
Designed for traders who want to track momentum bursts, volatility contraction, and trend strength all in one tool.

Crypto Breakout Buy/Sell Sequence
⚙️ Components & Sequence Multiple Timeframe (What It Does)
1. Bollinger Bands – Form the foundation by measuring volatility and creating the dynamic range where squeezes and breakouts occur.
2. Squeeze Dots – Show when price compresses inside the bands, signaling reduced volatility before expansion.
3. Breakout Event (Brk Dot) – Fires when price expands beyond the squeeze zone, confirming volatility expansion. (This paints Intra, before candle close)
4. Buy Signal – Confirms entry after a breakout is validated. (This paints at candle close)
5. Pump Signal – Flags sudden surges that extend sharply from the bands, often linked to strong inflows.
6. Momentum Stream – Tracks the strength of movement following the breakout, from continuation (🟢) to slowing (🟡) to exhaustion (🔴). (Resets at Pump Signal)
7. Overbought Indicator – Confirms when momentum has reached overheated conditions, often aligning with band extremes.
8. Sell Signal – Prints when exhaustion/reversal conditions are met, closing the trade cycle.
The Crypto Breakout Buy/Sell Sequence is a no-repaint event indicator that maps a full trade cycle using Bollinger-band-based volatility states: Bollinger Bands → Squeeze → Breakout → Buy → Pump → Momentum → Top Test → Overbought → Sell. Each stage is rule-based and designed to be read on standard candlesticks.
How It Works (System Logic)
Volatility framework: Bollinger Bands define dynamic range and compression/expansion.
Initiation: Squeeze → Breakout confirms expansion; Buy validates participation after expansion begins.
Management: Pump highlights unusual acceleration; Momentum stream tracks continuation → slowing → exhaustion.
Exhaustion/Exit: Top Testing + Overbought build the exhaustion case; Sell marks the sequence end.
How To Use (Quick Guide)
Wait for Squeeze → Breakout → Buy to establish a structured start.
Manage with Momentum:
🟢 continuation, 🟡 slowing, 🔴 exhaustion pressure.
Monitor extremes: Top Testing and/or Overbought = tighten risk.
Exit on Sell or on your risk rules when exhaustion builds.
Limitations & Good Practice
Signals reflect price/volatility behavior, not certainty.
Strong trends can remain extended; Overbought/Top Test ≠ instant reversal.
Always confirm with your own risk rules, position sizing, and market context.
Initial public release: integrated Squeeze/Breakout/Buy → Momentum → Exhaustion → Sell cycle; improved label clarity; cleaned defaults.
Disclaimer
For educational purposes only. Not financial advice. Past performance does not guarantee future results. Test before live use.
Thank You

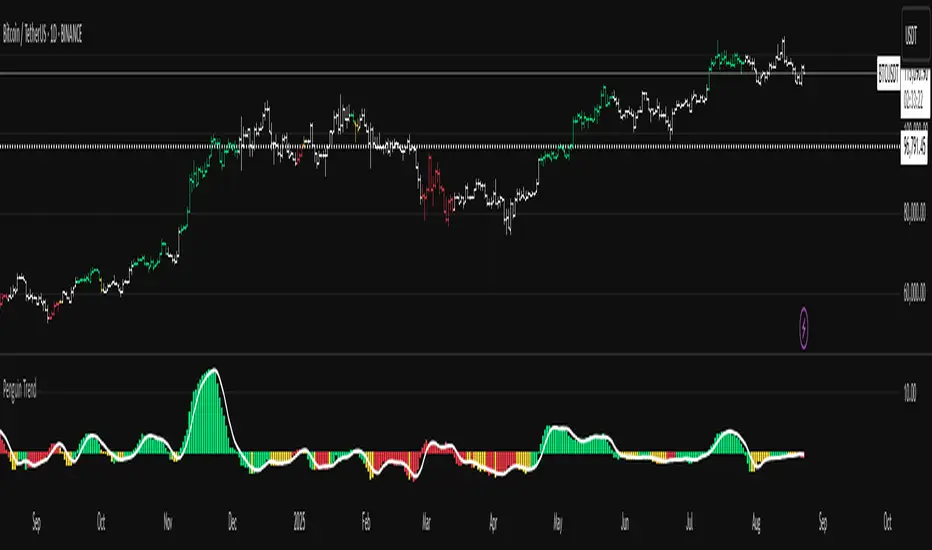
Penguin TrendMeasures the volatility regime by comparing the upper Bollinger Band to the upper Keltner Channel and colors bars with a lightweight trend state. Supports SMA/EMA/WMA/RMA/HMA/VWMA/VWAP and a selectable calculation timeframe. Default settings preserve the original look and behavior.
Penguin Trend visualizes expansion vs. compression in price action by comparing two classic volatility envelopes. It computes:
Diff% = (UpperBB − UpperKC) / UpperKC × 100
* Diff > 0: Bollinger Bands are wider than Keltner Channels -> expansion / momentum regime.
* Diff < 0: BB narrower than KC -> compression / squeeze regime.
A white “Average Difference” line smooths Diff% (default: SMA(5)) to help spot regime shifts.
Trend coloring (kept from original):
Bars are colored only when Diff > 0 to emphasize expansion phases. A lightweight trend engine defines four states using a fast/slow MA bias and a short “thrust” MA applied to ohlc4:
* Green: Bullish bias and thrust > fast MA (healthy upside thrust).
* Red: Bearish bias and thrust < fast MA (healthy downside thrust).
* Yellow: Bullish bias but thrust ≤ fast MA (pullback/weakness).
* Blue: Bearish bias but thrust ≥ fast MA (bear rally/short squeeze).
Note: By default, Blue renders as Yellow to preserve the original visual style. Enable “Use true BLUE color” if you prefer Aqua for Blue.
How it works (under the hood):
* Bollinger Bands (BB): Basis = selected MA of src (default SMA(20)). Width = StdDev × Mult (default 2.0).
* Keltner Channels (KC): Basis = selected MA of src (default SMA(20)). Width = ATR(kcATR) × Mult (defaults 20 and 2.0).
* Diff%: Safe division guards against division-by-zero.
* MA engine: You can choose SMA / EMA / WMA / RMA / HMA / VWMA / VWAP for BB/KC bases, Diff smoothing, and the trend components (VWAP is session-anchored).
* Calculation timeframe: Set “Calculation timeframe” to compute all internals on a chosen TF via request.security() while viewing any chart TF.
Inputs (key ones):
* Calculation timeframe: Empty = use chart TF; if set (e.g., 60), all internals compute on that TF.
* BB: Length, StdDev Mult, MA Type.
* KC: Basis Length, ATR Length, Multiplier, MA Type.
* Smoothing: Average Length & MA Type for the “Average Difference” line.
* Trend Engine: Fast/Slow lengths & MA type; Signal (kept for completeness); Thrust length & MA type (defaults replicate original behavior).
* Display: Paint bars only when Diff > 0; optional Zero line; optional true Blue color.
How to use:
1. Regime changes: Watch Diff% or Average Diff crossing 0. Above zero favors momentum/continuation setups; below zero suggests compression and potential breakout conditions.
2. State confirmation: Use bar colors to qualify expansion: Green/Red indicate expansion aligned with trend thrust; Yellow/Blue flag weaker/contrarian thrust during expansion.
3. Multi-timeframe analysis: Run calculations on a higher TF (e.g., H1/H4) while trading a lower TF chart to smooth noise.
Alerts:
* Diff crosses above/below 0.
* Average Diff crosses above/below 0.
* State changes: GREEN / RED / YELLOW / BLUE.
Notes & limitations:
* VWAP is session-anchored and best on intraday data. If not applicable on the selected calculation TF, the script automatically falls back to EMA.
* Default parameters (SMA(20) for BB/KC, multipliers 2.0, SMA(5) smoothing, trend logic and bar painting) preserve the original appearance.
Release notes:
v6.0 — Rewritten in Pine v6 with structured inputs and guards. Multi-MA support (SMA/EMA/WMA/RMA/HMA/VWMA/VWAP). Calculation timeframe via request.security() for multi-TF workflows. Safe division; optional zero line; optional true Blue color. Original visuals and behavior preserved by default.
License / disclaimer:
© waranyu.trkm — MIT License. Educational use only; not financial advice.
All-in-One EMA & BBThis script combines Bollinger Bands and multiple EMAs into one powerful tool. It includes:
1) Bollinger Bands with customizable MA type and colors.
2) EMA 21 on Daily and Weekly timeframes.
3) EMA 21, 50, 100, 200 on current chart timeframe.
4) Toggle options for each indicator for a clean, flexible view.
Ideal for traders seeking multi-timeframe trend analysis and volatility insights.

Calm before the StormCalm before the Storm - Bollinger Bands Volatility Indicator
What It Does
This indicator identifies and highlights periods of extremely low market volatility by analyzing Bollinger Bands distance. It uses percentile-based analysis to find the "quietest" market periods and highlights them with a gradient background, operating on the premise that low volatility periods often precede significant price movements.
How It Works
Volatility Measurement: Calculates the distance between Bollinger Bands upper and lower boundaries
Percentile Analysis: Analyzes the lowest X% of volatility periods over a configurable lookback period (default: lowest 40% over 200 bars)
Visual Highlighting: Uses gradient opacity to show volatility levels - the lower the volatility, the more opaque the background highlighting
Adaptive Threshold: Automatically calculates what constitutes "low volatility" based on recent market conditions
Who Should Use It
Primary Users:
Breakout Traders: Looking for consolidation periods that may precede significant moves
Options Traders: Seeking low implied volatility periods before volatility expansion
Swing Traders: Identifying accumulation/distribution phases before trend continuation or reversal
Range Traders: Spotting tight trading ranges for mean reversion strategies
Trading Styles:
Volatility-based strategies
Breakout and momentum trading
Options strategies (volatility plays)
Market timing approaches
When to Use It
Market Conditions:
Consolidation Phases: When price is moving sideways with decreasing volatility
Pre-Announcement Periods: Before earnings, economic data, or major events
Market Transitions: During shifts between trending and ranging markets
Low Volume Periods: When institutional participation is reduced
Strategic Applications:
Entry Timing: Wait for volatility compression before positioning for breakouts
Risk Management: Reduce position sizes during highlighted periods (anticipating volatility expansion)
Options Strategy: Sell premium during low volatility, buy during expansion
Multi-Timeframe Analysis: Combine with higher timeframe trends for confluence
Key Benefits
Objective Volatility Measurement: Removes subjectivity from identifying "quiet" markets
Adaptive Analysis: Automatically adjusts to current market conditions
Visual Clarity: Easy-to-interpret gradient highlighting
Customizable Sensitivity: Adjustable percentile thresholds for different trading styles
Best Used In Combination With:
Trend analysis tools
Support/resistance levels
Volume indicators
Momentum oscillators
This indicator is particularly valuable for traders who understand that periods of low volatility are often followed by periods of high volatility, allowing them to position ahead of potential significant price movements.
Multi-Length Quad Bollinger BandsHere is a Pine Script code for TradingView that plots four separate Bollinger Bands on your chart. The lengths are preset to 14, 50, 100, and 200, but every aspect—including lengths, standard deviations, colors, and the source price—is fully customizable through the script's settings menu.
The 14 and 50-period bands are enabled by default, while the 100 and 200-period bands are disabled to keep the chart clean initially. You can easily toggle any of them on or off.

Bollinger Heatmap [Quantitative]Overview
The Bollinger Heatmap is a composite indicator that synthesizes data derived from 30 Bollinger bands distributed over multiple time horizons, offering a high-dimensional characterization of the underlying asset.
Algorithm
The algorithm quantifies the current price’s relative position within each Bollinger band ensemble, generating a normalized position ratio. This ratio is subsequently transformed into a scalar heat value, which is then rendered on a continuous color gradient from red to blue. Red hues correspond to price proximity to or extension below the lower band, while blue hues denote price proximity to or extension above the upper band.
Using default parameters, the indicator maps bands over timeframes increasing in a pattern approximating exponential growth, constrained to multiples of seven days. The lower region encodes relationships with shorter-term bands spanning between 1 and 14 weeks, whereas the upper region portrays interactions with longer-term bands ranging from 15 to 52 weeks.
Conclusion
By integrating Bollinger bands across a diverse array of time horizons, the heatmap indicator aims to mitigate the model risk inherent in selecting a single band length, capturing exposure across a richer parameter space.

Combined Predictive Indicator### Combined Predictive Zones & Levels
This indicator is a powerful hybrid tool designed to provide a comprehensive map of potential future price action. It merges two distinct predictive models into a single, cohesive view, helping traders identify key levels of support, resistance, and areas of high confluence.
#### How It Works: Two Models in One
This script is built on two core components that you can use together or analyze separately:
**Part 1: Classic Range & Fibonacci Prediction**
This model uses classic technical analysis principles to project a potential range for the upcoming price action.
* **Highest High / Lowest Low:** It identifies the significant trading range over a user-defined lookback period.
* **Fibonacci Levels:** It automatically plots key Fibonacci retracement levels (e.g., 38.2% and 61.8%) within this range, which often act as critical support or resistance.
* **ATR & Average Range:** It calculates a "predicted" upper and lower boundary based on the average historical range and current volatility (ATR).
**Part 2: Advanced Predictive Ranges (Self-Adjusting Channels)**
This is a dynamic model that creates adaptive support and resistance zones based on a smoothed average price and volatility.
* **Dynamic Average:** It uses a unique moving average that only adjusts when the price moves significantly, creating a stable baseline.
* **ATR-Based Zones:** It projects multiple levels of support (S1, S2) and resistance (R1, R2) around this average, which widen and narrow based on market volatility. These zones often signal areas where price might stall or reverse.
#### Key Features:
* **Hybrid Model for Confluence:** The true power of this indicator lies in finding where the levels from both models overlap. A Fibonacci level aligning with a Predictive Range support zone is a much stronger signal.
* **Comprehensive Data Table:** A clean, on-chart table displays the precise values of all key predictive levels, allowing for quick reference and precise trade planning.
* **Multi-Timeframe (MTF) Capability:** The Advanced Predictive Ranges can be calculated on a higher timeframe, giving you a broader market context.
* **Fully Customizable:** All lengths, multipliers, and levels for both models are fully adjustable in the settings to fit any asset or trading style.
* **Clear Visuals:** All zones and levels are color-coded for intuitive and easy-to-read analysis.
#### How to Use:
1. Look for areas of **confluence** where multiple levels from both models cluster together. These are high-probability zones for price reactions.
2. Use the Predictive Range zones (S1/S2 and R1/R2) as potential targets for trades or as areas to watch for entries and exits.
3. Pay attention to the on-chart table for exact price levels to set limit orders or stop-losses.
**Disclaimer:** This script is an analytical tool for educational purposes and should not be considered financial advice. All trading involves risk. Past performance is not indicative of future results. Always use this indicator as part of a comprehensive trading strategy with proper risk management.
Feedback is welcome! If you find this tool useful, please leave a like.

Anti Nyangkut – Indikator Karya Anak Bangsa Anti Nyangkut – Indikator Karya Anak Bangsa
Indikator ini khusus buat kamu yang sering beli di pucuk dan jual di support, lalu akhirnya jadi bahan backtest orang lain.
💡 Sinyal buy only - muncul kalau harga udah:
✅ Di atas MA5
✅ Di atas Bollinger Bands Upper
✅ Di atas VWAP (khusus 1H & 4H)
🟢 TP dan SL otomatis muncul — biar gak cuma "niat hold sampe hijau"
📊 Cocok buat scalping & swing di 1H / 4H / 1D
Gak ada sinyal jual. Exit di tangan masing-nasing, jangan lupa pasang SL.
—
100% gratis. Bayarnya pakai amal jariyah.
—
Anti Nyangkut – An Indicator by the People, for the People
This one's for you if you always buy the top, sell the bottom, and end up becoming someone else's backtest data.
💡 Buy-Only Signals — triggered when price is:
✅ Above MA5
✅ Above Bollinger Bands Upper
✅ Above VWAP (on 1H & 4H only)
🟢 Auto TP & SL lines — so you stop saying "I'll hold until it turns green"
📊 Perfect for scalping & swing trades on 1H / 4H / 1D
There’s no sell signal. Exits are your responsibility — just don’t skip the stop loss.
—
100% free. Just pay with good karma.

[DIP] Inverse BB HighlightThis indicator allows you to highlight the area outside of the Bollinger Bands in order to draw more attention to it. This is especially useful for those who only trade when we are outside of the bands.
Keep in mind this indicator only works on bars, not on candles.

RSI+BOLLINGER (LONG & SHORT)This indicator combines two of the most popular tools in technical analysis, the Relative Strength Index (RSI) and Bollinger Bands (BB), to generate both long (BUY) and short (SELL) trading signals.
Strategy:
Entries (Buy/Short): Entry signals are based on the RSI.
A BUY is suggested when the RSI crosses above an oversold level (default: 29), indicating a possible upward reversal.
A SHORT is suggested when the RSI crosses below an overbought level (default: 71), indicating a possible downward reversal.
Exits (Position Closure): Exit signals are based on Bollinger Bands.
A long position is closed when the price crosses below the upper Bollinger Band.
A short position is closed when the price crosses above the lower Bollinger Band.
Key Features:
Cascade Filter: Includes a smart filter that prevents opening new consecutive trades if the price hasn't moved significantly in favor of a new entry, optimizing signal quality.
Automation Alerts: Generates detailed alerts in JSON format for each event (buy, sell, close), designed for easy integration with trading bots and automated systems via webhooks.
Fully Configurable: All parameters of the RSI, Bollinger Bands, and strategy filters can be adjusted from the indicator’s settings menu.

BB with Heikin Ashi + Reversal CheckThis indicator combines Bollinger Bands (BB) with Heikin Ashi candles to detect potential reversal points after price breaks the BB boundaries. It works on any symbol and timeframe, retrieving Heikin Ashi data via request.security().
Core Features
Heikin Ashi Candle Plot
Smooths price action by using Heikin Ashi candles instead of regular candles.
Candles are plotted directly on the chart with green (bullish) and red (bearish) colors.
Bollinger Bands (BB)
Calculated from Heikin Ashi close price.
Includes Basis (MA), Upper Band, and Lower Band, with customizable MA type, length, and standard deviation multiplier.
Break & Reversal Detection
The indicator tracks whether the price has broken above the Upper Band (p1) or below the Lower Band (p2).
It remembers the last breakout direction until the opposite breakout occurs (mutually exclusive logic).
Signal Logic
Long Signal (▲):
Price was previously below the Lower Band and then reversed upward (BB Lower rising + Heikin Ashi candle rising).
Short Signal (▼):
Price was previously above the Upper Band and then reversed downward (BB Upper falling + Heikin Ashi candle falling).
Alerts
Custom alert conditions trigger when Long or Short signals occur, allowing automated notifications or bot integration.
Use Cases
✅ Swing Trading / Trend Reversal – Identify potential bottom/top reversals after BB breakouts.
✅ Mean Reversion Strategies – Enter trades when the price reverts to the BB mean after an extreme breakout.
✅ Multi-Timeframe Analysis – Works with any timeframe and symbol via request.security().
Customization
MA Type: SMA, EMA, RMA, WMA, VWMA
BB Length & StdDev Multiplier
Timeframe & Symbol Selection

Price Volume Trend [sgbpulse]1. Introduction: What is Price Volume Trend (PVT)?
The Price Volume Trend (PVT) indicator is a powerful technical analysis tool designed to measure buying and selling pressure in the market based on price changes relative to trading volume. Unlike other indicators that focus solely on volume or price, PVT combines both components to provide a more comprehensive picture of trend strength.
How is it Calculated?
The PVT is calculated by adding or subtracting a proportional part of the daily volume from a cumulative total.
When the closing price rises, a proportional part of the daily volume (based on the percentage price change) is added to the previous PVT value.
When the closing price falls, a proportional part of the daily volume is subtracted from the previous PVT value.
If there is no change in price, the PVT value remains unchanged.
The result of this calculation is a cumulative line that rises when buying pressure is strong and falls when selling pressure dominates.
2. Why PVT? Comparison to Similar Indicators
While other indicators measure volume-price pressure, PVT offers a unique advantage:
PVT vs. On-Balance Volume (OBV):
OBV simply adds or subtracts the entire day's volume based on the closing direction (up/down), regardless of the magnitude of the price change. This means a 0.1% price change is treated the same as a 10% change.
PVT, on the other hand, gives proportional weight to volume based on the percentage price change. A trading day with a large price increase and high volume will impact the PVT significantly more than a small price increase with the same volume. This makes PVT more sensitive to trend strength and changes within it.
PVT vs. Accumulation/Distribution Line (A/D Line):
The A/D Line focuses on the relationship between the closing price and the bar's trading range (Close Location Value) and multiplies it by volume. It indicates whether the pressure is buying or selling within a single bar.
PVT focuses on the change between closing prices of consecutive bars, multiplying this by volume. It better reflects the flow of money into or out of an asset over time.
By combining volume with percentage price change, PVT provides deeper insights into trend confirmation, identifying divergences between price and volume, and spotting signs of weakness or strength in the current trend.
3. Indicator Settings (Inputs)
The "Price Volume Trend " indicator offers great flexibility for customization to your specific needs through the following settings:
Moving Average Type: Allows you to select the type of moving average used for the central line on the PVT. Your choice here will affect the line's responsiveness to PVT movements.
- "None" : No moving average will be displayed on the PVT.
- "SMA" (Simple Moving Average): A simple average, smoother, ideal for identifying longer-term trends in PVT.
- "SMA + Bollinger Bands": This unique option not only displays a Simple Moving Average but also activates the Bollinger Bands around the PVT. This is the recommended option for analyzing volatility and ranges using Bollinger Bands.
- "EMA" (Exponential Moving Average): An exponential average, giving more weight to recent data, responding faster to changes in PVT.
- "SMMA (RMA)" (Smoothed Moving Average): A smoothed average, providing extra smoothing, less sensitive to noise.
- "WMA" (Weighted Moving Average): A weighted average, giving progressively more weight to recent data, responding very quickly to changes in PVT.
Moving Average Length: Defines the number of bars used to calculate the moving average (and, if applicable, the standard deviation for the Bollinger Bands). A lower value will make the line more responsive, while a higher value will smooth it out.
PVT BB StdDev (Bollinger Bands Standard Deviation): Determines the width of the Bollinger Bands. A higher value will result in wider bands, making it less likely for the PVT to cross them. The standard value is 2.0.
4. Visual Aid: Current PVT Level Line
This indicator includes a unique and highly useful visual feature: a dynamic horizontal line displayed on the PVT graph.
Purpose: This line marks the exact level of the PVT on the most recent trading bar. It extends across the entire chart, allowing for a quick and intuitive comparison of the current level to past levels.
Why is it Important?
- Identifying Divergences: Often, an asset's price may be lower or higher than past levels, but the PVT level might be different. This auxiliary line makes it easy to spot situations where PVT is at a higher level when the price is lower, or vice-versa, which can signal potential trend changes (e.g., higher PVT than in the past while price is low could indicate strong accumulation).
- Quick Direction Indication: The line's color changes dynamically: it will be green if the PVT value on the last bar has increased (or remained the same) relative to the previous bar (indicating positive buying pressure), and red if the PVT value has decreased relative to the previous bar (indicating selling pressure). This provides an immediate visual cue about the direction of the cumulative momentum.
5. Important Note: Trading Risk
This indicator is intended for educational and informational purposes only and does not constitute investment advice or a recommendation for trading in any form whatsoever.
Trading in financial markets involves significant risk of capital loss. It is important to remember that past performance is not indicative of future results. All trading decisions are your sole responsibility. Never trade with money you cannot afford to lose.
