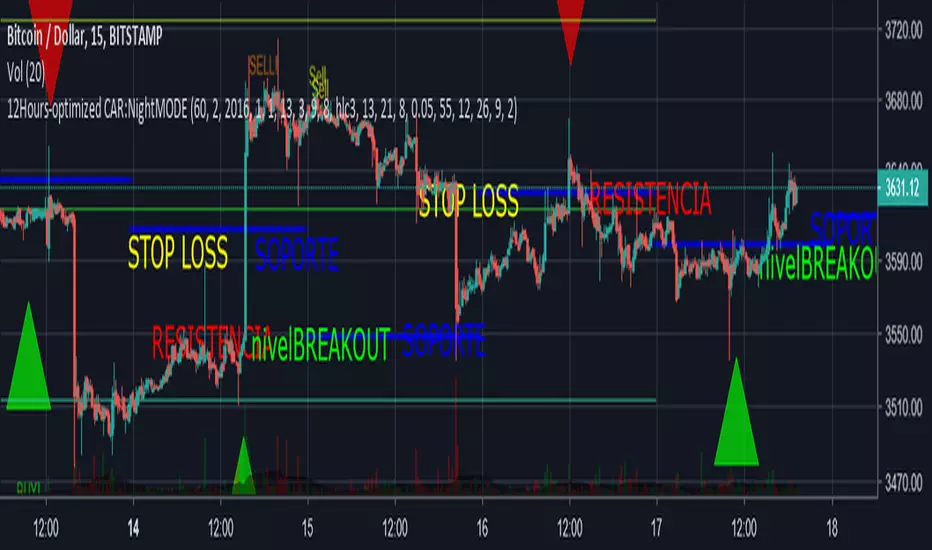
12Hours-optimized Crypto Alert ReloadedSame as 4H, but this time 12H.
In my opinion this one is way more accurate, let me know yours.
UPDATES:
I added Short Sell signals, both Red and Blue means "Short Sell", but they use different formulas. The blue one seems pretty solid, meanwhile the red one get more oportunities but might give an earlier entrance aswell.
Remember no software is 100% accurate, but this one seems at least >90% accurate so I guess that with a decent risk management and order placing you will make great profit.
The script gave1 bad short signal in whole 2018, and 4 bad buy signals, pretty decent on a market as cryptos, and at a correction phase.
Again, let me know your opinion, feedback, and critics.
Stay aware since I will update it for sure, I'm already working on it.
Soon:
*Filtering signal by candlestick patterns
*Pivot levels for resistance and support forecast beforehand.
*and more cool features ;)
Thanks again!
Bitcoinforecast
Bitcoin Daily Buy & Sell SignalBitcoin Top Secret Found!
Trying to find potential Buy & Sell points.
It's pretty helpful and accurate in daily chart.
You could even use it on NASDAQ:NDX !
Invite only for valuation now.

Spectro™ M by HypesterThis is the commercial version of the Spectro™ M
The new BADASS Spectro™ M
Ok, I gotta say this is so cool that I've been dying to write this release note, we're really proud with the amazing features we are releasing and the fact we could deliver them without raising the prices.
Spectro™ Alerts New Settings
The classic and loved entry/exit point finder, and now you can set the Spectro™ Alerts to your own preferences from aggressive to the safest triggering style. So now it can adapt to any trading style easily, from minute-leveraged scalping to yearly positions.
Spectro™ Indicator (Pro 8X Indicator )
This is the Spectro™ brain, and before this update, it was an indicator that was worth extra $10, but now we decided to implement it on the M version for free! Knowing how Spectro™ is behaving will give you an edge when forecasting entry/exit points.
Spectro™ Direction Change Alerts
A life saver, subscriber's words not mine. Spectro™ plots warning signs when it detects possible trend changes before they happen!
Spectro™ Multi-Resolution
Another heavily requested feature, now you can check buy/sell alerts from other timeframes on your chart. Let's say you're trading on 5M but you only want the strongest signals, so you set your custom timeframe to 15M. Or if you are trading a 12H timeframe and you are sure of a reversal and you're trying to catch the bottom so you play around with the custom resolution around 30M~2H for a more reactive triggering.
Or you might just want to confirm if you have a buy on the Daily before proceeding, that's a smart way to check the mid-range trend.
Specter Clouds
This is dope. I wish I could be more polite but this is as badass as it gets. This awesome new feature will tell you when the price is growing or decreasing out of the "organic" area, therefore, it will warn that whatever you're seeing, you shouldn't. In plain English: It means a reversal is coming.
But it doesn't only warns you about reversals several bars before, it also forecasts the future price targets for the respective reversal!
Also, the coloring of the cloud helps you find the bottom/top, the very beginning of the following reversal.
X Algo Confirmations
This is practical as ****! We know you guys are always checking other indicators to improve your odds so we decided to do it for you, but faster, better and more precise. We called it X because it checks so many indicators that we just called it X.
This is a proprietary blend weighted average between several indicators, you can name all the common ones...STOCH, RSI, STOCH RSI, BB, DMI, ATR, MFI, OBV, CCI, MFI, DPO, MACD, EMO, TSI, Elliot Waves, Fractal Patterns, Fibonacci LEVELS...well you get it... plus 3 proprietary indicators on the conservative mode. Now speaking English: We check up to 20 indicators for you and deliver it in a way that all it takes is one second to check ALL of them.
It also has an aggressive, moderate and conservative mode. The difference is just the amount indicators we check for you, more confirmations you need, more conservative you are.
Trend Analyser 2.0
We offer 3 types of TA. A brand-new proprietary price-based trend analyzer that warns you about violent price change and corrections, an MA blend good for scalping and spotting trend reversals and a classic fully customizable MA crossing.
Spectro offers you 8 different types of the most popular moving averages for the custom mode, from Simple Moving Averages to Fractal Moving Averages - so that creates 64 basic trend analyzer options. You can change the lookback (length) period, time frame resolution, and more. Resulting in a very flexible, simple to use and powerful trend analyzer with endless customization options.

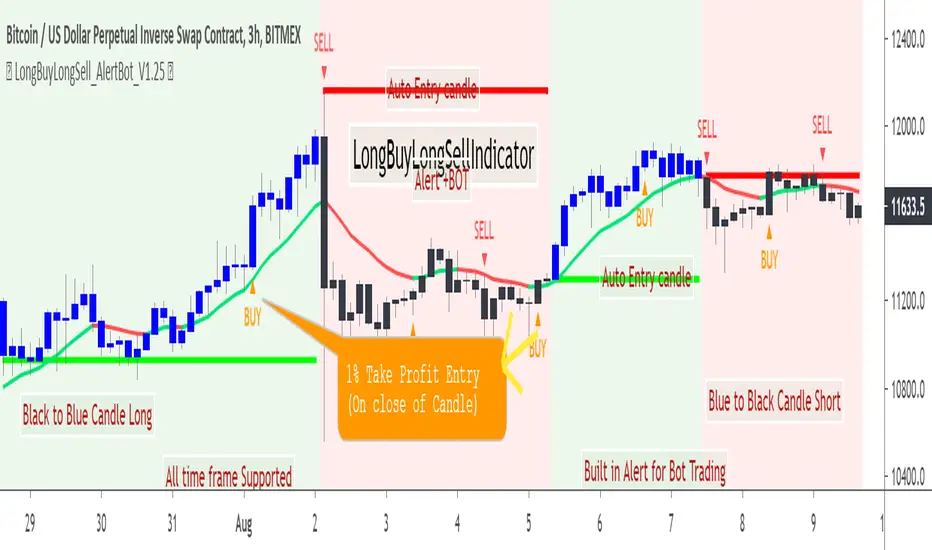
LongBuyLongSellIndicatorHello Friends,
Here is one more very simple to use LongBuyLongSellIndicator for trading. Details are given above in the chart.Happy trading.
This indicator can be used for very long term trading in any time frame. This is designed to avoid many noise in between the trade.
This indicator does not require any additional indicator setup ;as like traders do in price action trading ,just need to follow the colors for trading .
Always remember Black to Blue transition BUY (or cover the short position)
Blue to Black transition SELL(or cover the buy position)
Do not trade in the middle and ignore other colors if appear in the chart
Other Indicator that may be useful:
BUY2SELL2BUYindicator
SELL2BUY2SELLindicator
ProfitCandleBillionWayIndicator
Access is through invite only
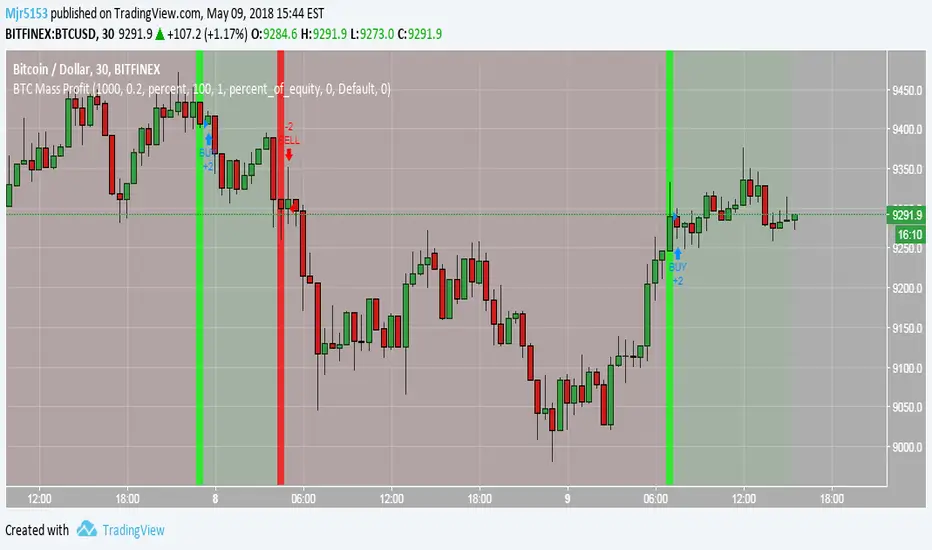
BTC Massive ProfitThis script is meant to be used on BTC while viewing the 30m chart. This script has generated MASSIVE profits. Greatest BTC script on the market
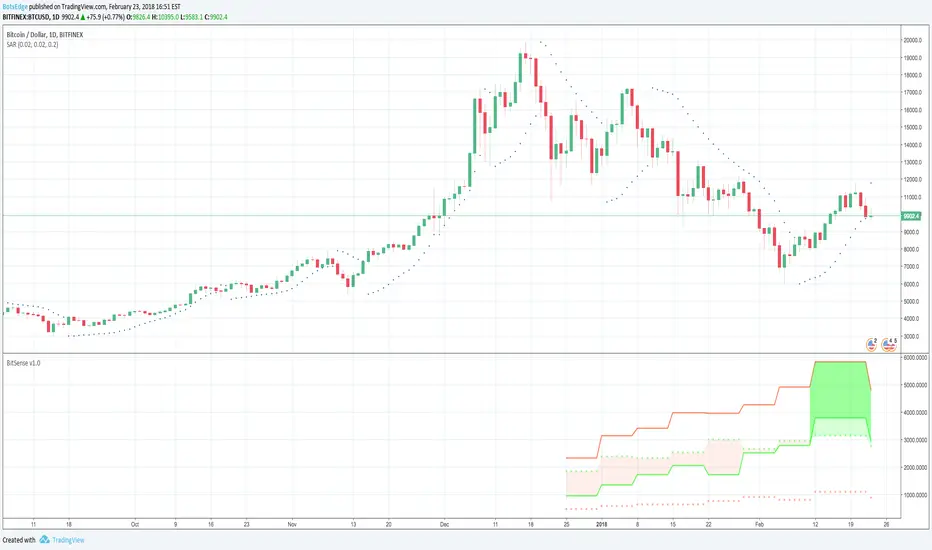
BTC-USD Commitment of Traders Bitsense v1.0INDICATOR EXPLANATION
The main data from the COT report is plotted using 4 lines. These are
The solid red line shows the commercial short (hedge) positions
The solid green line shows the commercial long positions
The dotted red line shows the non commercial short (not hedging) positions
The dotted green line shows the non commercial long positions
The shaded areas show the long and short situation in the bitcoin market as weak and strong
The lighter the color, the weaker the market is. So for example for Jan 2018 the first full month with the new futures we see a light red color between the commercial (solid green) and the noncommercial (dotted green) positioning line. This means that the market is weakening but on a longer timeframe still on an upward move. So this is a possible launchzone for any short trade but it is weak
The darker the color, the stronger the market. So for example in the middle of Feb 2018 we see a bigger area with different shades of green. There is a light green color shown between the commercial long (solid green) and the non commercial long (dotted green) line and a darker green color between the commercial long (solid green) and the commercial short (solid red) line. So this is a possible and strong launchzone for a long trade in bitcoin
HOW TO USE
Whenever Bitsense shows a light shaded colored area, that area then can be used as a launchzone for trades in the direction of the market but one needs to know that the light colors represent weak market conditions. So a light shaded red area represents a possible launchzone for a short trade but it is a very weak short market (no matter how many points the market moves in that direction it is still a weak condition)
Whenever Bitsense shows a darker shaded colored area, that area then can be used as a launchzone for trades in the direction of the market. The same goes for areas where light and darker shaded areas are together. These represent strong market conditions
As can be seen (mid feb 2018), even though the commercial shorts stay on top, Bitsense shows a strong long situation and the market starts rising. The COT report is different from traditional indicators and Bitsense shows this clearly. To explain, both of the dotted lines show the non commercial positions either long or short. These positions are traded in the direction of their color, so if the non commercial dotted green line stays on top of the non commercial red dotted line there are more long positions on bitcoin futures out there than there are short positions. But this is not that easy with the commercial positions. These are usually hedging positions which means a high commercial solid red line represents the commercial traders hedging a market that they think i a) high and b) can rise more, so they sell short positions to lock in gains from the market position, whereas solid green line commercial positions start rising only when markets are low because these traders usually lock in cheap market prices with buying long positions
Since there is just a very short accumulation of data since the inception of both bitcoin futures the indicator still might not work correctly and you have to be very careful in using it. It is published here as an information tool only and should not be used for any real trading without other means of information about the market
By using this indicator you acknowledge that you have read and understood that this is for research purposes only and I am not responsible for any financial losses you may incur by using this indicator. All trading involves high risk and past performance is not necessarily an indication of future results