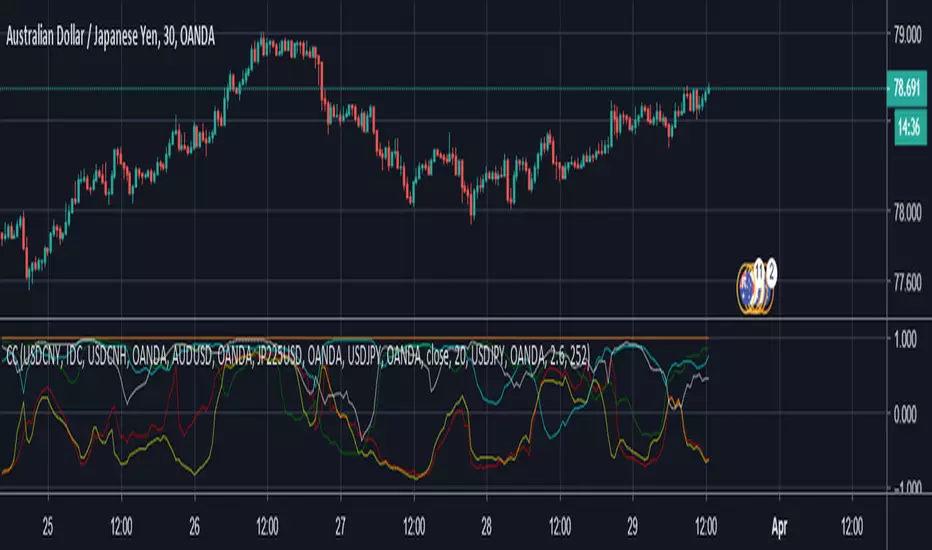
Multi-Asset Correlation CoeffThis is just a modified correlation coefficient indicator that shows the correlation coefficient between five different assets and the one on the chart.
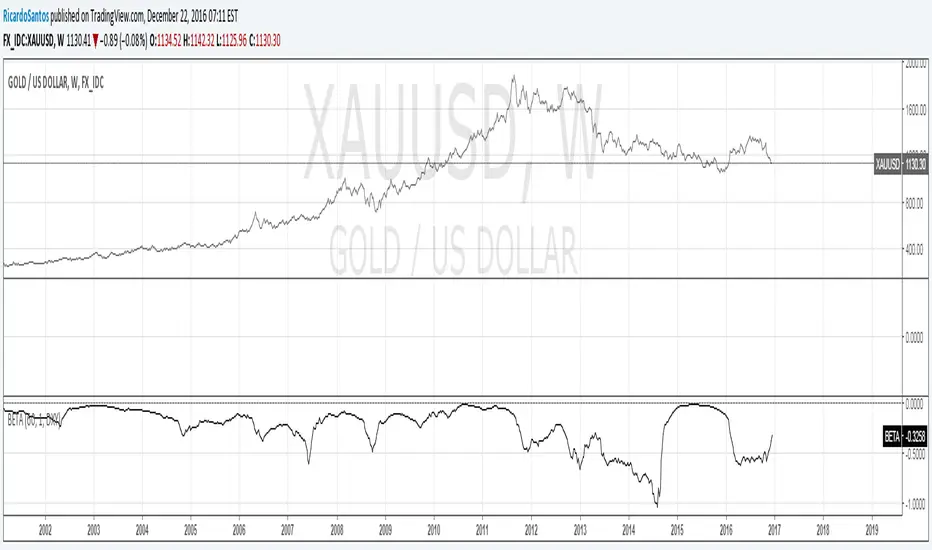
Beta
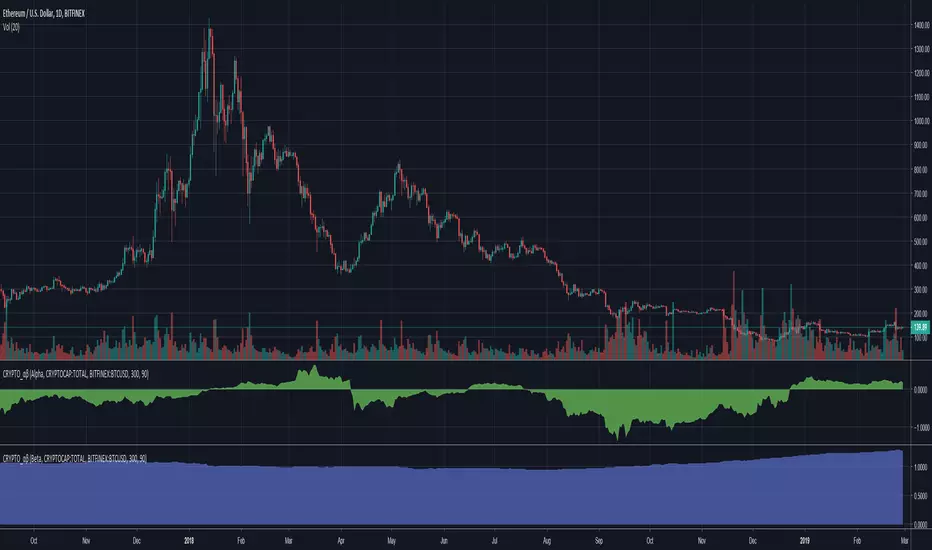
Cryptocurrency α / β (Alpha and Beta)Alpha and Beta for cryptocurrency. Custom input for other symbols.
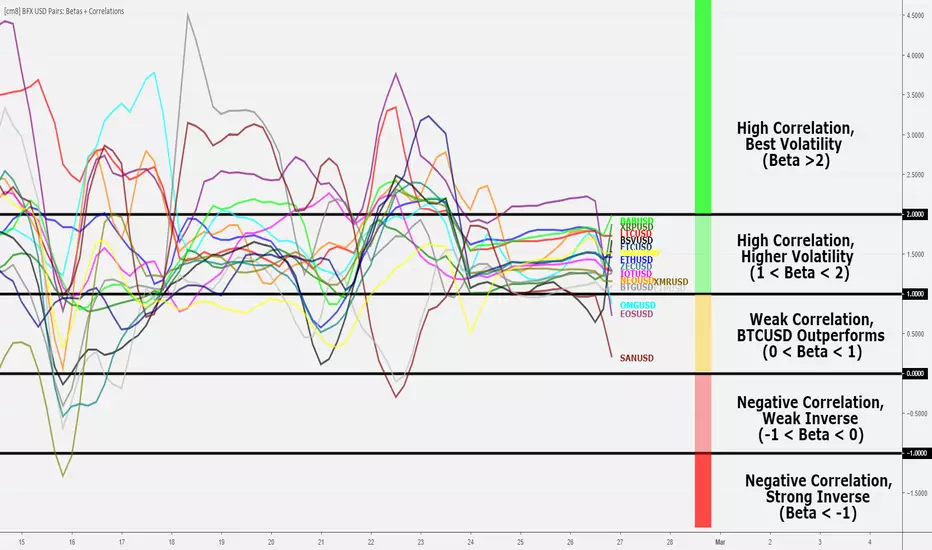
Bitfinex USD Pairs: Betas and Correlations [checkm8]Hello and welcome to my beta and correlation indicator!
This indicator is meant to be used to assess trading alternatives to BTCUSD on Bitfinex, examining alt-USD pairs that can be traded on margin. This list is as follows:
ETHUSD
LTCUSD
EOSUSD
NEOUSD
OMGUSD
XRPUSD
IOTUSD
BCHUSD
SANUSD
ETPUSD
ETCUSD
XMRUSD
ZECUSD
DSHUSD
Before dwelling further on the script, let's revisit the definitions of beta and correlation:
Beta is a statistical measure of a %-change in an asset relative to a 1% change in a benchmark. In our case - this is BTCUSD. For example, if the beta is 1.5, it means that the particular asset moves 1.5% in the same direction as the 1% change of the benchmark. If the beta is negative, the asset is moving in opposite direction of the benchmark. Note: beta is not confined to any range.
Correlation is a statistical measure of the relationship between two assets, from a range of +1 to -1, where a score of +1 implies perfect positive correlation (prices move in the same direction), -1 implies perfect negative correlation (inverse relationship), and 0 implies no relationship in price changes.
For the calculations, BITFINEX:BTCUSD is used as the benchmark.
Through the script's settings:
You can select whether to plot betas or the correlations
You can select the desired length to be used in the measure of beta and correlations
You can enable smoothing for less choppy results. This is accompanied by options to modify the smoothing length and the smoothing method, where SMA, EMA, RMA, and WMA are available.
You can enable and disable individual alt pairs from being displayed (ie. if you do not want LTCUSD plotted, you can turn it off)
Below is an example of the correlation setting.
I would recommend using a smoothing input of 3-6, on SMA, and the 4-hour timeframe for good results. I use this indicator for help in deciding what alt pairs to trade on a particular day, where you will want to trade alts with the highest correlations. Note: be weary of less liquid markets, such as ETP and SAN.
Also note: the labels shown in the snapshot are for presentation purposes only. You can enable Indicator Labels by right clicking the oscillator -> "Price Scale" -> "Indicator Labels".
Please let me know if you have any questions, suggestions, or concerns.
Happy trading!
For additional information as to why you should be using this indicator and trading alts instead of BTCUSD, please refer to my study:
Anomaly Indicator V1.1 The Anomaly Indicator is an idea I recently come up with. Its very simple, yet it can be extremely useful. The Anomaly indicator detects the current and general trend channels. When the yellow line which is the current channel, exits the general channel this will usually mean an anomaly. Anomalies can vary within meaning, from a trend reversal, a market change (trending or rangebound) and lastly it can also give you an entering point. You can even use it to know the volatility of the market.
This is a very early version of the indicator and has pre-set values. I personally use it among a 5 minute chart for daytrading.
NOTE : Have in mind my indicator as ny other is not perfect, it might give fake signals. I suggest using Williams Alligator, and RSI with it. Best of luck. Follow my predictions under your own risk.

Beta coefficientClassic Beta coefficient by the method of Yahoo. Use only on monthly TF with Beta window = 36
You can use any benchmark, for example DIA / SPY / QQQ / DAX / BTCUSD / GC1! / etc

420_betaA newer, more customizable version of the holy grail script I published for silver before.
This script is a work in progress (as was the last version) and although I have been trying to refine this script I would still only classify it in the early stages of development; unlike my previous Euro Dollar strength holy grail script which was designed to work with only the EU pair or the XAGUSD spread script that was designed to work only with silver traded in USD, this script is designed to work with ANY commodity traded in USD, EUR, GBP, or JPY.
In this version I have tried to make smaller time frames work (60 - 240 supported now?) and added a lot of options for average type to be considered in the basket. Not every average created equally though, so I need feedback still etc...
I have also added the ability to specify what the 'basis currency' is. For example XAUUSD --> USD is basis currency. XAGGBP --> GBP is basis currency.
The only supported currencies at the moment are USD, EUR, GBP, and JPY (case sensitive)
If someone requests another (CHF, CAD, etc) I can add that as well.
I have an alert centric version (study, not a strategy) that I am trying out as well on my Euro dollar strength script and this 420_beta script
If you want access, feel free to ask, but as this is still in beta and I'm looking for feedback I'll probably only provide this script to those who have a record of trading commodities here on TV (aka published an idea on XAUUSD, XAGUSD, USOIL, Copper, etc...)
- Snoop

Cyclical vs. Defensive Sector Alphashows mean excess returns of defensive and cyclical sectors vs. S&P500
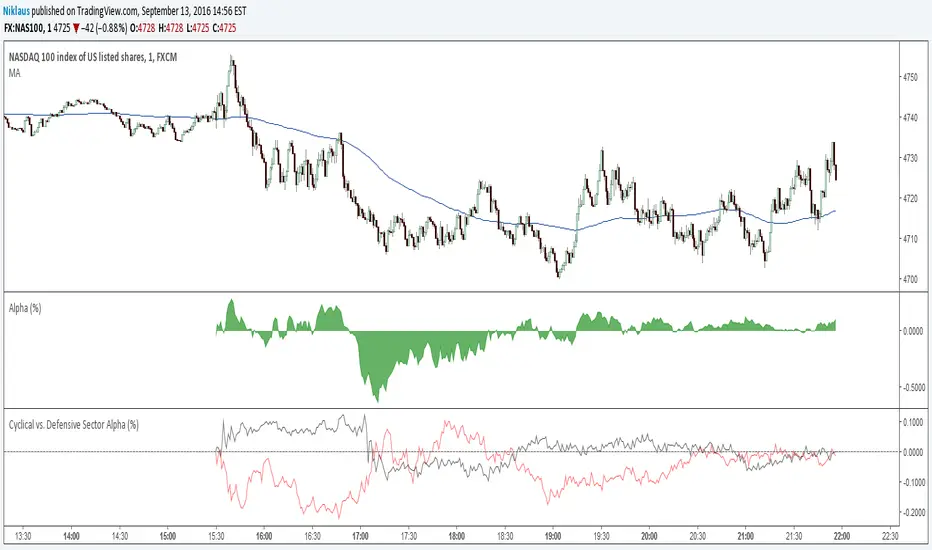

Alpha strategy - simple versionThis Strategy goes long when Sharpe Ratio is > 1 and Alpha against the S&P500 is generated. It exits when conditions break away. en.wikipedia.org(finance). Use on daily or 5min.

Betaen.wikipedia.org(finance)
Beta is a measure of the risk arising from exposure to general market movements as opposed to idiosyncratic factors.
The market portfolio of all investable assets has a beta of exactly 1 (here the S&P500). A beta below 1 can indicate either an investment with lower volatility than the market, or a volatile investment whose price movements are not highly correlated with the market

Alpha strategyUSE ON DAILY TIMEFRAME TO DETECT MOMO STOCKS & ETFs AND TRADE THEM
This Strategy goes long when Sharpe Ratio is > 1 and Alpha against the S&P500 is generated. It exits when conditions break away. Strategy can be adapted to run intraday, it however needs different (lower) trigger levels.
examples to try this on: GER30, NAS100, JPN225, AAPL, IBB, TSLA, etc.

AlphaAlpha is a measure of the active return on an investment, the performance of that investment compared to the S&P500 index, where 0.01 = 1%
alpha < 0: the investment has earned too little for its risk (or, was too risky for the return)
alpha = 0: the investment has earned a return adequate for the risk taken
alpha > 0: the investment has a return in excess of the reward for the assumed risk

K.M Trend Alerts (BETA 1.2)Like I said previously in the " K.M Trend Strategy (BETA 1.2) " this is the script to set alerts. If you haven't seen the strategy one please search it. Please look at the strategy post to see more information. Thank you.
Buy Alerts = P (greater then) B
Sell Alerts = P (less then) B
Sincerely,
Kevin Manrrique
Follow us on Instagram: TWTForexGroup, we have amazing content and also sell signals.

K.M Trend Strategy (BETA 1.2)My beautiful traders, how is everyone doing? This indicator I built detects trends, I haven't seen any repaints, I only had 3 minor ones. It is still on BETA version.
To all new traders, and busy traders I will be posting one that you can set alerts. Please look under my profile or type " K.M Trend Alerts (BETA 1.2) " .
I ask for everyone to try this script out, please provide any feedback under in the comments below. Any feedback will be amazing! Thank you to everyone, and www.tradingview.com.
Sincerely,
Kevin Manrrique
Follow us on Instagram: TWTForexGroup, we have amazing content and also sell signals!

Market BetaPlots the historical beta of the selected security to the S&P500. The observation period is adjustable

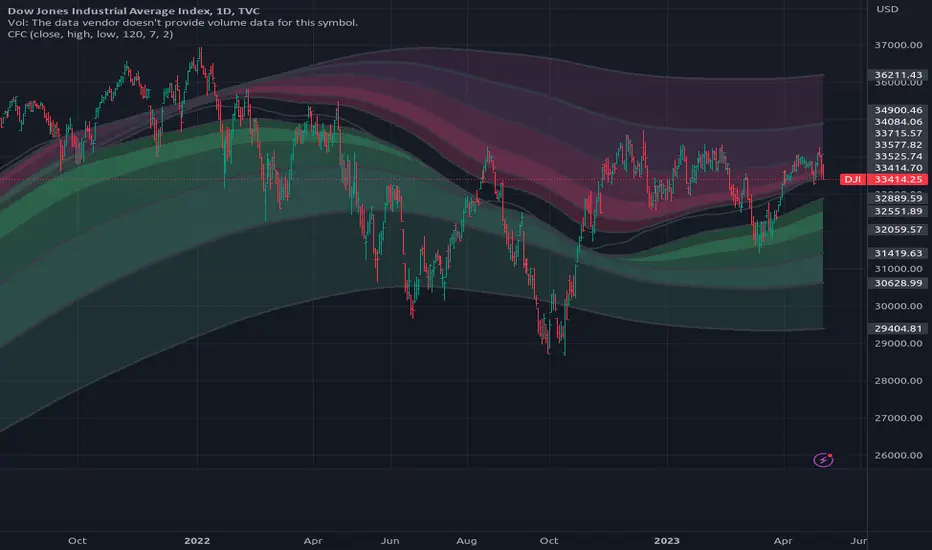
[RS][UNTESTED]CAP Fibo Channel V2V2 of previous CFC, added optional bull/bear squeeze.
squeeze can get a bit messy on extremely oversold/overbought markets like currently USDJPY in 1 hour timeframe, or any currency on low time frame during high volatility.
[RS]Absolute Levelsstudy is still in early phase of development and is a bit slow loading be patient.
Absolute levels based on historic highest high value and time frame. looking for feedback ;)
