Quansium Allocation RatioThis tool finds the most optimal allocation size for each trading setup. It has 3 modes.
Basic (it meets the minimum profitability requirements):
% Profitable: the probability of winning and is calculated by dividing the number of winning trades by the total number of trades.
Profit Ratio: a measure of the ability to generate profit instead of loss and is calculated by taking the average profit from all winning trades divided by the average losses on all losing trades.
Medium (it takes into account the maximum loss to stabilize the overall risk among the partitions):
Max Drawdown: the "worst-case scenario" for a trading period. It measures the greatest distance, or loss, from a previous equity peak.
Advanced (loss is not the only risk taken, the reward to risk ratio must also be accounted for):
Monthly Profit: the amount of average return a system provides on a monthly basis.
Monthly Loss: the highest loss given during the period of a month. It can be substituted by the Max Drawdown.
Notes :
The "check boxes" inputs are there as cosmetic separators.
"Basic" mode comes with preset values. To activate other modes, you must use a value higher than "0".
This shows the amount of percentage you should allocate for the setup you inserted the metrics for.
It is recommended to get values for each mode and find out on past data which works best for you.
Backtest

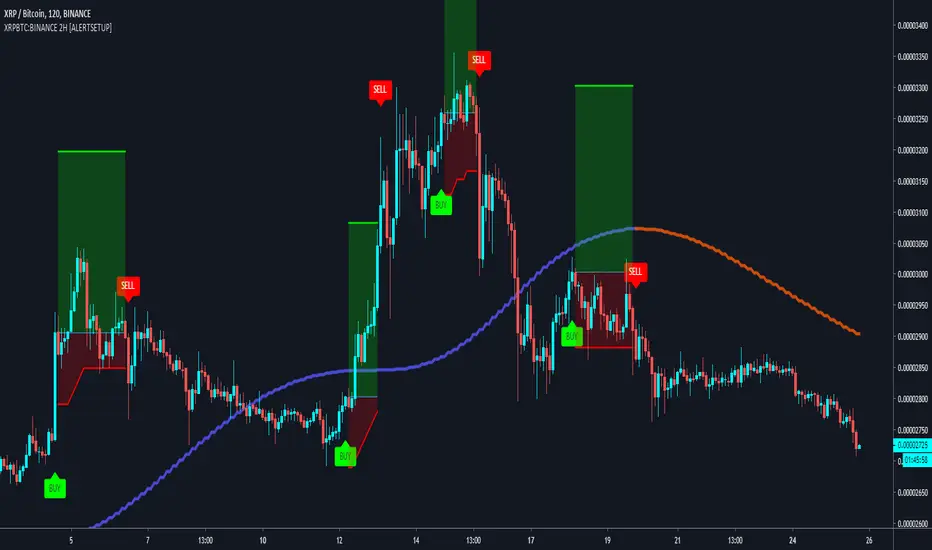
Buy & Sell XRPBTC:BINANCE 2H Trading BotBuy & Sell Alert system for BINANCE:TRXBTC
Goal is to Beat Buy & Hold on the 2H (see backtest below)
Built upon the Supertrend, ADX and Tilson T3 indicators.
A trailing Stop loss in integrated to the script, as well as a Take profit system.
To get the indicator, please use the link below, thanks!
BEST ABCD Pattern StrategyHello traders
This is the strategy version of this script
I - Concept
I present to you, ladies and gentlemen, the first screener for harmonic patterns.
Starting with an ACBD pattern screener this time!!
I used the calculations from Ricardo Santo's script
In short, he's using fractals (regular or Bill Williams ) for the pattern calculations. A masterpiece !!!
II - Definitions
The ABCD pattern ( AB=CD ) is one of the classic chart patterns which is repeated over and over again.
The ABCD pattern shows perfect harmony between price and time.
The Williams Fractal is an indicator, developed by Bill Williams, that aims to detect reversal points (highs and lows) and marks them with arrows.
Up fractals and down fractals have specific shapes. The Williams Fractal indicator helps users determine in which direction price will develop
💎Strategy filters💎
I included some cool backtest filters:
- flexible take profit in USD value (plotted in blue)
- flexible stop loss in USD value (plotted in red)
The take profit and stop loss should work with Forex/FX pairs as well
All the BEST
Dave

Combo Backtest 123 Reversal & CMOaDisparity Index This is combo strategies for get a cumulative signal.
First strategy
This System was created from the Book "How I Tripled My Money In The
Futures Market" by Ulf Jensen, Page 183. This is reverse type of strategies.
The strategy buys at market, if close price is higher than the previous close
during 2 days and the meaning of 9-days Stochastic Slow Oscillator is lower than 50.
The strategy sells at market, if close price is lower than the previous close price
during 2 days and the meaning of 9-days Stochastic Fast Oscillator is higher than 50.
Second strategy
The related CMOaDisparity Index article is copyrighted material from Stocks & Commodities Dec 2009
My strategy modification.
WARNING:
- For purpose educate only
- This script to change bars colors.

Combo Backtest 123 Reversal & Directional Trend Index (DTI) This is combo strategies for get a cumulative signal.
First strategy
This System was created from the Book "How I Tripled My Money In The
Futures Market" by Ulf Jensen, Page 183. This is reverse type of strategies.
The strategy buys at market, if close price is higher than the previous close
during 2 days and the meaning of 9-days Stochastic Slow Oscillator is lower than 50.
The strategy sells at market, if close price is lower than the previous close price
during 2 days and the meaning of 9-days Stochastic Fast Oscillator is higher than 50.
Second strategy
This technique was described by William Blau in his book "Momentum,
Direction and Divergence" (1995). His book focuses on three key aspects
of trading: momentum, direction and divergence. Blau, who was an electrical
engineer before becoming a trader, thoroughly examines the relationship between
price and momentum in step-by-step examples. From this grounding, he then looks
at the deficiencies in other oscillators and introduces some innovative techniques,
including a fresh twist on Stochastics. On directional issues, he analyzes the
intricacies of ADX and offers a unique approach to help define trending and
non-trending periods.
Directional Trend Index is an indicator similar to DM+ developed by Welles Wilder.
The DM+ (a part of Directional Movement System which includes both DM+ and
DM- indicators) indicator helps determine if a security is "trending." William
Blau added to it a zeroline, relative to which the indicator is deemed positive or
negative. A stable uptrend is a period when the DTI value is positive and rising, a
downtrend when it is negative and falling.
WARNING:
- For purpose educate only
- This script to change bars colors.

Combo Backtest 123 Reversal & DiNapoli Detrended Oscillator This is combo strategies for get a cumulative signal.
First strategy
This System was created from the Book "How I Tripled My Money In The
Futures Market" by Ulf Jensen, Page 183. This is reverse type of strategies.
The strategy buys at market, if close price is higher than the previous close
during 2 days and the meaning of 9-days Stochastic Slow Oscillator is lower than 50.
The strategy sells at market, if close price is lower than the previous close price
during 2 days and the meaning of 9-days Stochastic Fast Oscillator is higher than 50.
Second strategy
DiNapoli Detrended Oscillator Strategy
WARNING:
- For purpose educate only
- This script to change bars colors.

BEST Engulfing + Breakout StrategyHello traders
This is a simple algorithm for a Tradingview strategy tracking a convergence of 2 unrelated indicators.
Convergence is the solution to my trading problems.
It's a puzzle with infinite possibilities and only a few working combinations.
Here's one that I like
- Engulfing pattern
- Price vs Moving average for detecting a breakout
Definition
Take out the notebooks :) and some coffee (good for focus). I'm bullish in coffee
The engulfing pattern is a two-candle reversal pattern.
The second candle completely ‘engulfs’ the real body of the first one, without regard to the length of the tail shadows.
The bullish Engulfing pattern appears in a downtrend and is a combination of one red candle followed by a larger green candle
The bearish Engulfing pattern appears in a downtrend and is a combination of one green candle followed by a larger red candle
Example: imgur.com
We're bored sir... what's the point of all this?
In summary, an engulfing is a pattern to track reversals. (the whole TradingView audience stands up now giving a standing ovation)
Adding the Price vs Moving average filters allows to track reversals with momentums (half of the audience collapsed because this is too awesome)
Ok sir... you picked up my interest
I included some cool backtest filters:
- date range filtering
- flexible take profit in USD value (plotted in blue)
- flexible stop loss in USD value (plotted in red)
All the best
Dave

Cyatophilum Intraday Breakouts [BACKTEST]Private indicator. Access can be unlocked by purchasing a subscription on my website which link is in my profile signature.
Here is the backtest version of the Triple Screen Strategy
Recap of the strategy:
The goal of this indicator is to be able to automate and backtest the strategy, all while staying on a single chart and without repainting.
Features:
Market Tide MACD configuration
Market Wave choice between 3 oscillator: Elder Force Index, Stochastic and William Percent Range
Automated Long and Short entries alerts
Integrated Trailing Stop Loss system fully configurable with automated exit alerts
Integrated Trailing Take profit system fully configurable with automated exit alerts
Indicator samples
Backtest
Strategy time period can be choosen in the parameters of the indicator.
Be aware that the chart is limited to 10 000 candles of the current timeframe for the backtest calculation.
Default initial capital: 10 000$
Default order size: 100% of equity
Default commission fees: 0.1% per transaction
Backtest results below.
Alerts
Entry Long: Triggers on green long labels.
Take Profit Long: Triggers on the "TAKE PROFIT" green flag if the long target is reached.
Stop Loss Long: Triggers on the "STOP LOSS" or "TSSL" label if the stop loss line has been crossed.
Exit Long: Triggers on either of Take Profit Long or Stop loss long.
Entry Short: Triggers on red short labels.
Take Profit Short: Triggers on the "TAKE PROFIT" green flag if the short target is reached.
Stop Loss Short: Triggers on the "STOP LOSS" or "TSSL" label if the stop loss line has been crossed.
Exit Short: Triggers on either of Take Profit Short or Stop Loss Short.
You can get access to this indicator by purchasing a subscription using the link below.
Thanks for reading!

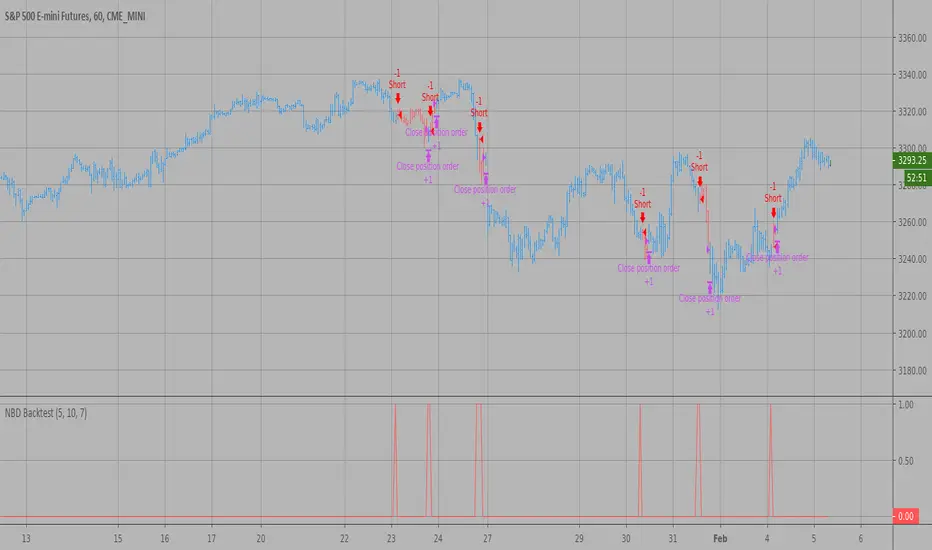
N Bars Down Backtest Evaluates for n number of consecutive lower closes. Returns a value
of 1 when the condition is true or 0 when false.
WARNING:
- For purpose educate only
- This script to change bars colors.
Strategy - Backtest Uber SSL Channel / SSL Indicator [UTS]Backtesting of Uber SSL Channel / SSL Indicator
Backtest with focus win/loss profitability. Formula: profitability = win / (win+loss)
Do not put too much weight on trade PNL as the value is not necessary correct.
For example: on SL or TP hit an open position is marked as to be closed but executed on the open a new candle, thus leads to incorrect PNL.
Default equity 50k
Default 2% Risk per trade
Default currency USD
Define backtest interval precisely by month, year, day
ATR (len: 14, smooth: SMA)
ATR based Stop-Loss, if hit trade will be closed and considered as loss
ATR based Take-Profit, if hit trade will be closed and considered as win
If TP or SL is hit trade is closed and of course considered as win/loss
---
DM me / Tip (see Signature) or Subscribe for access

Strategy - Backtest Uber ASH - Absolute Strength Histogram [UTS]Backtesting of Uber ASH - Absolute Strength Histogram
Backtest with focus win/loss profitability. Formula: profitability = win / (win+loss)
Do not put too much weight on trade PNL as the value is not necessary correct.
For example: on SL or TP hit an open position is marked as to be closed but executed on the open a new candle, thus leads to incorrect PNL.
Default equity 50k
Default 2% Risk per trade
Default currency USD
Define backtest interval precisely by month, year, day
ATR (len: 14, smooth: SMA)
ATR based Stop-Loss, if hit trade will be closed and considered as loss
ATR based Take-Profit, if hit trade will be closed and considered as win
If TP or SL is hit trade is closed and of course considered as win/loss
---
DM me / Tip (see Signature) or Subscribe for access

Key Reversal Up Backtest
A key reversal is a one-day trading pattern that may signal the reversal of a trend.
Other frequently-used names for key reversal include "one-day reversal" and "reversal day."
How Does a Key Reversal Work?
Depending on which way the stock is trending, a key reversal day occurs when:
In an uptrend -- prices hit a new high and then close near the previous day's lows.
In a downtrend -- prices hit a new low, but close near the previous day's highs
WARNING:
- For purpose educate only
- This script to change bars colors.

How To Set Backtest Time Ranges
Example how to set the time range window to be backtested for both entries and exits. Additional examples are also included showing how to set the date range and toggle plot visibility.
By incorporating this code with your own strategy's logic, it will allow you to backtest various time windows.
Much gratitude to @LucF and @a.tesla2018 for help with including ':1234567' for time ranges on weekends. Thank you both!
NOTICE: This is an example script and not meant to be used as an actual strategy. By using this script or any portion thereof, you acknowledge that you have read and understood that this is for research purposes only and I am not responsible for any financial losses you may incur by using this script!

Key Reversal Down Backtest A key reversal is a one-day trading pattern that may signal the reversal of a trend.
Other frequently-used names for key reversal include "one-day reversal" and "reversal day."
How Does a Key Reversal Work?
Depending on which way the stock is trending, a key reversal day occurs when:
In an uptrend -- prices hit a new high and then close near the previous day's lows.
In a downtrend -- prices hit a new low, but close near the previous day's highs
WARNING:
- For purpose educate only
- This script to change bars colors.

BEST Supertrend StrategyHello traders
Sharing a sample Supertrend strategy to illustrate how to calculate a convergence and using it in a strategy
I based the setup as follow:
- Entries on Supertrend MTF breakout + moving average cross. Entering whenever there is a convergence
- exit whenever a Simple Moving Averages cross in the opposite direction happen
- possibility to filter only Longs/Shorts or both
All the best
Dave

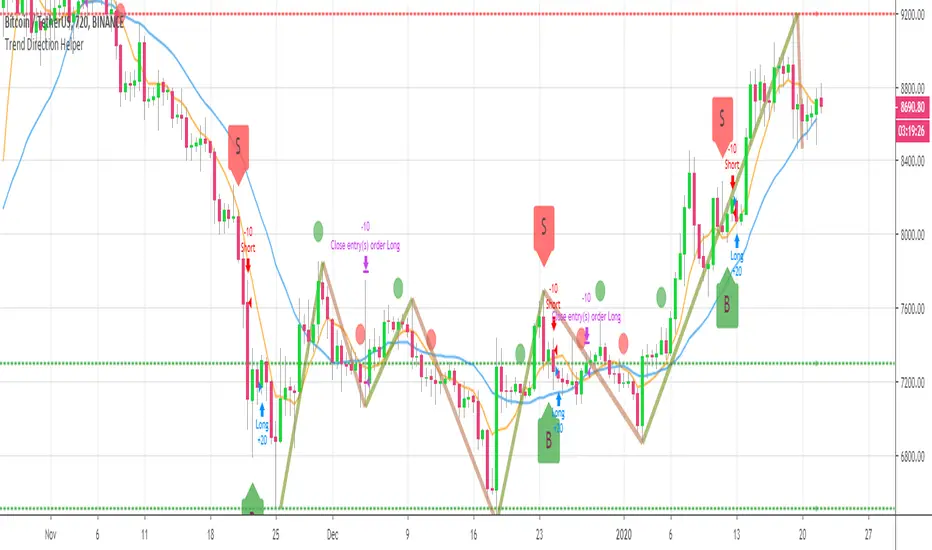
BEST Trend Direction Helper (Strategy Edition)Hello traders
A follower asked me to convert my Trend Direction Helper into a strategy
So blessed this indicator reached the 1400+ likes milestone - I can't believe how many people are trading with it
I based the setup as follow:
- Entries on those green/red labels
- exit whenever a Simple Moving Averages cross in the opposite direction happen
- possibility to filter only Longs/Shorts or both
Also...
The strategy includes the Zig Zag/Pivots high/low and other options from the indicator version. I only added a quick strategy component with a hard exit concept based on SMA cross
All the best fam and... HAPPY NEW YEAR !!!!!!!!!!!
Dave
HXRO Bot Backtest Time HighlightThis script allows you to highlight the HXROBot backtest interval with the possibility of fragmenting the view to better identify the key areas of your strategy
Expert studio strategy 1 - GBPUSDThis is part of a series of strategies developed automatically by a online software.
I cannot share the site url, which is not related to me in any way, because it is against the TV reules.
This strategy was optimized for GBPUSD, timeframe 1D, fixed lots 0.1, initial balance 1000€.
LOGIC:
- LONG ENTRY when previous candle is bear
- LONG EXIT: RVI > signal line
- SHORT ENTRY when previous candle is bull
- SHORT EXIT: RVI < signal line
NOTE: I considered the open of actual candle instead of close otherwise there will be a back shift of 1 candle in pine script
Take profit = no
Stop loss = no
I have also a study with alarms.
Please use comment section for any feedback.

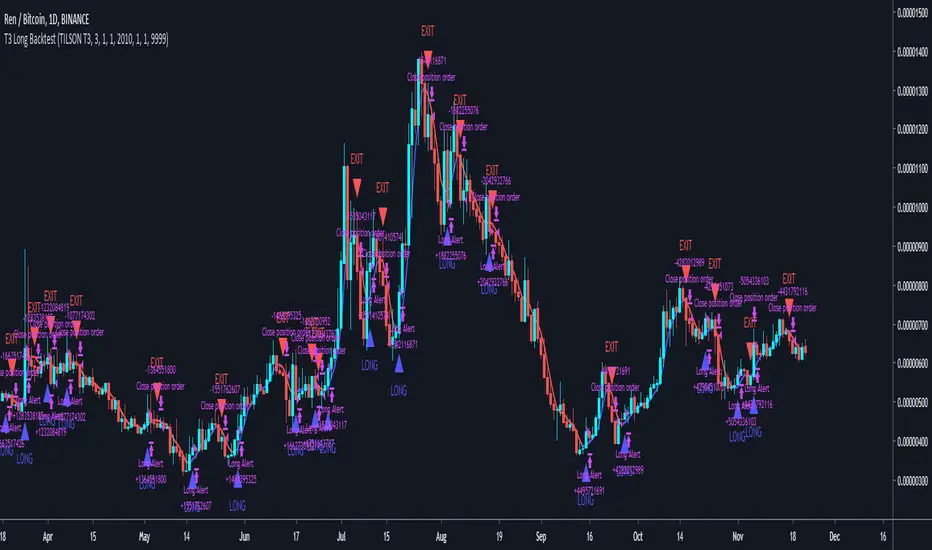
T3 Long BacktestPrivate script commissioned by someone.
Long only backtest using T3 trend line.
Default settings for BINANCE:RENBTC 1D.
Combo Backtest 123 Reversal & D_DSP (Detrended Synthetic Price) This is combo strategies for get a cumulative signal.
First strategy
This System was created from the Book "How I Tripled My Money In The
Futures Market" by Ulf Jensen, Page 183. This is reverse type of strategies.
The strategy buys at market, if close price is higher than the previous close
during 2 days and the meaning of 9-days Stochastic Slow Oscillator is lower than 50.
The strategy sells at market, if close price is lower than the previous close price
during 2 days and the meaning of 9-days Stochastic Fast Oscillator is higher than 50.
Second strategy
Detrended Synthetic Price is a function that is in phase with the
dominant cycle of real price data. This DSP is computed by subtracting
a half-cycle exponential moving average (EMA) from the quarter cycle
exponential moving average.
See "MESA and Trading Market Cycles" by John Ehlers pages 64 - 70.
WARNING:
- For purpose educate only
- This script to change bars colors.

Cyatophilum Ultimate Trading Bot [BACKTEST]Private Indicator.
This is an indicator for trading low timeframes . It is generic and configurable meaning you can use it not only on crypto, but also forex, CFD, stocks etc.
HOW IT WORKS
The user chooses between three powerful base strategies: Bollinger Bands + Stoch RSI, RSI Divergences or the SARMA Strategy .
He can also trade support and resistance breakouts , with or without the base strategy.
Use the Alert Setup version to trigger entry and exit alerts .
You can choose between a set of trend lines that will filter trades that are against the main trend in order to increase profitability.
The integrated Trailing Stop Loss will trigger an alert to exit the trade.
You can use the Trailing Take Profit with a configurable % deviation. It will also trigger an exit alert.
SAMPLE USE CASES
XBTUSD 5m BitMEX
XBTUSD 15m BitMEX
ETHUSD 5m BitMEX
ETHUSD 15m BitMEX
USD/WTI 1m IDC (Us Dollar/ WTI Crude OIL)
Backtest below for BITMEX:LTCZ19 in 15m timeframe.
To get access to the indicator, use the link below, thanks for reading!


Customizable MACD (how to detect a strong convergence)Helloooo traders
I wondered once if a MACD was based on an EMA/EMA/SMA or SMA/SMA/EMA (or WHATEVA/WHATEVA/WHATEVA).
Seems they're so many alternatives out there.
I decided to empower my audience more by choosing the type of moving averages you want for your MACD.
More options doesn't always mean better performance - but who knows - some might find a config that they like with it for their favorite asset/timeframe.
I added also a multi-timeframe component because I'm a nice guy ^^
Convergence is my BEST friend
An oscillator (like MACD) is to measure how strong a momentum is - generally, traders use those indicators to confirm a trend.
So understand that a MACD (or any other indicator not based on convergence ) won't likely be sufficient for doing great on the market.
Combined with your favorite indicator, however, you may get great results.
My indicators fav cocktail is mixing :
1) an oscillator (momentum confirmation)
2) a trendline/key level break (momentum confirmation)
3) adding-up on a different trading method but still converging with the first entry.
The reason I'm deep with convergence detection is because I'm obsessed with removing those fakeout signals. You know which ones I'm talking about :)
Those trades when the market goes sideways but our capital goes South (pun 100% intended) - 2 days later, the price hasn't changed much but some lost some capital due to fees, being overexposed, buying the top/selling the bottom of a range they didn't identify.
It's publicly known that ranges are the worst traders' enemy. It's boring, not fun, and .... end up moving in the direction we expected when we go to sleep or outside.
NO ONE/BROKER/EX-GF is tracking your computer - I checked also for mine as it happened for me way too often in the past.
I surely preferred blaming a few external unknown conditions than improving my TA back in the days #bad #dave
But my backtest sir...
Our backtests show what they're being told to show . A backtest without a stop-loss/hard exit logic will show incredible results.
Then trying that backtest with live trading is like in the Matrix movie - discovering the real world is tough and we must choose between the blue pill (learning how to evaluate properly risk/opportunity caught) and the red pill (increasing the position sizing, not setting a stop loss, holding the positions hoping for the best)
Last few words
Convergences aren't invented because it's cool to mix indicators with others. (it is actually and even fun)
They're created to remove most of the fakeouts . For those that can't be removed - a strong risk management would cut most of the remaining potential big losses.
No system works 100% of the time - so a convergence system needs a back-up plan in case the converged signal is wrong (could be stop-loss, hard exit, reducing position sizing, ...)
Wishing you the BEST and happy beginning of your week
Daveatt
