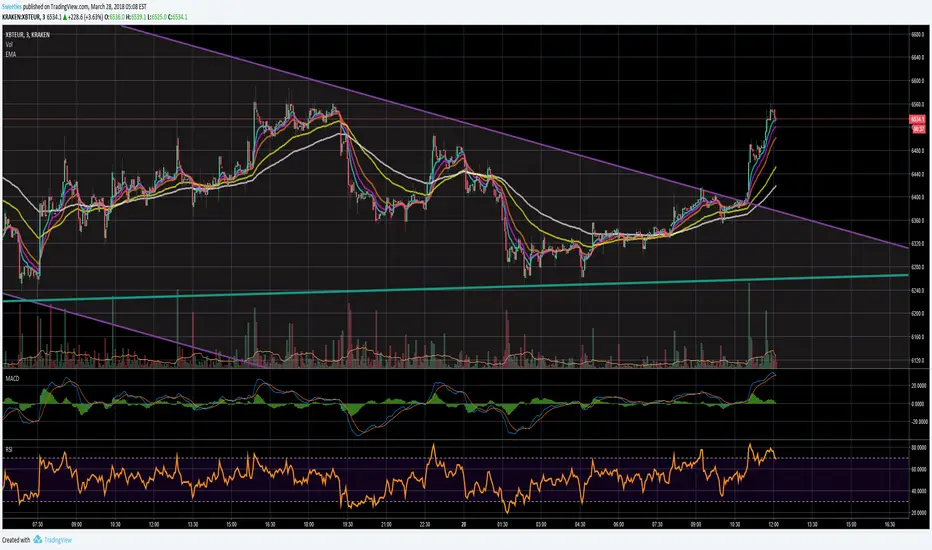
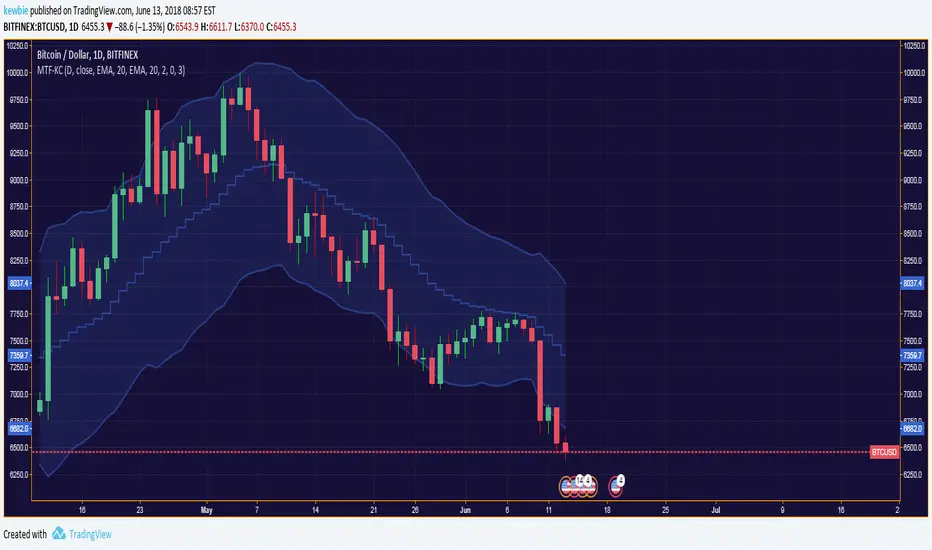
Multiple-Timeframe Keltner ChannelKeltner Channels are volatility-based envelopes set above and below a moving average first devised by Chester W. Keltner then later revised by Linda Bradford Raschke.
This script allows for the overlay of the Keltner Channel across multiple-timeframes.
Additionally allows for the selection of the true range average type with a user defined lookback period.
Default settings is the traditional type of KC seen on TV.
Note: When inputting the MA-Basis strings it is case sensitive; enter only lowercase or all uppercase. If a typo is made it will by default revert to an EMA base.
Average
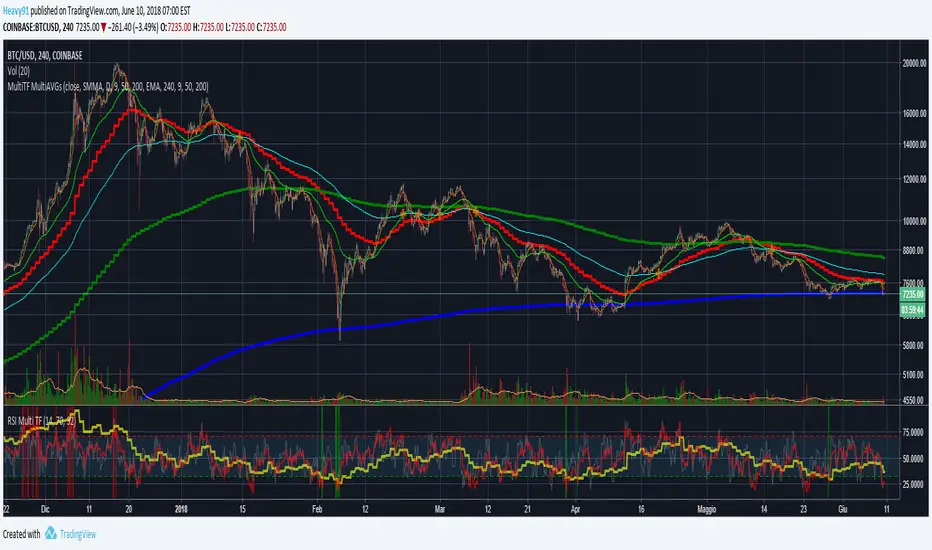
Ultimate 'Multi-Timeframe' Multi-AveragesPlots different kinds of averages (EMA, SMA, SMMA, WMA, VWMA) referred to a fixed timeframe/period indipendent from the one that you are watching (example: plot daily EMA on the 4h chart).
Highlights the crossing of averages.
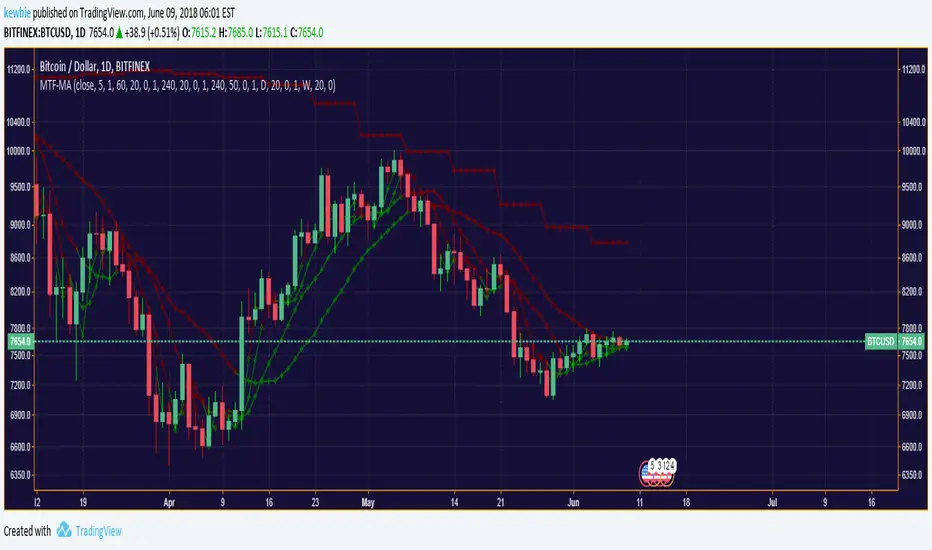
Multiple Timeframe Moving Average SystemModified code from ChrisMoody, RicardoSantos & Ricardo M Arjona.
Allows for multiple moving average types across custom time-frames.
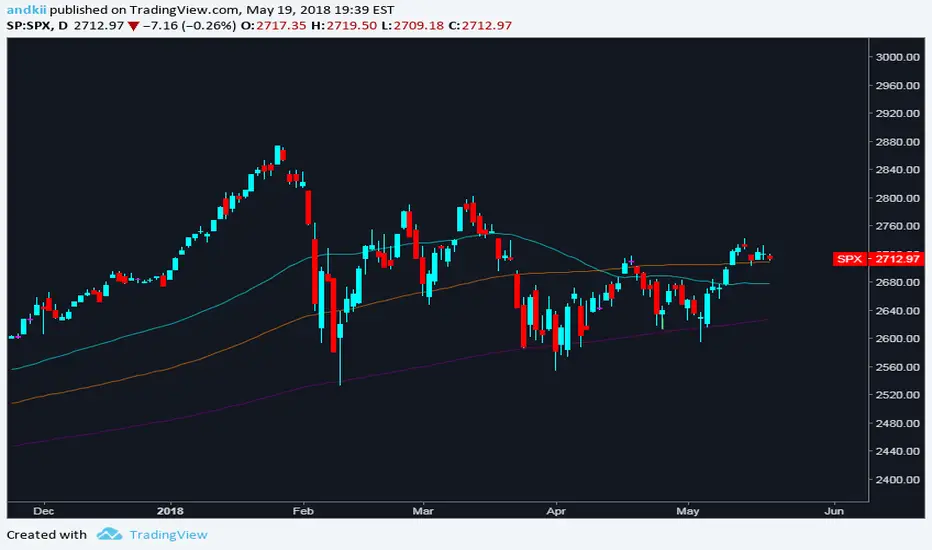
Simple Moving Averages (7, 30, 50, 100, 200)7, 30, 50, 100, 200 simple moving averages, bundled in one indicator (for users who are using the free TradingView service and can only load limited number of indicators at any given time).
You can turn each moving average on or off at will and change the colors.

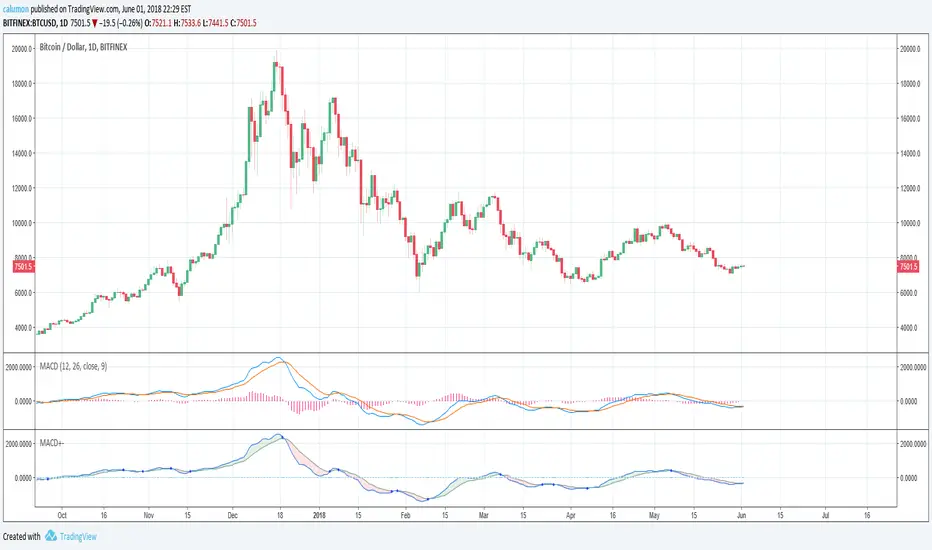
MACD with highlighted positive and negative trendThe values used by this indicator are equal to MACD 12 26 9 (and Signal). Only changes are made to looks:
If MACD closes higher than Signal, then we are seeing green. Else, we are seeing red.
Another point is that we get a blue circle when there is a trend change from bullish to bearish or vice versa. Please note that there needs to be an offset for this. We will only see the circle, when there already WAS (instead of is) a trend change.
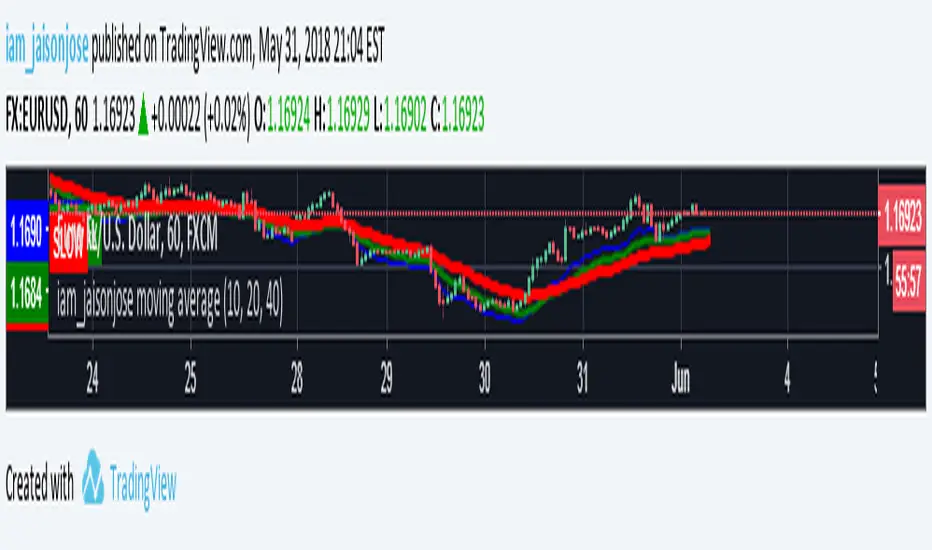
iam_jaisonjose 3 Moving Average (Exponential)This Indicator is a combination of 10, 20 & 40 EMA, which is very useful for determining the current trend.
3 Moving Average ExponentialSince I noticed there was no Script with actually 3 EMA together (all the ones I found said it was Exponential, but actually was Simple), i created this one.
The lengths, 17 72 305, are based on the phi cube theory, introduced by Bo Williams. The slow length (305) indicate a likely strong support/resistance and the region between the fast and medium lengths (17, 72) indicate where the price tends to return after a boost or little diversion from the price average.

SMA/EMA 12|26|50SMA/EMA 12|26|50
Exactly as title says
SMA is bold
EMA is light
Orange 12
Green 26
Blue 50


Volatility Direction DetectorThis script helps trader identify volatility direction in order to classify each market move. It also provides good entry points.
Single Timeframe 3EMA + Current Timeframe 3SMMA
Plots 3 exponential moving averages from a bigger timeframe (Day, Week) and 3 smoothed moving averages from the current timeframe.

Volume HighlighterHighlight Candles or Volume Bars when volume breaks through the Moving Average, without volume obscuring your chart or candles! Also set an alert when volume breaks through its moving average! 1) Create an alert, 2) Select "Volume Highlighter" from the Alert Condition dropdown box, 3) select "Volume Bars" from the second dropdown, and 4) select "Volume MA Breakthrough" from the third dropdown.
Normal:
Choice of Highlighting Volume Bars and/or Candles on the chart:
Enjoy.
~jdhadwin

Adaptive Laguerre FilterAdaptive Laguerre Filter indicator script.
The Adaptive Laguerre Filter was originally developed and described by John Ehlers in his paper `Time Warp – Without Space Travel`.
Thanks to @apozdnyakov for the sorting solution.

Moving Averags Bundle (EMA/SMA)//@v3 Moving Averages Bundle (EMA/SMA)
//By Tantamount
//Save your TV indicator use count. Toggle between Exponential or Simple moving averages.
//Customize your own MA's by changing the input options from default: SMA (20, 50, 100, 200) or EMA (8, 13, 21, 55)

Simple Moving Average's Bundle//@v2 Simple Moving Averages Bundle
//Choose from the Buffet (20, 50, 100, 200), save your TV indicator use count. Customize periods and or toggle On/Off which SMA's you require.

%ATR - TCTAThe enhanced version of %ATR of "codermua"
The %ATR calculated by EMA(red) , SMA(purple) and WMA(yellow) added to existing indicator which include only RMA(blue) calculation.

EMA Enhanced11 Exponential moving averages all in one script. Based on SMA 3-987 script from traderUS180

Adaptive Moving AverageAdaptive Moving Average indicator script. This indicator was originally developed by Vitali Apirine (Stocks & Commodities V.36:5: Adaptive Moving Averages).

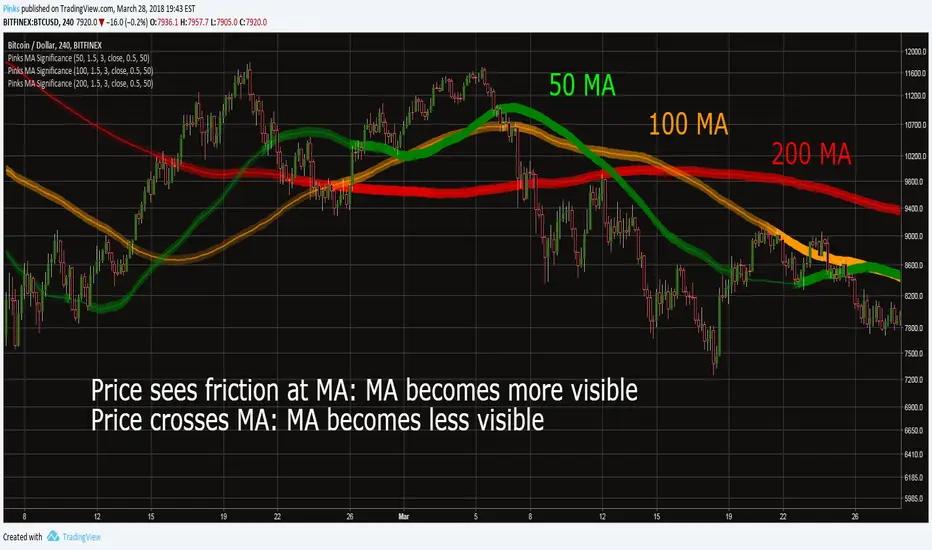
Pinks Moving Average SignificanceThis indicator is meant as a means to assess the significance ("strength") of a Moving Average , in other words how likely it is that price action is going to find support or resistance at the MA.
How it works
When the high or low of a candle is within the band around the MA defined by the "fuzziness" parameter, the significance of the MA increases proportional to how close the wick is to center of the band. When the price crosses fully through the band, its significance decreases. The strength will slowly decrease based on the "Lag Length" parameter.
The significance of the MA can be seen from the strength of its bands color.
How to use
MA Length: The length of the Moving Average.
Fuzziness : Width of the MA band, in percent.
Lag Length: How slowly the MA strength changes.
Source: Source data for Moving Average.
SMA Cross Penalty: How strongly the strength of the MA is reduced when price crosses it. Recommended to leave at default value.
Full color at : When the MA is at this percentage of its full strength, the color of the band will be completely opaque.
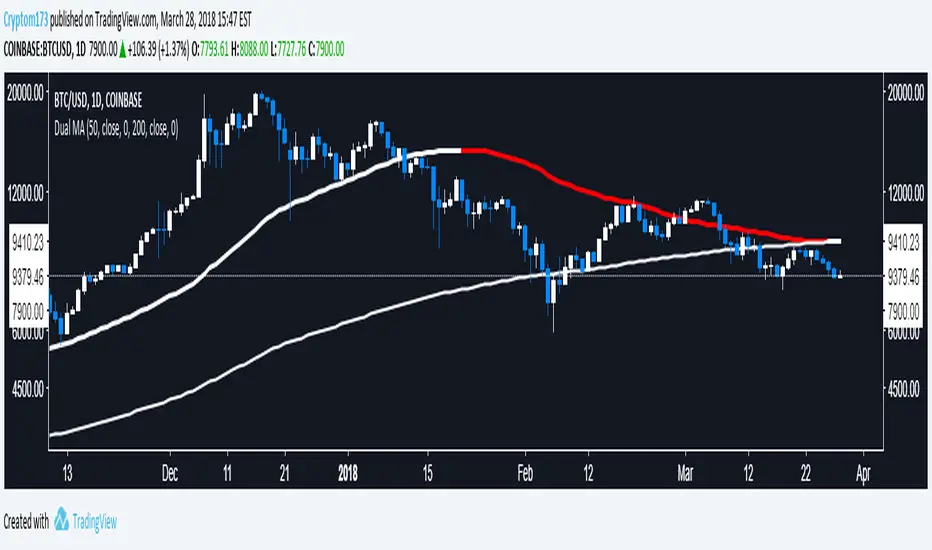
Dual Moving AverageGiven the limitation on indicators, I figured it would be nice to combine a couple into a single indicator. I'll likely make another one for EMA or make one that lets you use whichever type of moving averages you want.
Philakone 55/100 EMA incl. color & sizeInspired on Philakone's EMA settings in his colors and line width. Also added 100 EMA.