DTR & ATR with live zonesThis indicator is designed to help traders gauge the day's volatility in real-time. It compares the current Daily True Range (DTR)—the distance between the session's high and low—to the historical Average True Range (ATR).
The main purpose is to project potential price levels where the market might reach based on its average volatility. These levels (100% ATR, 150%, 200%, etc.) can be used as price targets. For instance, if you're in a long trade, you might consider taking partial or full profits as the price approaches these upper ATR extension levels. The indicator is highly customisable, allowing you to control the appearance of the ATR lines, zones, and labels to fit your charting preferences.
Core Concepts: ATR and DTR
To use this indicator effectively, it's important to understand its two main components:
Average True Range (ATR): This is a classic technical analysis indicator that measures market volatility. It calculates the average range of price movement over a specific period (e.g., 14 days). A higher ATR means the price is, on average, moving more, while a low ATR indicates less volatility. This script uses a higher timeframe ATR (e.g., Daily) to establish a stable volatility baseline for the current trading day.
Daily True Range (DTR): This is simply the difference between the current trading session's highest high and lowest low (session high - session low). It tells you how much the price has actually moved so far today.
The indicator's logic revolves around comparing the live, unfolding DTR to the historical, baseline ATR. An on-screen table conveniently shows this comparison as a percentage, to show how volatile the day has been.
How It Works: The Dynamic & Locked Mechanism
The most clever part of this indicator is how it draws the ATR levels. It operates in two distinct phases during the trading session:
Phase 1: Dynamic Expansion (Before DTR meets ATR)
At the start of the session, the DTR is small. The indicator calculates the remaining range needed to "complete" the 100% ATR level (difference = avg_atr - dtr). It then adds this remaining amount to the session high and subtracts it from the session low. This creates a "floating" 100% ATR range that expands dynamically as the session high or low is extended.
Phase 2: The Lock-in (After DTR meets or exceeds ATR)
Once the day's range (DTR) becomes equal to or greater than the avg_atr, the day has met its "expected" volatility. At this point, the levels lock in place. The indicator intelligently determines the anchor point for the locked range.
Once this primary 100% ATR range is established (either dynamically or locked), the script projects the other levels (150%, 200%, 250%, and 300%) by adding or subtracting multiples of the avg_atr from this base.
How to Use It for Trading
The primary use of this indicator is to set logical, volatility-based price targets.
Setting Profit Targets: If you enter a long position, the upper ATR levels (100%, 150%, 200%) serve as excellent areas to consider taking profits. A move to the 200% or 250% level often signifies an overextended or "exhaustion" move, making it a high-probability exit zone. For short positions, the lower ATR levels serve the same purpose.
Assessing Intraday Momentum: The on-screen table tells you how much of the expected daily range has been used. If it's early in the session and the DTR is only at 30% of the ATR, you can anticipate more significant price movement is likely to come. Conversely, if the DTR is already at 150% of ATR, the bulk of the day's move may already be complete.
Mean Reversion Signals: If the price pushes to an extreme level (e.g., 250% ATR) and shows signs of stalling (e.g., bearish divergence on an oscillator), it could signal a potential reversal or pullback, offering an opportunity for a counter-trend trade.
Key Settings
ATR Length & Smoothing Type: These settings control how the baseline ATR is calculated. The default 14 period and RMA smoothing are standard, but you can adjust them to your preference.
Session Settings: This is crucial. You must set the Market Session and Time Zone to match the primary trading hours of the asset you are analysing (e.g., "0930-1600" for the NYSE session).
Show Lines / Show Labels / Show Zones: The script gives you full control over the visual display. You can toggle each ATR level's lines, labels, and background zones individually to avoid a cluttered chart and focus only on the levels that matter to your strategy.
ATR

Renko BandsThis is renko without the candles, just the endpoint plotted as a line with bands around it that represent the brick size. The idea came from thinking about what renko actually gives you once you strip away the visual brick format. At its core, renko is a filtered price series that only updates when price moves a fixed amount, which means it's inherently a trend-following mechanism with built-in noise reduction. By plotting just the renko price level and surrounding it with bands at the brick threshold distances, you get something that works like regular volatility bands while still behaving as a trend indicator.
The center line is the current renko price, which trails actual price based on whichever brick sizing method you've selected. When price moves enough to complete a brick in the renko calculation, the center line jumps to the new brick level. The bands sit at plus and minus one brick size from that center line, showing you exactly how far price needs to move before the next brick would form. This makes the bands function as dynamic breakout levels. When price touches or crosses a band, you know a new renko brick is forming and the trend calculation is updating.
What makes this cool is the dual-purpose nature. You can use it like traditional volatility bands where the outer edges represent boundaries of normal price movement, and breaks beyond those boundaries signal potential trend continuation or exhaustion. But because the underlying calculation is renko rather than standard deviation or ATR around a moving average, the bands also give you direct insight into trend state. When the center line is rising consistently and price stays near the upper band, you're in a clean uptrend. When it's falling and price hugs the lower band, downtrend. When the center line is flat and price is bouncing between both bands, you're ranging.
The three brick sizing methods work the same way as standard renko implementations. Traditional sizing uses a fixed price range, so your bands are always the same absolute distance from the center line. ATR-based sizing calculates brick range from historical volatility, which makes the bands expand and contract based on the ATR measurement you chose at startup. Percentage-based sizing scales the brick size with price level, so the bands naturally widen as price increases and narrow as it decreases. This automatic scaling is particularly useful for instruments that move proportionally rather than in fixed increments.
The visual simplicity compared to full renko bricks makes this more practical for overlay use on your main chart. Instead of trying to read brick patterns in a separate pane or cluttering your price chart with boxes and lines, you get a single smoothed line with two bands that convey the same information about trend state and momentum. The center line shows you the filtered trend direction, the bands show you the threshold levels, and the relationship between price and the bands tells you whether the current move has legs or is stalling out.
From a trend-following perspective, the renko line naturally stays flat during consolidation and only moves when directional momentum is strong enough to complete bricks. This built-in filter removes a lot of the whipsaw that affects moving averages during choppy periods. Traditional moving averages continue updating with every bar regardless of whether meaningful directional movement is happening, which leads to false signals when price is just oscillating. The renko line only responds to sustained moves that meet the brick size threshold, so it tends to stay quiet when price is going nowhere and only signals when something is actually happening.
The bands also serve as natural stop-loss or profit-target references since they represent the distance price needs to move before the trend calculation changes. If you're long and the renko line is rising, you might place stops below the lower band on the theory that if price falls far enough to reverse the renko trend, your thesis is probably invalidated. Conversely, the upper band can mark levels where you'd expect the current brick to complete and potentially see some consolidation or pullback before the next brick forms.
What this really highlights is that renko's value isn't just in the brick visualization, it's in the underlying filtering mechanism. By extracting that mechanism and presenting it in a more traditional band format, you get access to renko's trend-following properties without needing to commit to the brick chart aesthetic or deal with the complications of overlaying brick drawings on a time-based chart. It's renko after all, so you get the trend filtering and directional clarity that makes renko useful, but packaged in a way that integrates more naturally with standard technical analysis workflows.

Average True Range Stop Loss Finder with KAMAATR SL finder with bands
Kaufmann adaptive moving average
ATR SL finder with bands
Kaufmann adaptive moving average

ATR %ATR % Oscillator
A simple and effective Average True Range (ATR) indicator displayed as a percentage of the current price in a separate panel.
FEATURES:
• ATR displayed as percentage of current price for easy cross-asset comparison
• EMA smoothing line using the same period as ATR
• Configurable ATR period (default: 20)
• Clean visualization with zero reference line
HOW IT WORKS:
The indicator calculates ATR and converts it to a percentage: (ATR / Close) × 100
This normalization allows you to:
- Compare volatility across different instruments regardless of price
- Identify high and low volatility periods
- Use the EMA line to spot volatility trends
PARAMETERS:
ATR Period - The lookback period for ATR calculation (default: 20)
Timeframe - Choose any timeframe for ATR calculation independently from the chart timeframe (default: chart timeframe)

VWAP Entry Assistant (v1.0)Description:
Anchored VWAP with a lightweight assistant for VWAP reversion trades.
It shows the distance to VWAP, an estimated hit probability for the current bar, the expected number of bars to reach VWAP, and a recommended entry price.
If the chance of touching VWAP is low, the script suggests an adjusted limit using a fraction of ATR.
The VWAP line is white by default, and a compact summary table appears at the bottom-left.
Educational tool. Not financial advice. Not affiliated with TradingView or any exchange. Always backtest before use.

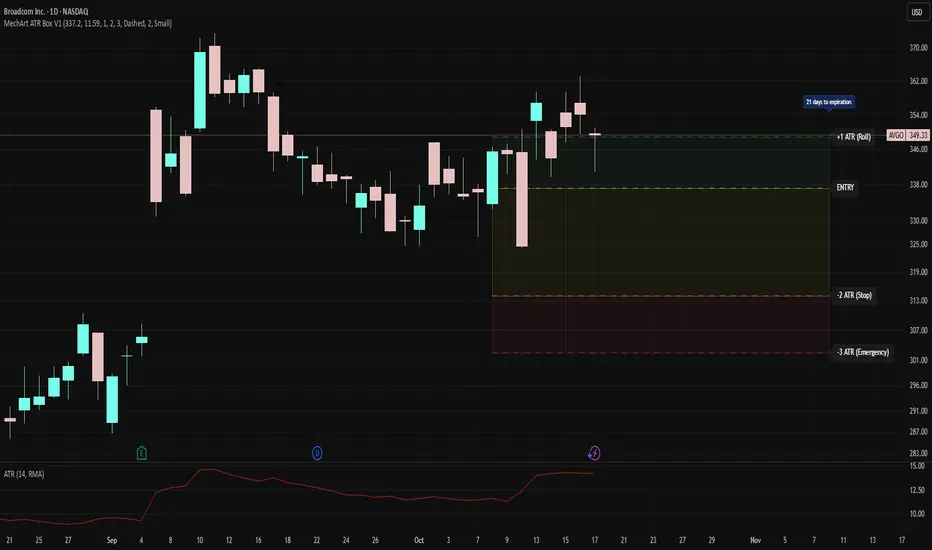
MechArt ATR Box V1MechArt ATR Box V1
Description:
The MechArt ATR Box V1 is a precision trade-planning and risk-management tool that visualizes your entire position framework using customizable ATR-based zones.
It automatically plots your key decision levels from a defined entry price and ATR value — helping you clearly see when to roll, hold, or exit a trade.
Features:
Configurable ATR multipliers for roll, stop, and emergency zones.
Automatically updates labels and price levels based on your custom ATR settings.
Distinct color-coded boxes for:
✅ +1 ATR (Roll Zone) – visualize profit or roll targets.
⚠️ –2 ATR (Stop Zone) – manage risk boundaries.
🚨 –3 ATR (Emergency Stop) – mark hard exit thresholds.
Adjustable ATRs, line style, width, color, and opacity for visual clarity.
Optional Days Until Expiration label for time-sensitive trades.
Ideal for:
Traders using mechanical, ATR driven systems (like OVTLYR Plan M), or anyone who wants a clear, rule-based visualization of risk vs. reward directly on the chart.
Dynamic ATR BandsDescription:
The Dynamic ATR Bands indicator visualizes ATR-based stop-loss, take-profit, and trailing levels. Bands can be drawn relative to a fixed entry price or dynamically relative to the current price. It is ideal for trend-following, swing trading, and hybrid strategies, especially on volatile or noisy instruments.
Key Features:
Base ATR Bands:
Plots ATR-based bands above and below a reference price.
Acts as initial stop-loss or target guidance.
Adjustable multiplier (default 1× ATR).
Extra ATR Band:
Add an additional ATR band at a custom multiplier.
Position it above or below the reference price.
Useful for trailing stops or extended profit targets.
Hybrid Entry Mode:
Use Fixed Entry Price: bands are drawn relative to your entry and remain fixed.
Dynamic Mode: bands behave like standard ATR bands, moving with the current price.
Allows visualization of hybrid ATR stop-loss and trailing strategies.
Clean Visuals:
Color-coded bands differentiate base (solid) from extra (semi-transparent).
How to Use:
Set ATR length and multipliers according to your strategy.
Toggle hybrid entry mode and input your entry price, or leave off for dynamic bands.
Set the extra band multiplier and choose its position (upper/lower).
Use the bands as visual guides for stop-loss, take-profit, and trailing levels.
Inputs:
ATR Length: number of periods for ATR calculation
Base ATR Multiplier: distance of base bands from reference price
Extra ATR Multiplier: distance for the additional band
Extra Band Position: choose Upper or Lower
Use Fixed Entry Price: toggle hybrid entry mode
Entry Price: specify entry price if hybrid mode is enabled
Note:
This script is visual only; it does not place trades. It is designed to help plan ATR-based stop-loss, take-profit, and hybrid trade management visually on the chart.

Bollinger Band ToolkitBollinger Band Toolkit
An advanced, adaptive Bollinger Band system for traders who want more context, precision, and edge.
This indicator expands on the classic Bollinger Bands by combining statistical and volatility-based methods with modern divergence and squeeze detection tools. It helps identify volatility regimes, potential breakouts, and early momentum shifts — all within one clean overlay.
🔹 Core Features
1. Adaptive Bollinger Bands (σ + ATR)
Classic 20-period bands enhanced with an ATR-based volatility adjustment, making them more responsive to true market movement rather than just price variance.
Reduces “overreacting” during chop and avoids bands collapsing too tightly during trends.
2. %B & RSI Divergence Detection
🟢 Green dots: Positive %B divergence — price makes a lower low, but %B doesn’t confirm (bullish).
🔴 Red dots: Negative %B divergence — price makes a higher high, but %B doesn’t confirm (bearish).
✚ Red/green crosses: RSI divergence confirmation — momentum fails to confirm the price’s new extreme.
These signals highlight potential reversal or slowdown zones that are often invisible to the naked eye.
3. Bollinger Band Squeeze (with Volume Filter)
Yellow squares (■) show periods when Bollinger Bands are at their narrowest relative to recent history.
Volume confirmation ensures the squeeze only triggers when both volatility and participation contract.
Often marks the “calm before the storm” — breakout potential zones.
4. Multi-Timeframe Breakout Markers
Optionally displays breakouts from higher or lower timeframes using different colors/symbols.
Lets you see when a higher timeframe band break aligns with your current chart — a strong trend continuation signal.
5. Dual- and Triple-Band Visualization (±1σ, ±2σ, ±3σ)
Optional inner (±1σ) and outer (±3σ) bands provide a layered volatility map:
Price holding between ±1σ → stable range / mean-reverting behavior
Price riding near ±2σ → trending phase, sustained momentum
Price touching or exceeding ±3σ → volatility expansion or exhaustion zone
This triple-band layout visually distinguishes normal movement from statistical extremes, helping you read when the market is balanced, expanding, or approaching its limits.
⚙️ Inputs & Customization
Choose band type (SMA/EMA/SMMA/WMA/VWMA)
Adjust deviation multiplier (σ) and ATR multiplier
Toggle individual features (divergence dots, squeeze markers, inner bands, etc.)
Multi-timeframe and colour controls for advanced users
🧠 How to Use
Watch for squeeze markers followed by a breakout bar beyond ±2σ → volatility expansion signal.
Combine divergence dots with RSI or price structure to anticipate slowdowns or reversals.
Confirm direction using multi-timeframe breakouts and volume expansion.
💬 Why It Works
This toolkit transforms qualitative chart reading (tight bands, hidden divergence) into quantitative, testable conditions — giving you objective insights that can be backtested, coded, or simply trusted in live setups.

Yesterday's ATR DrawerWith this ATR Drawer, you can easily see what yesterday's ATR was compared to today's High/Low , you don't have to draw it yourself, and if you want, it will also show you yesterday's ATR number in the corner.
When a new High/Low is created during the day, the lines automatically adapt . So if a new high is created, the lower ATR line will move up, and vice versa. Every day, it recalculates and redraws the lines to yesterday's ATR level.
You can add 1 line above and 1 line below yesterday's ATR, which will be at the percentage distance from yesterday's original ATR line. So basically this allows you to set the average range that is usually reached after the ATR is broken .
You can set:
- ATR length
- ATR line width
- Line color
- Show/hide yesterday's ATR
- Upper Avr. Range After ATR Exceeded (%)
- Lower Avr. Range After ATR Exceeded (%)

Luxy Momentum, Trend, Bias and Breakout Indicators V7
TABLE OF CONTENTS
This is Version 7 (V7) - the latest and most optimized release. If you are using any older versions (V6, V5, V4, V3, etc.), it is highly recommended to replace them with V7.
Why This Indicator is Different
Who Should Use This
Core Components Overview
The UT Bot Trading System
Understanding the Market Bias Table
Candlestick Pattern Recognition
Visual Tools and Features
How to Use the Indicator
Performance and Optimization
FAQ
---
### CREDITS & ATTRIBUTION
This indicator implements proven trading concepts using entirely original code developed specifically for this project.
### CONCEPTUAL FOUNDATIONS
• UT Bot ATR Trailing System
- Original concept by @QuantNomad: (search "UT-Bot-Strategy"
- Our version is a complete reimplementation with significant enhancements:
- Volume-weighted momentum adjustment
- Composite stop loss from multiple S/R layers
- Multi-filter confirmation system (swing, %, 2-bar, ZLSMA)
- Full integration with multi-timeframe bias table
- Visual audit trail with freeze-on-touch
- NOTE: No code was copied - this is a complete reimplementation with enhancements.
• Standard Technical Indicators (Public Domain Formulas):
- Supertrend: ATR-based trend calculation with custom gradient fills
- MACD: Gerald Appel's formula with separation filters
- RSI: J. Welles Wilder's formula with pullback zone logic
- ADX/DMI: Custom trend strength formula inspired by Wilder's directional movement concept, reimplemented with volume weighting and efficiency metrics
- ZLSMA: Zero-lag formula enhanced with Hull MA and momentum prediction
### Custom Implementations
- Trend Strength: Inspired by Wilder's ADX concept but using volume-weighted pressure calculation and efficiency metrics (not traditional +DI/-DI smoothing)
- All code implementations are original
### ORIGINAL FEATURES (70%+ of codebase)
- Multi-Timeframe Bias Table with live updates
- Risk Management System (R-multiple TPs, freeze-on-touch)
- Opening Range Breakout tracker with session management
- Composite Stop Loss calculator using 6+ S/R layers
- Performance optimization system (caching, conditional calcs)
- VIX Fear Index integration
- Previous Day High/Low auto-detection
- Candlestick pattern recognition with interactive tooltips
- Smart label and visual management
- All UI/UX design and table architecture
### DEVELOPMENT PROCESS
**AI Assistance:** This indicator was developed over 2+ months with AI assistance (ChatGPT/Claude) used for:
- Writing Pine Script code based on design specifications
- Optimizing performance and fixing bugs
- Ensuring Pine Script v6 compliance
- Generating documentation
**Author's Role:** All trading concepts, system design, feature selection, integration logic, and strategic decisions are original work by the author. The AI was a coding tool, not the system designer.
**Transparency:** We believe in full disclosure - this project demonstrates how AI can be used as a powerful development tool while maintaining creative and strategic ownership.
---
1. WHY THIS INDICATOR IS DIFFERENT
Most traders use multiple separate indicators on their charts, leading to cluttered screens, conflicting signals, and analysis paralysis. The Suite solves this by integrating proven technical tools into a single, cohesive system.
Key Advantages:
All-in-One Design: Instead of loading 5-10 separate indicators, you get everything in one optimized script. This reduces chart clutter and improves TradingView performance.
Multi-Timeframe Bias Table: Unlike standard indicators that only show the current timeframe, the Bias Table aggregates trend signals across multiple timeframes simultaneously. See at a glance whether 1m, 5m, 15m, 1h are aligned bullish or bearish - no more switching between charts.
Smart Confirmations: The indicator doesn't just give signals - it shows you WHY. Every entry has multiple layers of confirmation (MA cross, MACD momentum, ADX strength, RSI pullback, volume, etc.) that you can toggle on/off.
Dynamic Stop Loss System: Instead of static ATR stops, the SL is calculated from multiple support/resistance layers: UT trailing line, Supertrend, VWAP, swing structure, and MA levels. This creates more intelligent, price-action-aware stops.
R-Multiple Take Profits: Built-in TP system calculates targets based on your initial risk (1R, 1.5R, 2R, 3R). Lines freeze when touched with visual checkmarks, giving you a clean audit trail of partial exits.
Educational Tooltips Everywhere: Every single input has detailed tooltips explaining what it does, typical values, and how it impacts trading. You're not guessing - you're learning as you configure.
Performance Optimized: Smart caching, conditional calculations, and modular design mean the indicator runs fast despite having 15+ features. Turn off what you don't use for even better performance.
No Repainting: All signals respect bar close. Alerts fire correctly. What you see in history is what you would have gotten in real-time.
What Makes It Unique:
Integrated UT Bot + Bias Table: No other indicator combines UT Bot's ATR trailing system with a live multi-timeframe dashboard. You get precision entries with macro trend context.
Candlestick Pattern Recognition with Interactive Tooltips: Patterns aren't just marked - hover over any emoji for a full explanation of what the pattern means and how to trade it.
Opening Range Breakout Tracker: Built-in ORB system for intraday traders with customizable session times and real-time status updates in the Bias Table.
Previous Day High/Low Auto-Detection: Automatically plots PDH/PDL on intraday charts with theme-aware colors. Updates daily without manual input.
Dynamic Row Labels in Bias Table: The table shows your actual settings (e.g., "EMA 10 > SMA 20") not generic labels. You know exactly what's being evaluated.
Modular Filter System: Instead of forcing a fixed methodology, the indicator lets you build your own strategy. Start with just UT Bot, add filters one at a time, test what works for your style.
---
2. WHO WHOULD USE THIS
Designed For:
Intermediate to Advanced Traders: You understand basic technical analysis (MAs, RSI, MACD) and want to combine multiple confirmations efficiently. This isn't a "one-click profit" system - it's a professional toolkit.
Multi-Timeframe Traders: If you trade one asset but check multiple timeframes for confirmation (e.g., enter on 5m after checking 15m and 1h alignment), the Bias Table will save you hours every week.
Trend Followers: The indicator excels at identifying and following trends using UT Bot, Supertrend, and MA systems. If you trade breakouts and pullbacks in trending markets, this is built for you.
Intraday and Swing Traders: Works equally well on 5m-1h charts (day trading) and 4h-D charts (swing trading). Scalpers can use it too with appropriate settings adjustments.
Discretionary Traders: This isn't a black-box system. You see all the components, understand the logic, and make final decisions. Perfect for traders who want tools, not automation.
Works Across All Markets:
Stocks (US, international)
Cryptocurrency (24/7 markets supported)
Forex pairs
Indices (SPY, QQQ, etc.)
Commodities
NOT Ideal For :
Complete Beginners: If you don't know what a moving average or RSI is, start with basics first. This indicator assumes foundational knowledge.
Algo Traders Seeking Black Box: This is discretionary. Signals require context and confirmation. Not suitable for blind automated execution.
Mean-Reversion Only Traders: The indicator is trend-following at its core. While VWAP bands support mean-reversion, the primary methodology is trend continuation.
---
3. CORE COMPONENTS OVERVIEW
The indicator combines these proven systems:
Trend Analysis:
Moving Averages: Four customizable MAs (Fast, Medium, Medium-Long, Long) with six types to choose from (EMA, SMA, WMA, VWMA, RMA, HMA). Mix and match for your style.
Supertrend: ATR-based trend indicator with unique gradient fill showing trend strength. One-sided ribbon visualization makes it easier to see momentum building or fading.
ZLSMA : Zero-lag linear-regression smoothed moving average. Reduces lag compared to traditional MAs while maintaining smooth curves.
Momentum & Filters:
MACD: Standard MACD with separation filter to avoid weak crossovers.
RSI: Pullback zone detection - only enter longs when RSI is in your defined "buy zone" and shorts in "sell zone".
ADX/DMI: Trend strength measurement with directional filter. Ensures you only trade when there's actual momentum.
Volume Filter: Relative volume confirmation - require above-average volume for entries.
Donchian Breakout: Optional channel breakout requirement.
Signal Systems:
UT Bot: The primary signal generator. ATR trailing stop that adapts to volatility and gives clear entry/exit points.
Base Signals: MA cross system with all the above filters applied. More conservative than UT Bot alone.
Market Bias Table: Multi-timeframe dashboard showing trend alignment across 7 timeframes plus macro bias (3-day, weekly, monthly, quarterly, VIX).
Candlestick Patterns: Six major reversal patterns auto-detected with interactive tooltips.
ORB Tracker: Opening range high/low with breakout status (intraday only).
PDH/PDL: Previous day levels plotted automatically on intraday charts.
VWAP + Bands : Session-anchored VWAP with up to three standard deviation band pairs.
---
4. THE UT BOT TRADING SYSTEM
The UT Bot is the heart of the indicator's signal generation. It's an advanced ATR trailing stop that adapts to market volatility.
Why UT Bot is Superior to Fixed Stops:
Traditional ATR stops use a fixed multiplier (e.g., "stop = entry - 2×ATR"). UT Bot is smarter:
It TRAILS the stop as price moves in your favor
It WIDENS during high volatility to avoid premature stops
It TIGHTENS during consolidation to lock in profits
It FLIPS when price breaks the trailing line, signaling reversals
Visual Elements You'll See:
Orange Trailing Line: The actual UT stop level that adapts bar-by-bar
Buy/Sell Labels: Aqua triangle (long) or orange triangle (short) when the line flips
ENTRY Line: Horizontal line at your entry price (optional, can be turned off)
Suggested Stop Loss: A composite SL calculated from multiple support/resistance layers:
- UT trailing line
- Supertrend level
- VWAP
- Swing structure (recent lows/highs)
- Long-term MA (200)
- ATR-based floor
Take Profit Lines: TP1, TP1.5, TP2, TP3 based on R-multiples. When price touches a TP, it's marked with a checkmark and the line freezes for audit trail purposes.
Status Messages: "SL Touched ❌" or "SL Frozen" when the trade leg completes.
How UT Bot Differs from Other ATR Systems:
Multiple Filters Available: You can require 2-bar confirmation, minimum % price change, swing structure alignment, or ZLSMA directional filter. Most UT implementations have none of these.
Smart SL Calculation: Instead of just using the UT line as your stop, the indicator suggests a better SL based on actual support/resistance. This prevents getting stopped out by wicks while keeping risk controlled.
Visual Audit Trail: All SL/TP lines freeze when touched with clear markers. You can review your trades weeks later and see exactly where entries, stops, and targets were.
Performance Options: "Draw UT visuals only on bar close" lets you reduce rendering load without affecting logic or alerts - critical for slower machines or 1m charts.
Trading Logic:
UT Bot flips direction (Buy or Sell signal appears)
Check Bias Table for multi-timeframe confirmation
Optional: Wait for Base signal or candlestick pattern
Enter at signal bar close or next bar open
Place stop at "Suggested Stop Loss" line
Scale out at TP levels (TP1, TP2, TP3)
Exit remaining position on opposite UT signal or stop hit
---
5. UNDERSTANDING THE MARKET BIAS TABLE
This is the indicator's unique multi-timeframe intelligence layer. Instead of looking at one chart at a time, the table aggregates signals across seven timeframes plus macro trend bias.
Why Multi-Timeframe Analysis Matters:
Professional traders check higher and lower timeframes for context:
Is the 1h uptrend aligning with my 5m entry?
Are all short-term timeframes bullish or just one?
Is the daily trend supportive or fighting me?
Doing this manually means opening multiple charts, checking each indicator, and making mental notes. The Bias Table does it automatically in one glance.
Table Structure:
Header Row:
On intraday charts: 1m, 5m, 15m, 30m, 1h, 2h, 4h (toggle which ones you want)
On daily+ charts: D, W, M (automatic)
Green dot next to title = live updating
Headline Rows - Macro Bias:
These show broad market direction over longer periods:
3 Day Bias: Trend over last 3 trading sessions (uses 1h data)
Weekly Bias: Trend over last 5 trading sessions (uses 4h data)
Monthly Bias: Trend over last 30 daily bars
Quarterly Bias: Trend over last 13 weekly bars
VIX Fear Index: Market regime based on VIX level - bullish when low, bearish when high
Opening Range Breakout: Status of price vs. session open range (intraday only)
These rows show text: "BULLISH", "BEARISH", or "NEUTRAL"
Indicator Rows - Technical Signals:
These evaluate your configured indicators across all active timeframes:
Fast MA > Medium MA (shows your actual MA settings, e.g., "EMA 10 > SMA 20")
Price > Long MA (e.g., "Price > SMA 200")
Price > VWAP
MACD > Signal
Supertrend (up/down/neutral)
ZLSMA Rising
RSI In Zone
ADX ≥ Minimum
These rows show emojis: GREEB (bullish), RED (bearish), GRAY/YELLOW (neutral/NA)
AVG Column:
Shows percentage of active timeframes that are bullish for that row. This is the KEY metric:
AVG > 70% = strong multi-timeframe bullish alignment
AVG 40-60% = mixed/choppy, no clear trend
AVG < 30% = strong multi-timeframe bearish alignment
How to Use the Table:
For a long trade:
Check AVG column - want to see > 60% ideally
Check headline bias rows - want to see BULLISH, not BEARISH
Check VIX row - bullish market regime preferred
Check ORB row (intraday) - want ABOVE for longs
Scan indicator rows - more green = better confirmation
For a short trade:
Check AVG column - want to see < 40% ideally
Check headline bias rows - want to see BEARISH, not BULLISH
Check VIX row - bearish market regime preferred
Check ORB row (intraday) - want BELOW for shorts
Scan indicator rows - more red = better confirmation
When AVG is 40-60%:
Market is choppy, mixed signals. Either stay out or reduce position size significantly. These are low-probability environments.
Unique Features:
Dynamic Labels: Row names show your actual settings (e.g., "EMA 10 > SMA 20" not generic "Fast > Slow"). You know exactly what's being evaluated.
Customizable Rows: Turn off rows you don't care about. Only show what matters to your strategy.
Customizable Timeframes: On intraday charts, disable 1m or 4h if you don't trade them. Reduces calculation load by 20-40%.
Automatic HTF Handling: On Daily/Weekly/Monthly charts, the table automatically switches to D/W/M columns. No configuration needed.
Performance Smart: "Hide BIAS table on 1D or above" option completely skips all table calculations on higher timeframes if you only trade intraday.
---
6. CANDLESTICK PATTERN RECOGNITION
The indicator automatically detects six major reversal patterns and marks them with emojis at the relevant bars.
Why These Six Patterns:
These are the most statistically significant reversal patterns according to trading literature:
High win rate when appearing at support/resistance
Clear visual structure (not subjective)
Work across all timeframes and assets
Studied extensively by institutions
The Patterns:
Bullish Patterns (appear at bottoms):
Bullish Engulfing: Green candle completely engulfs prior red candle's body. Strong reversal signal.
Hammer: Small body with long lower wick (at least 2× body size). Shows rejection of lower prices by buyers.
Morning Star: Three-candle pattern (large red → small indecision → large green). Very strong bottom reversal.
Bearish Patterns (appear at tops):
Bearish Engulfing: Red candle completely engulfs prior green candle's body. Strong reversal signal.
Shooting Star: Small body with long upper wick (at least 2× body size). Shows rejection of higher prices by sellers.
Evening Star: Three-candle pattern (large green → small indecision → large red). Very strong top reversal.
Interactive Tooltips:
Unlike most pattern indicators that just draw shapes, this one is educational:
Hover your mouse over any pattern emoji
A tooltip appears explaining: what the pattern is, what it means, when it's most reliable, and how to trade it
No need to memorize - learn as you trade
Noise Filter:
"Min candle body % to filter noise" setting prevents false signals:
Patterns require minimum body size relative to price
Filters out tiny candles that don't represent real buying/selling pressure
Adjust based on asset volatility (higher % for crypto, lower for low-volatility stocks)
How to Trade Patterns:
Patterns are NOT standalone entry signals. Use them as:
Confirmation: UT Bot gives signal + pattern appears = stronger entry
Reversal Warning: In a trade, opposite pattern appears = consider tightening stop or taking profit
Support/Resistance Validation: Pattern at key level (PDH, VWAP, MA 200) = level is being respected
Best combined with:
UT Bot or Base signal in same direction
Bias Table alignment (AVG > 60% or < 40%)
Appearance at obvious support/resistance
---
7. VISUAL TOOLS AND FEATURES
VWAP (Volume Weighted Average Price):
Session-anchored VWAP with standard deviation bands. Shows institutional "fair value" for the trading session.
Anchor Options: Session, Day, Week, Month, Quarter, Year. Choose based on your trading timeframe.
Bands: Up to three pairs (X1, X2, X3) showing statistical deviation. Price at outer bands often reverses.
Auto-Hide on HTF: VWAP hides on Daily/Weekly/Monthly charts automatically unless you enable anchored mode.
Use VWAP as:
Directional bias (above = bullish, below = bearish)
Mean reversion levels (outer bands)
Support/resistance (the VWAP line itself)
Previous Day High/Low:
Automatically plots yesterday's high and low on intraday charts:
Updates at start of each new trading day
Theme-aware colors (dark text for light charts, light text for dark charts)
Hidden automatically on Daily/Weekly/Monthly charts
These levels are critical for intraday traders - institutions watch them closely as support/resistance.
Opening Range Breakout (ORB):
Tracks the high/low of the first 5, 15, 30, or 60 minutes of the trading session:
Customizable session times (preset for NYSE, LSE, TSE, or custom)
Shows current breakout status in Bias Table row (ABOVE, BELOW, INSIDE, BUILDING)
Intraday only - auto-disabled on Daily+ charts
ORB is a classic day trading strategy - breakout above opening range often leads to continuation.
Extra Labels:
Change from Open %: Shows how far price has moved from session open (intraday) or daily open (HTF). Green if positive, red if negative.
ADX Badge: Small label at bottom of last bar showing current ADX value. Green when above your minimum threshold, red when below.
RSI Badge: Small label at top of last bar showing current RSI value with zone status (buy zone, sell zone, or neutral).
These labels provide quick at-a-glance confirmation without needing separate indicator windows.
---
8. HOW TO USE THE INDICATOR
Step 1: Add to Chart
Load the indicator on your chosen asset and timeframe
First time: Everything is enabled by default - the chart will look busy
Don't panic - you'll turn off what you don't need
Step 2: Start Simple
Turn OFF everything except:
UT Bot labels (keep these ON)
Bias Table (keep this ON)
Moving Averages (Fast and Medium only)
Suggested Stop Loss and Take Profits
Hide everything else initially. Get comfortable with the basic UT Bot + Bias Table workflow first.
Step 3: Learn the Core Workflow
UT Bot gives a Buy or Sell signal
Check Bias Table AVG column - do you have multi-timeframe alignment?
If yes, enter the trade
Place stop at Suggested Stop Loss line
Scale out at TP levels
Exit on opposite UT signal
Trade this simple system for a week. Get a feel for signal frequency and win rate with your settings.
Step 4: Add Filters Gradually
If you're getting too many losing signals (whipsaws in choppy markets), add filters one at a time:
Try: "Require 2-Bar Trend Confirmation" - wait for 2 bars to confirm direction
Try: ADX filter with minimum threshold - only trade when trend strength is sufficient
Try: RSI pullback filter - only enter on pullbacks, not chasing
Try: Volume filter - require above-average volume
Add one filter, test for a week, evaluate. Repeat.
Step 5: Enable Advanced Features (Optional)
Once you're profitable with the core system, add:
Supertrend for additional trend confirmation
Candlestick patterns for reversal warnings
VWAP for institutional anchor reference
ORB for intraday breakout context
ZLSMA for low-lag trend following
Step 6: Optimize Settings
Every setting has a detailed tooltip explaining what it does and typical values. Hover over any input to read:
What the parameter controls
How it impacts trading
Suggested ranges for scalping, day trading, and swing trading
Start with defaults, then adjust based on your results and style.
Step 7: Set Up Alerts
Right-click chart → Add Alert → Condition: "Luxy Momentum v6" → Choose:
"UT Bot — Buy" for long entries
"UT Bot — Sell" for short entries
"Base Long/Short" for filtered MA cross signals
Optionally enable "Send real-time alert() on UT flip" in settings for immediate notifications.
Common Workflow Variations:
Conservative Trader:
UT signal + Base signal + Candlestick pattern + Bias AVG > 70%
Enter only at major support/resistance
Wider UT sensitivity, multiple filters
Aggressive Trader:
UT signal + Bias AVG > 60%
Enter immediately, no waiting
Tighter UT sensitivity, minimal filters
Swing Trader:
Focus on Daily/Weekly Bias alignment
Ignore intraday noise
Use ORB and PDH/PDL less (or not at all)
Wider stops, patient approach
---
9. PERFORMANCE AND OPTIMIZATION
The indicator is optimized for speed, but with 15+ features running simultaneously, chart load time can add up. Here's how to keep it fast:
Biggest Performance Gains:
Disable Unused Timeframes: In "Time Frames" settings, turn OFF any timeframe you don't actively trade. Each disabled TF saves 10-15% calculation time. If you only day trade 5m, 15m, 1h, disable 1m, 2h, 4h.
Hide Bias Table on Daily+: If you only trade intraday, enable "Hide BIAS table on 1D or above". This skips ALL table calculations on higher timeframes.
Draw UT Visuals Only on Bar Close: Reduces intrabar rendering of SL/TP/Entry lines. Has ZERO impact on logic or alerts - purely visual optimization.
Additional Optimizations:
Turn off VWAP bands if you don't use them
Disable candlestick patterns if you don't trade them
Turn off Supertrend fill if you find it distracting (keep the line)
Reduce "Limit to 10 bars" for SL/TP lines to minimize line objects
Performance Features Built-In:
Smart Caching: Higher timeframe data (3-day bias, weekly bias, etc.) updates once per day, not every bar
Conditional Calculations: Volume filter only calculates when enabled. Swing filter only runs when enabled. Nothing computes if turned off.
Modular Design: Every component is independent. Turn off what you don't need without breaking other features.
Typical Load Times:
5m chart, all features ON, 7 timeframes: ~2-3 seconds
5m chart, core features only, 3 timeframes: ~1 second
1m chart, all features: ~4-5 seconds (many bars to calculate)
If loading takes longer, you likely have too many indicators on the chart total (not just this one).
---
10. FAQ
Q: How is this different from standard UT Bot indicators?
A: Standard UT Bot (originally by @QuantNomad) is just the ATR trailing line and flip signals. This implementation adds:
- Volume weighting and momentum adjustment to the trailing calculation
- Multiple confirmation filters (swing, %, 2-bar, ZLSMA)
- Smart composite stop loss system from multiple S/R layers
- R-multiple take profit system with freeze-on-touch
- Integration with multi-timeframe Bias Table
- Visual audit trail with checkmarks
Q: Can I use this for automated trading?
A: The indicator is designed for discretionary trading. While it has clear signals and alerts, it's not a mechanical system. Context and judgment are required.
Q: Does it repaint?
A: No. All signals respect bar close. UT Bot logic runs intrabar but signals only trigger on confirmed bars. Alerts fire correctly with no lookahead.
Q: Do I need to use all the features?
A: Absolutely not. The indicator is modular. Many profitable traders use just UT Bot + Bias Table + Moving Averages. Start simple, add complexity only if needed.
Q: How do I know which settings to use?
A: Every single input has a detailed tooltip. Hover over any setting to see:
What it does
How it affects trading
Typical values for scalping, day trading, swing trading
Start with defaults, adjust gradually based on results.
Q: Can I use this on crypto 24/7 markets?
A: Yes. ORB will not work (no defined session), but everything else functions normally. Use "Day" anchor for VWAP instead of "Session".
Q: The Bias Table is blank or not showing.
A: Check:
"Show Table" is ON
Table position isn't overlapping another indicator's table (change position)
At least one row is enabled
"Hide BIAS table on 1D or above" is OFF (if on Daily+ chart)
Q: Why are candlestick patterns not appearing?
A: Patterns are relatively rare by design - they only appear at genuine reversal points. Check:
Pattern toggles are ON
"Min candle body %" isn't too high (try 0.05-0.10)
You're looking at a chart with actual reversals (not strong trending market)
Q: UT Bot is too sensitive/not sensitive enough.
A: Adjust "Sensitivity (Key×ATR)". Lower number = tighter stop, more signals. Higher number = wider stop, fewer signals. Read the tooltip for guidance.
Q: Can I get alerts for the Bias Table?
A: The Bias Table is a dashboard for visual analysis, not a signal generator. Set alerts on UT Bot or Base signals, then manually check Bias Table for confirmation.
Q: Does this work on stocks with low volume?
A: Yes, but turn OFF the volume filter. Low volume stocks will never meet relative volume requirements.
Q: How often should I check the Bias Table?
A: Before every entry. It takes 2 seconds to glance at the AVG column and headline rows. This one check can save you from fighting the trend.
Q: What if UT signal and Base signal disagree?
A: UT Bot is more aggressive (ATR trailing). Base signals are more conservative (MA cross + filters). If they disagree, either:
Wait for both to align (safest)
Take the UT signal but with smaller size (aggressive)
Skip the trade (conservative)
There's no "right" answer - depends on your risk tolerance.
---
FINAL NOTES
The indicator gives you an edge. How you use that edge determines results.
For questions, feedback, or support, comment on the indicator page or message the author.
Happy Trading!

T3 ATR [DCAUT]█ T3 ATR
📊 ORIGINALITY & INNOVATION
The T3 ATR indicator represents an important enhancement to the traditional Average True Range (ATR) indicator by incorporating the T3 (Tilson Triple Exponential Moving Average) smoothing algorithm. While standard ATR uses fixed RMA (Running Moving Average) smoothing, T3 ATR introduces a configurable volume factor parameter that allows traders to adjust the smoothing characteristics from highly responsive to heavily smoothed output.
This innovation addresses a fundamental limitation of traditional ATR: the inability to adapt smoothing behavior without changing the calculation period. With T3 ATR, traders can maintain a consistent ATR period while adjusting the responsiveness through the volume factor, making the indicator adaptable to different trading styles, market conditions, and timeframes through a single unified implementation.
The T3 algorithm's triple exponential smoothing with volume factor control provides improved signal quality by reducing noise while maintaining better responsiveness compared to traditional smoothing methods. This makes T3 ATR particularly valuable for traders who need to adapt their volatility measurement approach to varying market conditions without switching between multiple indicator configurations.
📐 MATHEMATICAL FOUNDATION
The T3 ATR calculation process involves two distinct stages:
Stage 1: True Range Calculation
The True Range (TR) is calculated using the standard formula:
TR = max(high - low, |high - close |, |low - close |)
This captures the greatest of the current bar's range, the gap from the previous close to the current high, or the gap from the previous close to the current low, providing a comprehensive measure of price movement that accounts for gaps and limit moves.
Stage 2: T3 Smoothing Application
The True Range values are then smoothed using the T3 algorithm, which applies six exponential moving averages in succession:
First Layer: e1 = EMA(TR, period), e2 = EMA(e1, period)
Second Layer: e3 = EMA(e2, period), e4 = EMA(e3, period)
Third Layer: e5 = EMA(e4, period), e6 = EMA(e5, period)
Final Calculation: T3 = c1×e6 + c2×e5 + c3×e4 + c4×e3
The coefficients (c1, c2, c3, c4) are derived from the volume factor (VF) parameter:
a = VF / 2
c1 = -a³
c2 = 3a² + 3a³
c3 = -6a² - 3a - 3a³
c4 = 1 + 3a + a³ + 3a²
The volume factor parameter (0.0 to 1.0) controls the weighting of these coefficients, directly affecting the balance between responsiveness and smoothness:
Lower VF values (approaching 0.0): Coefficients favor recent data, resulting in faster response to volatility changes with minimal lag but potentially more noise
Higher VF values (approaching 1.0): Coefficients distribute weight more evenly across the smoothing layers, producing smoother output with reduced noise but slightly increased lag
📊 COMPREHENSIVE SIGNAL ANALYSIS
Volatility Level Interpretation:
High Absolute Values: Indicate strong price movements and elevated market activity, suggesting larger position risks and wider stop-loss requirements, often associated with trending markets or significant news events
Low Absolute Values: Indicate subdued price movements and quiet market conditions, suggesting smaller position risks and tighter stop-loss opportunities, often associated with consolidation phases or low-volume periods
Rapid Increases: Sharp spikes in T3 ATR often signal the beginning of significant price moves or market regime changes, providing early warning of increased trading risk
Sustained High Levels: Extended periods of elevated T3 ATR indicate sustained trending conditions with persistent volatility, suitable for trend-following strategies
Sustained Low Levels: Extended periods of low T3 ATR indicate range-bound conditions with suppressed volatility, suitable for mean-reversion strategies
Volume Factor Impact on Signals:
Low VF Settings (0.0-0.3): Produce responsive signals that quickly capture volatility changes, suitable for short-term trading but may generate more frequent color changes during minor fluctuations
Medium VF Settings (0.4-0.7): Provide balanced signal quality with moderate responsiveness, filtering out minor noise while capturing significant volatility changes, suitable for swing trading
High VF Settings (0.8-1.0): Generate smooth, stable signals that filter out most noise and focus on major volatility trends, suitable for position trading and long-term analysis
🎯 STRATEGIC APPLICATIONS
Position Sizing Strategy:
Determine your risk per trade (e.g., 1% of account capital - adjust based on your risk tolerance and experience)
Decide your stop-loss distance multiplier (e.g., 2.0x T3 ATR - this varies by market and strategy, test different values)
Calculate stop-loss distance: Stop Distance = Multiplier × Current T3 ATR
Calculate position size: Position Size = (Account × Risk %) / Stop Distance
Example: $10,000 account, 1% risk, T3 ATR = 50 points, 2x multiplier → Position Size = ($10,000 × 0.01) / (2 × 50) = $100 / 100 points = 1 unit per point
Important: The ATR multiplier (1.5x - 3.0x) should be determined through backtesting for your specific instrument and strategy - using inappropriate multipliers may result in stops that are too tight (frequent stop-outs) or too wide (excessive losses)
Adjust the volume factor to match your trading style: lower VF for responsive stop distances in short-term trading, higher VF for stable stop distances in position trading
Dynamic Stop-Loss Placement:
Determine your risk tolerance multiplier (typically 1.5x to 3.0x T3 ATR)
For long positions: Set stop-loss at entry price minus (multiplier × current T3 ATR value)
For short positions: Set stop-loss at entry price plus (multiplier × current T3 ATR value)
Trail stop-losses by recalculating based on current T3 ATR as the trade progresses
Adjust the volume factor based on desired stop-loss stability: higher VF for less frequent adjustments, lower VF for more adaptive stops
Market Regime Identification:
Calculate a reference volatility level using a longer-period moving average of T3 ATR (e.g., 50-period SMA)
High Volatility Regime: Current T3 ATR significantly above reference (e.g., 120%+) - favor trend-following strategies, breakout trades, and wider targets
Normal Volatility Regime: Current T3 ATR near reference (e.g., 80-120%) - employ standard trading strategies appropriate for prevailing market structure
Low Volatility Regime: Current T3 ATR significantly below reference (e.g., <80%) - favor mean-reversion strategies, range trading, and prepare for potential volatility expansion
Monitor T3 ATR trend direction and compare current values to recent history to identify regime transitions early
Risk Management Implementation:
Establish your maximum portfolio heat (total risk across all positions, typically 2-6% of capital)
For each position: Calculate position size using the formula Position Size = (Account × Individual Risk %) / (ATR Multiplier × Current T3 ATR)
When T3 ATR increases: Position sizes automatically decrease (same risk %, larger stop distance = smaller position)
When T3 ATR decreases: Position sizes automatically increase (same risk %, smaller stop distance = larger position)
This approach maintains constant dollar risk per trade regardless of market volatility changes
Use consistent volume factor settings across all positions to ensure uniform risk measurement
📋 DETAILED PARAMETER CONFIGURATION
ATR Length Parameter:
Default Setting: 14 periods
This is the standard ATR calculation period established by Welles Wilder, providing balanced volatility measurement that captures both short-term fluctuations and medium-term trends across most markets and timeframes
Selection Principles:
Shorter periods increase sensitivity to recent volatility changes and respond faster to market shifts, but may produce less stable readings
Longer periods emphasize sustained volatility trends and filter out short-term noise, but respond more slowly to genuine regime changes
The optimal period depends on your holding time, trading frequency, and the typical volatility cycle of your instrument
Consider the timeframe you trade: Intraday traders typically use shorter periods, swing traders use intermediate periods, position traders use longer periods
Practical Approach:
Start with the default 14 periods and observe how well it captures volatility patterns relevant to your trading decisions
If ATR seems too reactive to minor price movements: Increase the period until volatility readings better reflect meaningful market changes
If ATR lags behind obvious volatility shifts that affect your trades: Decrease the period for faster response
Match the period roughly to your typical holding time - if you hold positions for N bars, consider ATR periods in a similar range
Test different periods using historical data for your specific instrument and strategy before committing to live trading
T3 Volume Factor Parameter:
Default Setting: 0.7
This setting provides a reasonable balance between responsiveness and smoothness for most market conditions and trading styles
Understanding the Volume Factor:
Lower values (closer to 0.0) reduce smoothing, allowing T3 ATR to respond more quickly to volatility changes but with less noise filtering
Higher values (closer to 1.0) increase smoothing, producing more stable readings that focus on sustained volatility trends but respond more slowly
The trade-off is between immediacy and stability - there is no universally optimal setting
Selection Principles:
Match to your decision speed: If you need to react quickly to volatility changes for entries/exits, use lower VF; if you're making longer-term risk assessments, use higher VF
Match to market character: Noisier, choppier markets may benefit from higher VF for clearer signals; cleaner trending markets may work well with lower VF for faster response
Match to your preference: Some traders prefer responsive indicators even with occasional false signals, others prefer stable indicators even with some delay
Practical Adjustment Guidelines:
Start with default 0.7 and observe how T3 ATR behavior aligns with your trading needs over multiple sessions
If readings seem too unstable or noisy for your decisions: Try increasing VF toward 0.9-1.0 for heavier smoothing
If the indicator lags too much behind volatility changes you care about: Try decreasing VF toward 0.3-0.5 for faster response
Make meaningful adjustments (0.2-0.3 changes) rather than small increments - subtle differences are often imperceptible in practice
Test adjustments in simulation or paper trading before applying to live positions
📈 PERFORMANCE ANALYSIS & COMPETITIVE ADVANTAGES
Responsiveness Characteristics:
The T3 smoothing algorithm provides improved responsiveness compared to traditional RMA smoothing used in standard ATR. The triple exponential design with volume factor control allows the indicator to respond more quickly to genuine volatility changes while maintaining the ability to filter noise through appropriate VF settings. This results in earlier detection of volatility regime changes compared to standard ATR, particularly valuable for risk management and position sizing adjustments.
Signal Stability:
Unlike simple smoothing methods that may produce erratic signals during transitional periods, T3 ATR's multi-layer exponential smoothing provides more stable signal progression. The volume factor parameter allows traders to tune signal stability to their preference, with higher VF settings producing remarkably smooth volatility profiles that help avoid overreaction to temporary market fluctuations.
Comparison with Standard ATR:
Adaptability: T3 ATR allows adjustment of smoothing characteristics through the volume factor without changing the ATR period, whereas standard ATR requires changing the period length to alter responsiveness, potentially affecting the fundamental volatility measurement
Lag Reduction: At lower volume factor settings, T3 ATR responds more quickly to volatility changes than standard ATR with equivalent periods, providing earlier signals for risk management adjustments
Noise Filtering: At higher volume factor settings, T3 ATR provides superior noise filtering compared to standard ATR, producing cleaner signals for long-term analysis without sacrificing volatility measurement accuracy
Flexibility: A single T3 ATR configuration can serve multiple trading styles by adjusting only the volume factor, while standard ATR typically requires multiple instances with different periods for different trading applications
Suitable Use Cases:
T3 ATR is well-suited for the following scenarios:
Dynamic Risk Management: When position sizing and stop-loss placement need to adapt quickly to changing volatility conditions
Multi-Style Trading: When a single volatility indicator must serve different trading approaches (day trading, swing trading, position trading)
Volatile Markets: When standard ATR produces too many false volatility signals during choppy conditions
Systematic Trading: When algorithmic systems require a single, configurable volatility input that can be optimized for different instruments
Market Regime Analysis: When clear identification of volatility expansion and contraction phases is critical for strategy selection
Known Limitations:
Like all technical indicators, T3 ATR has limitations that users should understand:
Historical Nature: T3 ATR is calculated from historical price data and cannot predict future volatility with certainty
Smoothing Trade-offs: The volume factor setting involves a trade-off between responsiveness and smoothness - no single setting is optimal for all market conditions
Extreme Events: During unprecedented market events or gaps, T3 ATR may not immediately reflect the full scope of volatility until sufficient data is processed
Relative Measurement: T3 ATR values are most meaningful in relative context (compared to recent history) rather than as absolute thresholds
Market Context Required: T3 ATR measures volatility magnitude but does not indicate price direction or trend quality - it should be used in conjunction with directional analysis
Performance Expectations:
T3 ATR is designed to help traders measure and adapt to changing market volatility conditions. When properly configured and applied:
It can help reduce position risk during volatile periods through appropriate position sizing
It can help identify optimal times for more aggressive position sizing during stable periods
It can improve stop-loss placement by adapting to current market conditions
It can assist in strategy selection by identifying volatility regimes
However, volatility measurement alone does not guarantee profitable trading. T3 ATR should be integrated into a comprehensive trading approach that includes directional analysis, proper risk management, and sound trading psychology.
USAGE NOTES
This indicator is designed for technical analysis and educational purposes. T3 ATR provides adaptive volatility measurement but has limitations and should not be used as the sole basis for trading decisions. The indicator measures historical volatility patterns, and past volatility characteristics do not guarantee future volatility behavior. Market conditions can change rapidly, and extreme events may produce volatility readings that fall outside historical norms.
Traders should combine T3 ATR with directional analysis tools, support/resistance analysis, and other technical indicators to form a complete trading strategy. Proper backtesting and forward testing with appropriate risk management is essential before applying T3 ATR-based strategies to live trading. The volume factor parameter should be optimized for specific instruments and trading styles through careful testing rather than assuming default settings are optimal for all applications.

AI Bot Regime Feed (v6) — stableThis indicator generates real-time, structured JSON alerts for external trading bots or automation systems.
It combines multiple technical layers to identify market regimes and high-probability buy/sell events, and sends them to any webhook endpoint (e.g., a FastAPI or Zapier listener).

Squeeze Hour Frequency [CHE]Squeeze Hour Frequency (ATR-PR) — Standalone — Tracks daily squeeze occurrences by hour to reveal time-based volatility patterns
Summary
This indicator identifies periods of unusually low volatility, defined as squeezes, and tallies their frequency across each hour of the day over historical trading sessions. By aggregating counts into a sortable table, it helps users spot hours prone to these conditions, enabling better scheduling of trading activity to avoid or target specific intraday regimes. Signals gain robustness through percentile-based detection that adapts to recent volatility history, differing from fixed-threshold methods by focusing on relative lowness rather than absolute levels, which reduces false positives in varying market environments.
Motivation: Why this design?
Traders often face uneven intraday volatility, with certain hours showing clustered low-activity phases that precede or follow breakouts, leading to mistimed entries or overlooked calm periods. The core idea of hourly squeeze frequency addresses this by binning low-volatility events into 24 hourly slots and counting distinct daily occurrences, providing a historical profile of when squeezes cluster. This reveals time-of-day biases without relying on real-time alerts, allowing proactive adjustments to session focus.
What’s different vs. standard approaches?
- Reference baseline: Classical volatility tools like simple moving average crossovers or fixed ATR thresholds, which flag squeezes uniformly across the day.
- Architecture differences:
- Uses persistent arrays to track one squeeze per hour per day, preventing overcounting within sessions.
- Employs custom sorting on ratio arrays for dynamic table display, prioritizing top or bottom performers.
- Handles timezones explicitly to ensure consistent binning across global assets.
- Practical effect: Charts show a persistent table ranking hours by squeeze share, making intraday patterns immediately visible—such as a top hour capturing over 20 percent of total events—unlike static overlays that ignore temporal distribution, which matters for avoiding low-liquidity traps in crypto or forex.
How it works (technical)
The indicator first computes a rolling volatility measure over a specified lookback period. It then derives a relative ranking of the current value against recent history within a window of bars. A squeeze is flagged when this ranking falls below a user-defined cutoff, indicating the value is among the lowest in the recent sample.
On each bar, the local hour is extracted using the selected timezone. If a squeeze occurs and the bar has price data, the count for that hour increments only if no prior mark exists for the current day, using a persistent array to store the last marked day per hour. This ensures one tally per unique trading day per slot.
At the final bar, arrays compile counts and ratios for all 24 hours, where the ratio represents each hour's share of total squeezes observed. These are sorted ascending or descending based on display mode, and the top or bottom subset populates the table. Background shading highlights live squeezes in red for visual confirmation. Initialization uses zero-filled arrays for counts and negative seeds for day tracking, with state persisting across bars via variable declarations.
No higher timeframe data is pulled, so there is no repaint risk from external fetches; all logic runs on confirmed bars.
Parameter Guide
ATR Length — Controls the lookback for the volatility measure, influencing sensitivity to short-term fluctuations; shorter values increase responsiveness but add noise, longer ones smooth for stability — Default: 14 — Trade-offs/Tips: Use 10-20 for intraday charts to balance quick detection with fewer false squeezes; test on historical data to avoid over-smoothing in trending markets.
Percentile Window (bars) — Sets the history depth for ranking the current volatility value, affecting how "low" is defined relative to past; wider windows emphasize long-term norms — Default: 252 — Trade-offs/Tips: 100-300 bars suit daily cycles; narrower for fast assets like crypto to catch recent regimes, but risks instability in sparse data.
Squeeze threshold (PR < x) — Defines the cutoff for flagging low relative volatility, where values below this mark a squeeze; lower thresholds tighten detection for rarer events — Default: 10.0 — Trade-offs/Tips: 5-15 percent for conservative signals reducing false positives; raise to 20 for more frequent highlights in high-vol environments, monitoring for increased noise.
Timezone — Specifies the reference for hourly binning, ensuring alignment with market sessions — Default: Exchange — Trade-offs/Tips: Set to "America/New_York" for US assets; mismatches can skew counts, so verify against chart timezone.
Show Table — Toggles the results display, essential for reviewing frequencies — Default: true — Trade-offs/Tips: Disable on mobile for performance; pair with position tweaks for clean overlays.
Pos — Places the table on the chart pane — Default: Top Right — Trade-offs/Tips: Bottom Left avoids candle occlusion on volatile charts.
Font — Adjusts text readability in the table — Default: normal — Trade-offs/Tips: Tiny for dense views, large for emphasis on key hours.
Dark — Applies high-contrast colors for visibility — Default: true — Trade-offs/Tips: Toggle false in light themes to prevent washout.
Display — Filters table rows to focus on extremes or full list — Default: All — Trade-offs/Tips: Top 3 for quick scans of risky hours; Bottom 3 highlights safe low-squeeze periods.
Reading & Interpretation
Red background shading appears on bars meeting the squeeze condition, signaling current low relative volatility. The table lists hours as "H0" to "H23", with columns for daily squeeze counts, percentage share of total squeezes (summing to 100 percent across hours), and an arrow marker on the top hour. A summary row above details the peak count, its share, and the leading hour. A label at the last bar recaps total days observed, data-valid days, and top hour stats. Rising shares indicate clustering, suggesting regime persistence in that slot.
Practical Workflows & Combinations
- Trend following: Scan for hours with low squeeze shares to enter during stable regimes; confirm with higher highs or lower lows on the 15-minute chart, avoiding top-share hours post-news like tariff announcements.
- Exits/Stops: Tighten stops in high-share hours to guard against sudden vol spikes; use the table to shift to conservative sizing outside peak squeeze times.
- Multi-asset/Multi-TF: Defaults work across crypto pairs on 5-60 minute timeframes; for stocks, widen percentile window to 500 bars. Combine with volume oscillators—enter only if squeeze count is below average for the asset.
Behavior, Constraints & Performance
Logic executes on closed bars, with live bars updating counts provisionally but finalizing on confirmation; table refreshes only at the last bar, avoiding intrabar flicker. No security calls or higher timeframes, so no repaint from external data. Resources include a 5000-bar history limit, loops up to 24 iterations for sorting and totals, and arrays sized to 24 elements; labels and table are capped at 500 each for efficiency. Known limits: Skips hours without bars (e.g., weekends), assumes uniform data availability, and may undercount in sparse sessions; timezone shifts can alter profiles without warning.
Sensible Defaults & Quick Tuning
Start with ATR Length at 14, Percentile Window at 252, and threshold at 10.0 for broad crypto use. If too many squeezes flag (noisy table), raise threshold to 15.0 and narrow window to 100 for stricter relative lowness. For sluggish detection in calm markets, drop ATR Length to 10 and threshold to 5.0 to capture subtler dips. In high-vol assets, widen window to 500 and threshold to 20.0 for stability.
What this indicator is—and isn’t
This is a historical frequency tracker and visualization layer for intraday volatility patterns, best as a filter in multi-tool setups. It is not a standalone signal generator, predictive model, or risk manager—pair it with price action, news filters, and position sizing rules.
Disclaimer
The content provided, including all code and materials, is strictly for educational and informational purposes only. It is not intended as, and should not be interpreted as, financial advice, a recommendation to buy or sell any financial instrument, or an offer of any financial product or service. All strategies, tools, and examples discussed are provided for illustrative purposes to demonstrate coding techniques and the functionality of Pine Script within a trading context.
Any results from strategies or tools provided are hypothetical, and past performance is not indicative of future results. Trading and investing involve high risk, including the potential loss of principal, and may not be suitable for all individuals. Before making any trading decisions, please consult with a qualified financial professional to understand the risks involved.
By using this script, you acknowledge and agree that any trading decisions are made solely at your discretion and risk.
Do not use this indicator on Heikin-Ashi, Renko, Kagi, Point-and-Figure, or Range charts, as these chart types can produce unrealistic results for signal markers and alerts.
Best regards and happy trading
Chervolino
Thanks to Duyck
for the ma sorter

Swing Data - SimplifiedThe swing data indicator by jfsrev but simplified. Thank you jfsrev for your work!
Advanced Chandelier Exit with S/R [Alpha Extract]Advanced Chandelier Exit with S/R is a precision-crafted trailing stop and market structure detection system that fuses advanced Chandelier Exit logic with intelligent, multi-timeframe support and resistance tracking. This indicator delivers adaptive trend detection, volatility-aware exit positioning, and real-time structural mapping in a clean, responsive format. By combining directional filtering, pivot zone detection, and customizable styling, Advanced Chandelier Exit with S/R is designed to give traders reliable context, strong risk management, and visually intuitive confirmation signals across all timeframes and asset classes.
🔶 Adaptive Trailing Stop Architecture
At the core of Advanced Chandelier Exit with S/R is a refined Chandelier Exit mechanism that dynamically calculates trailing stops based on recent highs and lows, ATR volatility, and trend sensitivity. The system features directional memory, anchoring the stop to maintain position until a confirmed trend break occurs. This method prevents premature flips and keeps the trade aligned with sustained momentum.
longStop := close > longStop ? math.max(longStop, longStop ) : longStop
shortStop := close < shortStop ? math.min(shortStop, shortStop ) : shortStop
🔶 Volatility-Weighted Filtering
To reduce noise and improve reaction quality, Advanced Chandelier Exit with S/R includes an optional volatility normalization filter. This system adjusts ATR output based on how elevated it is relative to its own average, effectively down-weighting erratic price moves while maintaining responsiveness in directional phases.
volatilityFilter = enableVolatilityFilter ? ta.sma(baseATR, length) / baseATR : 1.0
atr = mult * baseATR * sensitivity * volatilityFilter
🔶 Trend Strength-Aware State Transitions
Trend flips in Advanced Chandelier Exit with S/R are not based solely on price crossing the stop level. Instead, the system includes a momentum-derived trend strength filter that validates the legitimacy of directional shifts. This guards against weak reversals and gives stronger confidence in breakout moves.
priceChange = math.abs(close - close )
avgPriceChange = ta.sma(priceChange, length)
trendStrength = math.min(priceChange / avgPriceChange * 100, 200)
🔶 Multi-Timeframe Support & Resistance Zones
Advanced Chandelier Exit with S/R embeds a sophisticated pivot-based structure mapping engine that automatically identifies significant price reaction levels and tracks their validity over time. It filters redundant zones, removes invalidated levels, and renders real-time support and resistance overlays based on market structure.
if isUniqueLevel(ph, resistanceLevels)
array.unshift(resistanceLevels, ph)
if isUniqueLevel(pl, supportLevels)
array.unshift(supportLevels, pl)
🔶 Dynamic Visual Encoding
The indicator uses strength-scaled fills, customizable colors, and line styling to convey directional bias with clarity. Color opacity intensifies as trend strength increases, offering intuitive context at a glance. Dynamic background fills mark trend states, while S/R zones are rendered with user-defined transparency for clean integration.
🔶 Signal Detection and Alerts
Directional signals are generated upon confirmed flips between long and short regimes, validated by stop crosses and strength filters. Additionally, the indicator provides S/R breakout alerts, identifying when price breaks through a key structural level.
🔶 Performance and Customization Optimizations
Advanced Chandelier Exit with S/R is built with modularity and efficiency in mind. It supports full customization of stop logic, volatility sensitivity, structural lookback, S/R zone filtering, and visual display. The use of array-based data structures for S/R levels ensures consistent performance even across high-activity assets and longer lookback periods.
Advanced Chandelier Exit with S/R represents the next evolution in trailing stop and structure-aware trading tools. By blending the proven logic of the Chandelier Exit system with intelligent trend strength filters and robust S/R detection, it becomes more than just a stop indicator—it becomes a complete trade management companion. Traders benefit from fewer false flips, clearer directional bias, and precise structural overlays that reinforce both breakout and reversal strategies. Whether used for swing entries, intraday positioning, or zone-based re-entries, Advanced Chandelier Exit with S/R empowers traders with responsive, intelligent logic that adapts to market conditions without compromise.

1m Scalping ATR (with SL & Zones)A universal ATR indicator that anchors volatility to your stop-loss.
Read any market (FX, JPY pairs, Gold/Silver, indices, crypto) consistently—regardless of pip/point conventions and timeframe.
Why this indicator?
Classic ATR is absolute (pips/points) and feels different across markets/TFs. ATR Takeoff normalizes ATR to your stop-loss in pips and highlights clear zones for “quiet / ideal / too volatile,” so you instantly know if a 10-pip SL fits current conditions.
Key features
Auto pip detection (FX, JPY, XAU/XAG, indices, BTC/ETH).
Selectable ATR source: chart timeframe or fixed ATR TF (e.g., “15”, “30”, “60”).
Display modes:
Percent of SL – ATR relative to SL in %, great for M1 (typical 10–30%).
Multiple of SL – ATR as a multiple of SL (e.g., 0.6× / 1.0× / 1.2×).
Panel zones:
Green = “Ready for takeoff” (≤ Low), Yellow = reference (Mid), Red = too volatile (≥ High).
Status badge (top-right): Quiet / ATR ok / Wild, current ATR/SL value, ATR TF used.
Direction-agnostic: Works the same for longs and shorts.
Inputs (at a glance)
Length / Smoothing (RMA/SMA/EMA/WMA): ATR base settings.
Your Stop-Loss (Pips): Reference SL (e.g., 10).
ATR Timeframe (empty = chart): Use chart TF or a fixed TF.
Display Mode: “Percent of SL” or “Multiple of SL.”
Low/Mid/High (Percent Mode): Zone thresholds in % of SL.
Low/Mid/High (Multiple Mode): Zone thresholds in ×SL.
Recommended defaults
Length 14, Smoothing RMA, SL 10 pips
Display Mode: Percent of SL
Low/Mid/High (%): 15 / 20 / 25
ATR Timeframe: empty (= chart) for reactive, or “30” for smoother M30 context with M1 entries.
How to use
Set SL (pips). 2) Choose display mode. 3) Optionally pick ATR TF.
Interpretation:
≤ Low (green): setups allowed.
≈ Mid (yellow): neutral reference.
≥ High (red): too volatile → adjust SL/size or wait.
Note: Auto-pip relies on common ticker naming; verify on exotic symbols.
Disclaimer: For research/education. Not financial advice.

Risk Recommender — (Heatmap)📊 Risk Recommender — Per-Trade & Annualized (Heatmap Columns)
Estimate the optimal risk percentage for any market regime.
This tool dynamically recommends how much of your account equity to risk — either per trade or at a portfolio (annualized) level — using volatility as the guide.
⚙️ How it works
Two distinct modes give you flexibility:
1️⃣ Per-Trade (ATR-based)
• Calculates the current Average True Range (ATR) compared to its long-term baseline.
• When volatility is high (ATR ↑), risk per trade decreases to maintain constant dollar risk.
• When volatility is low (ATR ↓), risk per trade increases within your defined floor and ceiling.
• The display is normalized by stop distance (× ATR) and smoothed to avoid noise.
2️⃣ Annualized (Volatility Targeting)
• Computes realized volatility (standard deviation of log returns) and an EWMA forecast of future volatility.
• Blends current and forecast volatilities to estimate “effective” volatility.
• Scales your base risk so that portfolio volatility converges toward your chosen annual target (e.g., 20%).
• Useful for portfolio-level or systematic strategies that maintain constant volatility exposure.
🎨 Heatmap Visualization
The vertical column graph acts like a thermometer:
• 🟥 Red → “Reduce risk” (volatility high).
• 🟩 Green → “Increase risk” (volatility low).
• Smoothed and bounded between your Floor and Ceiling risk levels.
• Optional dotted guides mark those bounds.
• Label shows the current mode, recommended risk %, and key metrics (ATR ratio or effective volatility).
🔧 Key Inputs
• Base max risk per trade (%) — your normal per-trade risk budget.
• ATR length / Baseline ATR length — control sensitivity to short- vs. long-term volatility.
• Target annualized volatility (%) — portfolio volatility target for quant mode.
• λ (lambda) — smoothing factor for the EWMA volatility forecast (0.90–0.99 typical).
• Floor & Ceiling — clamps the output to avoid extreme sizing.
• Smoothing & Hysteresis — prevent rapid changes in risk recommendations.
🧮 Interpreting the Output
• “Recommended Risk (%)” = suggested portion of equity to risk on the next trade (or current exposure).
• In Per-Trade mode: reflects current ATR ÷ baseline ATR .
• In Annualized mode: reflects target volatility ÷ effective volatility .
• Use the color and height of the column as a quick visual cue for aggressiveness.
💡 Typical Use Cases
• Position-sizing overlay for discretionary traders.
• Volatility-targeting component for algorithmic or multi-asset systems.
• Educational tool to understand how volatility governs prudent risk management.
📘 Notes
• This indicator provides risk suggestions only ; it does not place trades.
• Works on any symbol or timeframe.
• Combine with your own strategy or alerts for full automation.
• All calculations use built-in Pine functions; no proprietary logic.
Tags:
#RiskManagement #ATR #Volatility #Quant #PositionSizing #SystematicTrading #AlgorithmicTrading #Portfolio #TradingStrategy #Heatmap #EWMA #Risk

Market Pressure Differential (MPD) [SharpStrat]Market Pressure Differential (MPD)
Concept & Purpose
The Market Pressure Differential (MPD) is a proprietary indicator designed to measure the internal balance of buying and selling pressure directly on the price chart.
Unlike standard momentum or trend indicators, MPD analyzes the structural behavior of each candle—its body, wicks, and overall range—to determine whether the market is dominated by expansion (buying aggression) or contraction (selling absorption).
This indicator provides a visual overlay of market pressure that adapts dynamically to volatility, helping traders see real-time shifts in participation intensity without using oscillators.
In simple terms:
When MPD expands upward → buyer pressure dominates.
When MPD contracts downward → seller pressure dominates.
Calculation Overview
MPD uses a structural candle formula to compute directional pressure:
Body Ratio = (Close − Open) / (High − Low)
Wick Differential = (Lower Wick − Upper Wick) / (High − Low)
Raw Pressure = (Body Ratio × Body Weight) + (Wick Differential × Wick Weight)
Then it applies:
EMA smoothing (to stabilize short-term noise)
Standard deviation normalization (to maintain consistent scaling)
ATR projection (to adapt the signal visually to volatility)
This produces the MPD projection line and the pressure ribbon, drawn directly on the main chart.
Customizable Inputs
Users can adjust color schemes, EMA smoothing length, ATR parameters, normalization length, and body/wick weighting to adapt the indicator’s sensitivity and aesthetic to different markets or chart themes.
How to Use
The Market Pressure Differential (MPD) visualizes the real-time balance between buying and selling pressure. It should be used as a contextual bias tool, not a standalone signal generator.
The white line represents the MPD projection, showing how market pressure evolves in real time based on candle structure and volatility.
The red line represents the ATR envelope, which defines the market’s expected volatility range.
MPD reacts quickly to candle structure, so trend bias is based on how its projection behaves relative to the ATR envelope:
Above the ATR band → positive pressure and bullish bias.
Below the ATR band → negative pressure and bearish bias.
Hovering near the ATR band → neutral or indecisive conditions.
The MPD percentage in the label represents the normalized strength of pressure relative to recent volatility.
Positive % = buying dominance.
Negative % = selling dominance.
Higher absolute values = stronger momentum compared to volatility.
To trade with MPD:
Watch candle colors and the projection line — green or positive % shows buyer control, red or negative % shows seller control.
Note transitions above or below the ATR level for early signs of momentum shifts.
Combine MPD signals with price structure, key levels, or volume for confirmation.
This helps reveal which side controls the market and whether that pressure is strong enough to overcome typical volatility.
Disclaimer
It introduces a novel structural–pressure approach to visualizing market dynamics.
For educational and analytical purposes only; this does not constitute financial advice.

Quant Trend + Donchian (Educational, Public-Safe)What this does
Educational, public-safe visualization of a quant regime model:
• Trend : EMA(64) vs EMA(256) (EWMAC proxy)
• Breakout : Donchian channel (200)
• Volatility-awareness : internal z-scores (not plotted) for concept clarity
Why it’s useful
• Shows when trend & breakout align (clean regimes) vs conflict (chop)
• Helps explain why volatility-aware systems size up in smooth trends and scale down in noise
How to read it
• EMA64 above EMA256 with price near/above Donchian high → trend-following alignment
• EMA64 below EMA256 with price near/below Donchian low → bearish alignment
• Inside channel with EMAs tangled → range/chop risk
Notes
• Indicator is educational only (no orders).
• Built entirely with TradingView built-ins.
• For consistent visuals: enable “Indicator values on price scale” and disable “Scale price chart only” in Settings → Scales .

ATR Horizontal Lines from EMA and SMA with TableHow it works:
The script calculates ATR levels (of your choosing)
Instead of plotting curves, it creates horizontal lines
The lines are deleted and recreated on each bar to show current levels
Lines extend to the right or can be limited to a certain width
Customization options:
Line width (1-10 pixels)
Individual colors for each of the 4 lines
All the original parameters (EMA/SMA lengths, ATR length, multipliers)
The horizontal lines will now show the current ATR-based support/resistance levels and move dynamically as the EMAs, SMA, and ATR values change with new price data.

Vol-Pace Projected-ATR-ADX-Alert-MAThe VolSC indicator analyzes stock volume trends with a focus on the Pace metric, which projects today's volume as a percentage of the 30-day average, highlighting unusual activity (e.g., over 200% turns bright green with alerts). The phantom projection bar, a wide green histogram to the right of the last bar, visually represents this projected volume on daily charts only, aiding quick identification of potential volume surges without cluttering intraday or weekly views. Additional features include ADX strength, ATR averages, and customizable table display for comprehensive insights.
Key Features:
* Primary Indicator: Volume with ADX (Average Directional Index) text.
* Pacing and Alerts: Calculates the volume pace for the day. Features an unusual volume alert with an adjustable threshold (e.g., 200%).
* Volume Projection: Projects a visual "Phantom Volume" for the day, offset to the right of the actual volume bar.
* ATR Indicator: Displays the 2x ATR (Average True Range) value as text.
* Volume Average: Displays the ADV (Average Daily Volume) Moving Average as text.
* Customization: Most settings are adjustable.

Atlantean Sideways / Range Regime DetectorPurpose
When using trend based indicators, you can skip the false signals when there is a sideways action, protecting you from the false signals.
Flags likely sideways/range phases using three checks:
Weak trend (ADX from DMI)
Price compression (Bollinger Band Width, normalized)
Low volatility (NATR = ATR/Price%)
Logic
isSideways = (ADX < adxThresh) AND (bbNorm < 0.25) AND (NATR < natrMax)
When true: bars + background turn teal and a provisional Range High/Low (rolling rangeWin) is drawn.
Key Inputs
DMI: diLen(22)
Optimized for 15 mins Bitcoin, could change it to 14 for more general approach
ADX: adxSmooth(14), adxThresh(18)
Volatility: lenATR(14), natrMax(1.8)
Visuals: rangeWin(20), bar/range toggles
Quick Tuning
More signals: raise adxThresh to 20–25, raise natrMax to 2.5–4.0, increase BB cutoff by editing bbNorm < 0.25 --> 0.35–0.50.
Smoother range lines: increase rangeWin to 30–40.
Use Cases
Mean reversion inside teal ranges.
Breakout prep when price closes outside the drawn range after teal ends. Could be used as a signal although not suggested.
Filter trend systems: skip trades when sidewaysCond is true. This is the main purpose, for it to be combined with trend based indicators, like Supertrend.
Alert
“Sideways Detected” triggers when isSideways is true.
Script could be expanded upon your requests.

ATR Volatility and Trend AnalysisATR Volatility and Trend Analysis
Unlock the power of the Average True Range (ATR) with the ATR Volatility and Trend Analysis indicator. This comprehensive tool is designed to provide traders with a multi-faceted view of market dynamics, combining volatility analysis, dynamic support and resistance levels, and trend detection into a single, easy-to-use indicator.
How It Works
The ATR Volatility and Trend Analysis indicator is built upon the core concept of the ATR, a classic measure of market volatility. It expands on this by providing several key features:
Dynamic ATR Bands: The indicator plots three sets of upper and lower bands around the price. These bands are calculated by multiplying the current ATR value by user-defined multipliers. They act as dynamic support and resistance levels, widening during volatile periods and contracting during calm markets.
Volatility Breakout Signals: Identify potential breakouts with precision. The indicator generates a signal when the current ATR value surges above its own moving average by a specified threshold, indicating a significant increase in volatility that could lead to a strong price move.
Trend Detection: The indicator determines the market trend by analyzing both price action and ATR behavior. A bullish trend is signaled when the price is above its moving average and volatility is increasing. Conversely, a bearish trend is signaled when the price is below its moving average and volatility is increasing.
How to Use the ATR Multi-Band Indicator
Identify Support and Resistance: Use the ATR bands as key levels. Price approaching the outer bands may indicate overbought or oversold conditions, while a break of the bands can signal a strong continuation.
Confirm Breakouts: Look for a volatility breakout signal to confirm the strength behind a price move. A breakout from a consolidation range accompanied by a volatility signal is a strong indicator of a new trend.
Trade with the Trend: Use the background coloring and trend signals to align your trades with the dominant market direction. Enter long positions during confirmed bullish trends and short positions during bearish trends.
Set Up Alerts: The indicator includes alerts for band crosses, trend changes, and volatility breakouts, ensuring you never miss a potential trading opportunity.
What makes it different?
While many indicators use ATR, the ATR Volatility and Trend Analysis tool is unique in its integration of multiple ATR-based concepts into a single, cohesive system. It doesn't just show volatility; it interprets it in the context of price action to deliver actionable trend and breakout signals, making it a complete solution for ATR-based analysis.
Disclaimer
This indicator is designed as a technical analysis tool and should be used in conjunction with other forms of analysis and proper risk management.
Past performance does not guarantee future results, and traders should thoroughly test any strategy before implementing it with real capital.
