Strategy Builder Crypto V6Hello everyone
This indicator is the result of 7 years of trading (including 3 years of analyzing day and night how crypto assets behave).
I made it fully customizable but I wouldn't recommend changing the default values as they're the most optimal ones for now. Might change in the future but I'm very happy with the signals so far and I hope you'll be as well :)
Without further due, let's dig into it...
0 - Algo trading and Why
In the crypto trading, there is a lot of useless noise (we can probably thank Crypto Twitter for that :p) and a lot of useless data with the sole purpose is to lure you (who said Bitfinex Long/Short ratio or CME gaps ??)
I wanted to remove all the useless and only focus on Technical Analysis (TA) because I was deeply convinced that TA includes by design Fundamental Analysis (FA) and Pumponomics Analysis (PA) - PA being for instance when your favorite twitter guru will pump and dump on you
I heard that so many people got REKT from the previous bear market and I wanted to give back to the community - who helped me so much a few years back.
I worked hard to design the method and make it simple for the public and for FREE (so far as I want to collect feedbacks from the community and improving the indicator)
THIS IS MY GIFT TO YOU
1 - Input values
I'll explain later on through a medium article what each parameter means and how to set them up. For now, please used the optimized and recommended values already set in the indicator
2 - The method
This method works for intraday trading for timeframes between m5 and H1. Any timeframe above could work but would give signals too late - in this case, I would recommend changing the inputs with smaller values to adjust
I see a trend being composed of a main trend, and mini sub trends. In other words, for instance, a weekly bullish trend is made of smaller H4 bullish trends. Hope it makes sense so far
Let's call the weekly trend the MAIN trend and the H4 smaller trends the SECONDARY trends
That's exactly what this indicator is about
It will catch the best MAIN trend and all the SECONDARY trends in the same direction of the MAIN trend.
It's up to you if you want to take all the SECONDARY trends or only the first one in the sequence.
3 - Invalidation signal
A signal invalidation is used to make you exiting your position with a small loss before your stop loss will get hit. Very powerful way to save your capital and limit your losses.
You'll find the indicator here on tradingview for free under the name Trend signal with Alert (made by myself)
Trend signal with Alert
to invalidate entries. You'll need to request an invite
Briefly, let's assume we get a BUY signal. I would exit the position either if I'm getting a DOWN trend signal. It means, if the oblique/logarithmic trendline is broken, then it's better to exit the position and wait for the indicator to give another BUY signal later hopefully
Best case, it will limit your loss in case the asset will dump.
Worst case, this strict management strategy will make you exiting your position for no reason and you'll re-enter later (with a signal) at almost the same price or a bit higher
In the long run, this method will prevent you from having big losses
4 - Stop Loss and Take profits levels
It's really up to you. It depends of your capital and psychology
This indicator is made to give big moves but that's not 100% guaranteed. You can draw some trendlines or use moving averages in big timeframes to set your take profit and stop loss levels.
I personally use this also, along with fibonacci on the weekly/monthly timeframes for my take profit levels
As I'm a nice person, I'm linking the Fibonacci indicator that I use here
Automatic Multi-timeframes fibonacci zones
. You'll also need to request an invite for that one
4-bis - Trailing stop
Not financial advice but I use a supertrend and I have a software that will trail my stop according to that supertrend level
For LONG positions, we could set the trailing below the supertrend.
For SHORT positions, we could set the trailing above the supertrend.
You'll find the indicator here on tradingview for free under the name Supertrend V1.0 - Buy or Sell Signal
5 - Which assets
It's working with the default values on major/mid/small caps and for ALTS/BTC, ALTS/USD and ALTS/ETH pairing
YES, THIS IS MOST AWESOME THING OF THE ENTIRE UNIVERSE !!!
6 - Best setup
m15 timeframe is my preferred one for this method. Best Risk/Reward/Invalidations ratio among all other timeframes
I strongly recommend to use the Trend Signal with the input value 14 for the invalidations
If you enter on a BUY signal, and get a RED trend signal, exit immediately the position without waiting for any other confirmation/pullback or anything else
If you enter on a SELL signal, and get a BLUE trend signal, exit immediately the position without waiting for any other confirmation/pullback or anything else
For the trailing stop/Supertrend value, it depends of your capital and how big your stop loss should be. I personally use the settings in the Supertrend indicator
7 - Alerts
You can setup alerts for the primary and secondary signals in Tradingview so that you won't have to stare at the charts all day long. You mental healthy is my priority above everything else :)
8 - More to come
I personally use the alerts from this indicator coupled with a system to take the trades given by the tradingview alerts. I'll publish it later on if I feel the indicator collects enough interest from you guys
Algotrading

Combo Backtest 123 Reversal & Breakout Range Long This is combo strategies for get a cumulative signal.
First strategy
This System was created from the Book "How I Tripled My Money In The
Futures Market" by Ulf Jensen, Page 183. This is reverse type of strategies.
The strategy buys at market, if close price is higher than the previous close
during 2 days and the meaning of 9-days Stochastic Slow Oscillator is lower than 50.
The strategy sells at market, if close price is lower than the previous close price
during 2 days and the meaning of 9-days Stochastic Fast Oscillator is higher than 50.
Second strategy
Breakout Range Long Strategy
WARNING:
- For purpose educate only
- This script to change bars colors.

Combo Backtest 123 Reversal & Bill Williams Averages. 3Lines This is combo strategies for get
a cumulative signal. Result signal will return 1 if two strategies
is long, -1 if all strategies is short and 0 if signals of strategies is not equal.
First strategy
This System was created from the Book "How I Tripled My Money In The
Futures Market" by Ulf Jensen, Page 183. This is reverse type of strategies.
The strategy buys at market, if close price is higher than the previous close
during 2 days and the meaning of 9-days Stochastic Slow Oscillator is lower than 50.
The strategy sells at market, if close price is lower than the previous close price
during 2 days and the meaning of 9-days Stochastic Fast Oscillator is higher than 50.
Second strategy
This indicator calculates 3 Moving Averages for default values of
13, 8 and 5 days, with displacement 8, 5 and 3 days: Median Price (High+Low/2).
The most popular method of interpreting a moving average is to compare
the relationship between a moving average of the security's price with
the security's price itself (or between several moving averages).
WARNING:
- For purpose educate only
- This script to change bars colors.

Three Line Break Backtest This is a modified version of the three line break price representation.
It is composed with 2 lines made of Close price values forming a “cloud”.
If the trend is bullish and the price breach the lower level of the green
cloud, a new bearish trend is taking place.
If the current trend is bearish and the price breakout the upper band of
the cloud, a new bullish trend is forming.
This is a “price action” indicator, signals may be filtered by long term trend
analysis with other indicators such as Supertrend for instance.
WARNING:
- For purpose educate only
- This script to change bars colors.

Combo Backtest 123 Reversal & Bear Power This is combo strategies for get
a cumulative signal. Result signal will return 1 if two strategies
is long, -1 if all strategies is short and 0 if signals of strategies is not equal.
First strategy
This System was created from the Book "How I Tripled My Money In The
Futures Market" by Ulf Jensen, Page 183. This is reverse type of strategies.
The strategy buys at market, if close price is higher than the previous close
during 2 days and the meaning of 9-days Stochastic Slow Oscillator is lower than 50.
The strategy sells at market, if close price is lower than the previous close price
during 2 days and the meaning of 9-days Stochastic Fast Oscillator is higher than 50.
Second strategy
Bear Power Indicator
To get more information please see "Bull And Bear Balance Indicator"
by Vadim Gimelfarb.
WARNING:
- For purpose educate only
- This script to change bars colors.

Combo Backtest 123 Reversal & (H-L)/C Histogram This is combo strategies for get
a cumulative signal. Result signal will return 1 if two strategies
is long, -1 if all strategies is short and 0 if signals of strategies is not equal.
First strategy
This System was created from the Book "How I Tripled My Money In The
Futures Market" by Ulf Jensen, Page 183. This is reverse type of strategies.
The strategy buys at market, if close price is higher than the previous close
during 2 days and the meaning of 9-days Stochastic Slow Oscillator is lower than 50.
The strategy sells at market, if close price is lower than the previous close price
during 2 days and the meaning of 9-days Stochastic Fast Oscillator is higher than 50.
Second strategy
This histogram displays (high-low)/close
Can be applied to any time frame.
WARNING:
- For purpose educate only
- This script to change bars colors.

Combo Backtest 123 Reversal & Bandpass FilterThis is combo strategies for get
a cumulative signal. Result signal will return 1 if two strategies
is long, -1 if all strategies is short and 0 if signals of strategies is not equal.
First strategy
This System was created from the Book "How I Tripled My Money In The
Futures Market" by Ulf Jensen, Page 183. This is reverse type of strategies.
The strategy buys at market, if close price is higher than the previous close
during 2 days and the meaning of 9-days Stochastic Slow Oscillator is lower than 50.
The strategy sells at market, if close price is lower than the previous close price
during 2 days and the meaning of 9-days Stochastic Fast Oscillator is higher than 50.
Second strategy
The related article is copyrighted material from
Stocks & Commodities Mar 2010
You can use in the xPrice any series: Open, High, Low, Close, HL2, HLC3, OHLC4 and ect...
WARNING:
- For purpose educate only
- This script to change bars colors.

Momentum Signal Moving AverageThis is a script with one modified indicator that mainly tracks and executes positions openings by calculating volume and "enthusiasm" from the exchanges coin pairs. I recommend that it is used on a 15m chart.
When it is a bullish trend it is configured to take profit, but this is of course something you can set values or disable. In bearish trends, the script opens bigger positions, and when a bounce happens the script starts taking profit.
In stagnation, the script used to be week, and made losses. However, with the added scalping feature it seems to at least even it out, or even make profit as I have seen now.
It's still a very 1.0 script and will get updated to make sure the profit keeps getting higher percentage.
I use the Alerts Trader extension to execute orders from Tradingview in Chrome via Bitmex API.
I use it on Bitmex, but surely you can use it on other exchanges that are supported in the Alerts Trader extension, which is extensive.
Important : You will be able to add this script to your chart, but you won't be able to se the source code, so to make it work you need to set the alerts right, with correct code for it to work.
Here is where I come in:
I'll give each user 3 day trial, and after that, if you are satisfied and want to run it longer, you can subscribe for $49/month.
And if you have bigger capital, I will install it and configure it to match the amount of contracts you wish to have.
If you are a person with big capital, you can get 1 week of trial.
And for people with big capital, you can get personal support from me when needed to alter settings or create new alerts. This will cost $50 each time.
But remember, you can also run the trial on the Bitmex testnet, but the volume is very low there so the bot does not preform as well on the testnet as it does on the mainet with big volume.
I am willing to let someone, a 3rd party, with good reputation test it for a few days and make an honest review after.
Disclaimer: I cannot guarantee that this script will make you rich, but after a week of testing, both on testnet and mainnet, the results are good enough for me. (I am no financial expert or professional trader. Any losses from the algorithm is not my issue, use it at your own risk. Always run the script/bot with money you can afford to lose)
All payments to me are made in bitcoin.

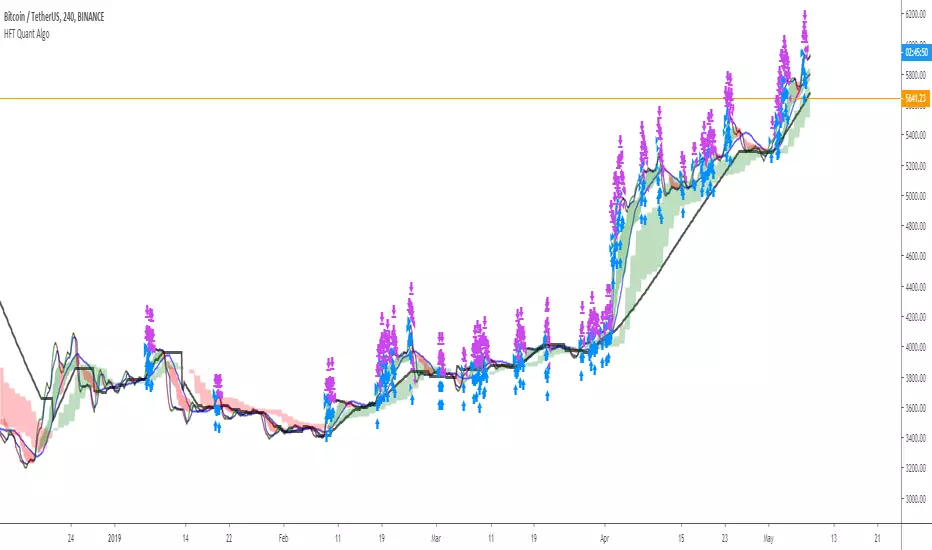
HFT Quant AlgoPrivate Fund Algo - HFT/Quant Approach Beta I
2019 Performance
1/Jan/2019 ~ 8/May/2019
Included:
Commission 0.1%
Slippage 100 ticks
Combo Backtest 123 Reversal and ADXR This is combo strategies for get
a cumulative signal. Result signal will return 1 if two strategies
is long, -1 if all strategies is short and 0 if signals of strategies is not equal.
First strategy
This System was created from the Book "How I Tripled My Money In The
Futures Market" by Ulf Jensen, Page 183. This is reverse type of strategies.
The strategy buys at market, if close price is higher than the previous close
during 2 days and the meaning of 9-days Stochastic Slow Oscillator is lower than 50.
The strategy sells at market, if close price is lower than the previous close price
during 2 days and the meaning of 9-days Stochastic Fast Oscillator is higher than 50.
Secon strategy
The Average Directional Movement Index Rating (ADXR) measures the strength
of the Average Directional Movement Index (ADX). It's calculated by taking
the average of the current ADX and the ADX from one time period before
(time periods can vary, but the most typical period used is 14 days).
Like the ADX, the ADXR ranges from values of 0 to 100 and reflects strengthening
and weakening trends. However, because it represents an average of ADX, values
don't fluctuate as dramatically and some analysts believe the indicator helps
better display trends in volatile markets.
WARNING:
- For purpose educate only
- This script to change bars colors.

Combo Backtest 123 Reversal and Accelerator Oscillator (AC) This is combo strategies for get
a cumulative signal. Result signal will return 1 if two strategies
is long, -1 if all strategies is short and 0 if signals of strategies is not equal.
First strategy
This System was created from the Book "How I Tripled My Money In The
Futures Market" by Ulf Jensen, Page 183. This is reverse type of strategies.
The strategy buys at market, if close price is higher than the previous close
during 2 days and the meaning of 9-days Stochastic Slow Oscillator is lower than 50.
The strategy sells at market, if close price is lower than the previous close price
during 2 days and the meaning of 9-days Stochastic Fast Oscillator is higher than 50.
Second strategy
The Accelerator Oscillator has been developed by Bill Williams
as the development of the Awesome Oscillator. It represents the
difference between the Awesome Oscillator and the 5-period moving
average, and as such it shows the speed of change of the Awesome
Oscillator, which can be useful to find trend reversals before the
Awesome Oscillator does.
WARNING:
- For purpose educate only
- This script to change bars colors.

Combo Backtest 123 Reversal and Absolute Price Oscillator (APO) This is combo strategies for get
a cumulative signal. Result signal will return 1 if two strategies
is long, -1 if all strategies is short and 0 if signals of strategies is not equal.
First strategy
This System was created from the Book "How I Tripled My Money In The
Futures Market" by Ulf Jensen, Page 183. This is reverse type of strategies.
The strategy buys at market, if close price is higher than the previous close
during 2 days and the meaning of 9-days Stochastic Slow Oscillator is lower than 50.
The strategy sells at market, if close price is lower than the previous close price
during 2 days and the meaning of 9-days Stochastic Fast Oscillator is higher than 50.
Secon strategy
The Absolute Price Oscillator displays the difference between two exponential
moving averages of a security's price and is expressed as an absolute value.
How this indicator works
APO crossing above zero is considered bullish, while crossing below zero is bearish.
A positive indicator value indicates an upward movement, while negative readings
signal a downward trend.
Divergences form when a new high or low in price is not confirmed by the Absolute Price
Oscillator (APO). A bullish divergence forms when price make a lower low, but the APO
forms a higher low. This indicates less downward momentum that could foreshadow a bullish
reversal. A bearish divergence forms when price makes a higher high, but the APO forms a
lower high. This shows less upward momentum that could foreshadow a bearish reversal.
WARNING:
- For purpose educate only
- This script to change bars colors.

Combo Strategies 123 Reversal and 3-Bar-Reversal-Pattern This is combo strategies for get
a cumulative signal. Result signal will return 1 if two strategies
is long, -1 if all strategies is short and 0 if signals of strategies is not equal.
First strategy
This System was created from the Book "How I Tripled My Money In The
Futures Market" by Ulf Jensen, Page 183. This is reverse type of strategies.
The strategy buys at market, if close price is higher than the previous close
during 2 days and the meaning of 9-days Stochastic Slow Oscillator is lower than 50.
The strategy sells at market, if close price is lower than the previous close price
during 2 days and the meaning of 9-days Stochastic Fast Oscillator is higher than 50.
Secon strategy
This startegy based on 3-day pattern reversal described in "Are Three-Bar
Patterns Reliable For Stocks" article by Thomas Bulkowski, presented in
January,2000 issue of Stocks&Commodities magazine.
That pattern conforms to the following rules:
- It uses daily prices, not intraday or weekly prices;
- The middle day of the three-day pattern has the lowest low of the three days, with no ties allowed;
- The last day must have a close above the prior day's high, with no ties allowed;
- Each day must have a nonzero trading range.
WARNING:
- For purpose educate only
- This script to change bars colors.

Combo Backtest 123 Reversal and 2/20 EMA This is combo strategies for get
a cumulative signal. Result signal will return 1 if two strategies
is long, -1 if all strategies is short and 0 if signals of strategies is not equal.
First strategy
This System was created from the Book "How I Tripled My Money In The
Futures Market" by Ulf Jensen, Page 183. This is reverse type of strategies.
The strategy buys at market, if close price is higher than the previous close
during 2 days and the meaning of 9-days Stochastic Slow Oscillator is lower than 50.
The strategy sells at market, if close price is lower than the previous close price
during 2 days and the meaning of 9-days Stochastic Fast Oscillator is higher than 50.
Secon strategy
This indicator plots 2/20 exponential moving average. For the Mov
Avg X 2/20 Indicator, the EMA bar will be painted when the Alert criteria is met.
Please, use it only for learning or paper trading. Do not for real trading.
WARNING:
- For purpose educate only
- This script to change bars colors.

Commodity Selection Index Backtest The Commodity Selection Index ("CSI") is a momentum indicator. It was
developed by Welles Wilder and is presented in his book New Concepts in
Technical Trading Systems. The name of the index reflects its primary purpose.
That is, to help select commodities suitable for short-term trading.
A high CSI rating indicates that the commodity has strong trending and volatility
characteristics. The trending characteristics are brought out by the Directional
Movement factor in the calculation--the volatility characteristic by the Average
True Range factor.
Wilder's approach is to trade commodities with high CSI values (relative to other
commodities). Because these commodities are highly volatile, they have the potential
to make the "most money in the shortest period of time." High CSI values imply
trending characteristics which make it easier to trade the security.
The Commodity Selection Index is designed for short-term traders who can handle
the risks associated with highly volatile markets.
WARNING:
- For purpose educate only
- This script to change bars colors.

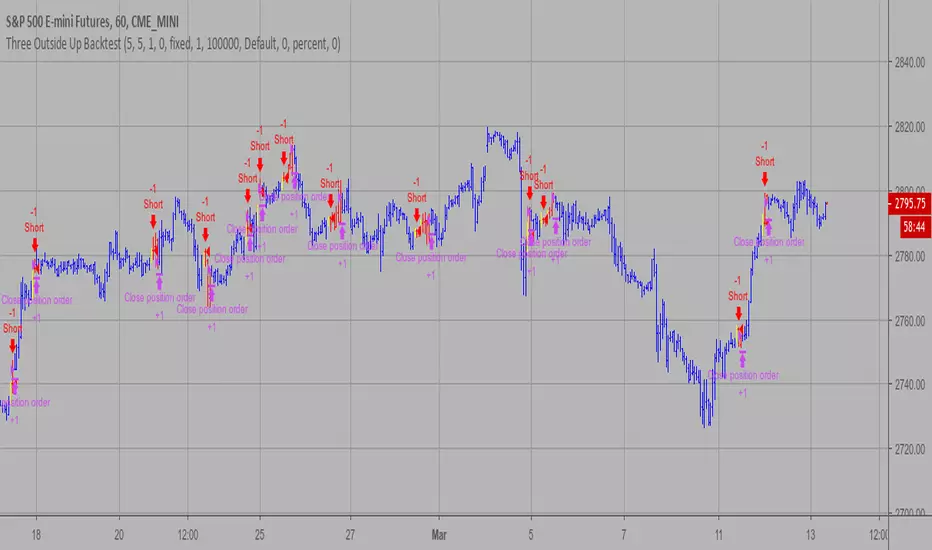
Three Outside Up Backtest This is a three candlestick bullish reversal pattern consisting of a bullish
engulfing pattern formed by the first two candlesticks then followed by an up
candlestick with a higher close than the prior candlestick.
WARNING:
- For purpose educate only
- This script to change bars colors.
Three Outside Down Backtest This is a three candlestick bearish reversal pattern consisting of a bearish
engulfing pattern formed by the first two candlesticks then followed by a down
candlestick with a lower close than the prior candlestick.
WARNING:
- For purpose educate only
- This script to change bars colors.

VWAP & TWAPFor Hong Kong market only.
Apply the indicators on 1 min chart.
Check off futures/stock buttons which fit your needs.
VWAP is a indicator which takes into account volume and price to calculate the average cost of overall market players. Price above VWAP, bull is in control, vice versa. TWAP, in addition, is included in this package and functions similarly as VWAP, yet without putting weight on volume.
Green is for only one day (average cost of market positions of previous day) , pink and blue are for the whole week (average cost of market positions of last five weekdays).
For any inquiry and collaboration, please drop me a private message.
This is an protected script, exclusively for friends and anyone who are interested.

Three Inside Up Backtest This is a three candlestick bullish reversal pattern consisting of a
bullish harami pattern formed by the first 2 candlesticks then followed
by up candlestick with a higher close than the prior candlestick.
WARNING:
- For purpose educate only
- This script to change bars colors.

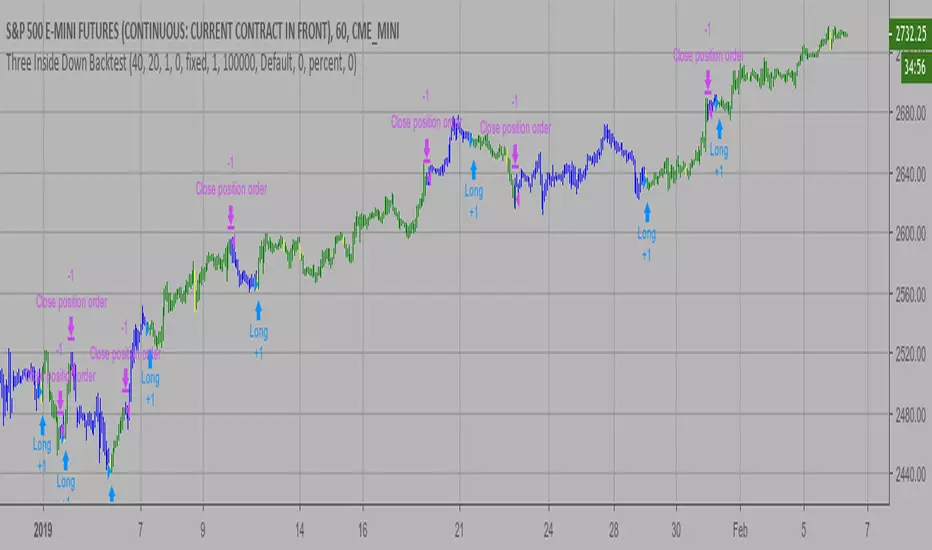
Three Inside Down Backtest This is a three candlestick bearish reversal pattern consisting of a bearish
harami pattern formed by the first 2 candlesticks then followed by down
candlestick with a lower close than the prior candlestick.
WARNING:
- For purpose educate only
- This script to change bars colors.
Adaptive Zero Lag EMA v2This is my most successful strategy to date! Please enjoy and join the Open Source movement by sharing your code and ideas online!
OPERATING PRINCIPLE
The strategy is based on Ehlers idea that any indicator can be turned into a signal-producing trade system through smoothing and other filtering processes.
In fact, I'm using his Zero Lag EMA (ZLEMA) as a baseline indicator as well as some code snippets he has made public (1). God bless open source!
Next, I've provided the option to use an Instantaneous Frequency Measurement (IFM) method, which will adaptively choose the best period for the ZLEMA (2)
I've written other studies that use the differential calculus approximations for IFM, so it was only natural to include them in this strategy.
The primary two are Cosine IFM (3) and In-phase Quadrature IFM (4). You can also find an indicator with both plotted and the ability to average them together, as one IFM prefers long periods and the other short. (5)
BEFORE WE BEGIN
1. This strategy only runs on "normal" FX pairs (EURUSD, GBPJPY, AUDUSD ...) and will fail on Metals or Commodities.
Cryptos are largely untested.
2. Please run it on these time frames: M15 to D.
Anything outside this range will likely fail.
HOW TO USE AND SUCCEED
1. If the Default settings don't produce good results right off the bat, then lower gain limit to 1 or 2 and threshold to 0.01.
2. Test each setting under adaptive method . If you want to leave it Off , then I'd recommend using some kind of IFM (see my links below) to
discover the most efficient period to use.
3. Once you have the best adaptive method chosen, begin incrementing gain limit until you find a nice balance between profit factor (PF) and drawdown.
4. Now, begin incrementing threshold . The goal is to have PF above 2 and a drawdown as low as possible.
5. Finally, change the source ! Typically, close is the best option, but I have run into cases where high
yielded the highest returns and win rate.
6. Sit back, relax, and tweak the risk until you're happy with the return and drawdown amounts.
ADVANCED
You may need to adjust take profit (TP) points and stop loss (SL) points to create the best entry possible. Don't be greedy! You'll likely have poor
results if the TP is set to 300 and SL is 50.
If you are trading a pair that has a long Dominant Cycle Period , then you may increase Max Period to allow the IFM
to accept longer periods. Any period above the Max Period will be rejected. This may increase lag time!
Cheers and good luck trading!
-DasanC
PS - This code doesn't repaint or have future-leak, which was present in Pinescript v2.
PPS - Believe me! These returns are typical! Sometimes you must push aside the "if it's too good to be true..." mindset that society has ingrained in you.
Do you really believe the most successful pass up opportunities before investigating them? ;)
(1) Ehlers & Ric Zero Lag EMA
(2) Measuring Cycles by Ehlers
(3) Cosine IFM
(4) Inphase Quadrature IFM
(5) Averaging IFM

Adaptive Zero Lag EMA Strategy [Ehlers + Ric]Behold! A strategy that makes use of Ehlers research into the field of signal processing and wins so consistently, on multiple time frames AND on multiple currency pairs.
The Adaptive Zero Lag EMA (AZLEMA) is based on an informative report by Ehlers and Ric .
I've modified it by using Cosine IFM, a method by Ehlers on determining the dominant cycle period without using fast-Fourier transforms
Instead, we use some basic differential equations that are simplified to approximate the cycle period over a 100 bar sample size.
The settings for this strategy allow you to scalp or swing trade! High versatility!
Since this strategy is frequency based, you can run it on any timeframe (M1 is untested) and even have the option of using adaptive settings for a best-fit.
>Settings
Source : Choose the value for calculations (close, open, high + low / 2, etc...)
Period : Choose the dominant cycle for the ZLEMA (typically under 100)
Adaptive? : Allow the strategy to continuously update the Period for you (disables Period setting)
Gain Limit : Higher = faster response. Lower = smoother response. See for more information.
Threshold : Provides a bit more control over entering a trade. Lower = less selective. Higher = More selective. (range from 0 to 1)
SL Points : Stop Poss level in points (10 points = 1 pip)
TP Points : Take Profit level in points
Risk : Percent of current balance to risk on each trade (0.01 = 1%)
www.mesasoftware.com
www.jamesgoulding.com(Measuring%20Cycles).doc
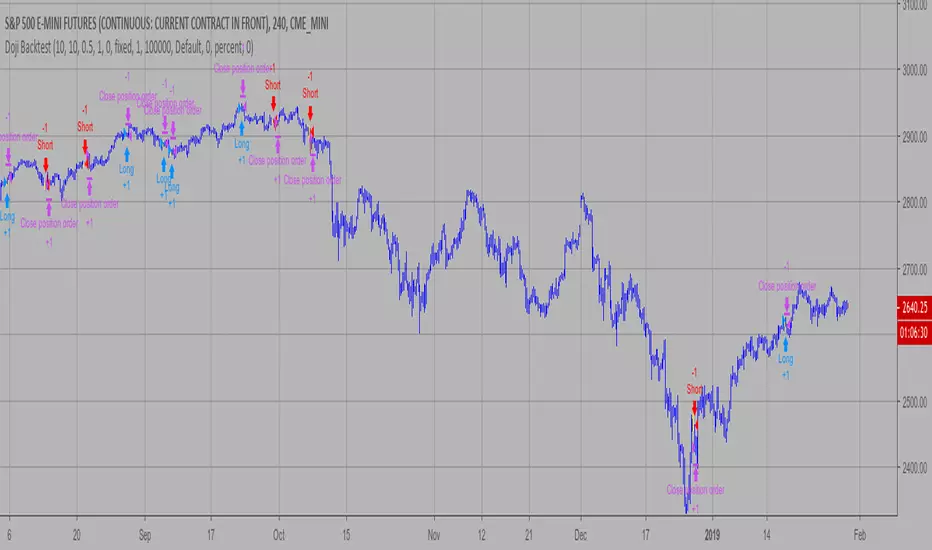
Doji Backtest This is a candlestick where the open and close are the same.
WARNING:
- For purpose educate only
- This script to change bars colors.