3 Zigzag for MTF Fib Alert [MsF]Japanese below / 日本語説明は英文の後にあります。
-------------------------
This indicator that automatically displays Fibonacci from each High & Low based on 3 Zigzags. It's useful for multi-timeframe analysis.
For example, Fibonacci calculated from the high and low prices (Zigzag 3 Period=100) of the upper timeframe can be displayed on the lower timeframe.
Also, you can set alerts for each Fibonacci point. It is useful when you are waiting for the price to return to the discount (50% or less) or the premium (50% or more) of the upper timeframe.
"Fib 1 - Crossing 0.00" … Trigger an alert when crossing the 0% line in Fibonacci of Zigzag1
"Fib 1 - Crossing 100.0" … Trigger an alert when crossing the 100% line in Fibonacci of Zigzag1
"Fib 1 - Crossing 23.6" … Trigger an alert when crossing the 23.6% line in Fibonacci of Zigzag1
"Fib 1 - Crossing 38.2" … Trigger an alert when crossing the 38.2% line in Fibonacci of Zigzag1
"Fib 1 - Crossing 50.0" … Trigger an alert when crossing the 50.0% line in Fibonacci of Zigzag1
"Fib 1 - Crossing 61.8" … Trigger an alert when crossing the 61.8% line in Fibonacci of Zigzag1
"Fib 1 - Crossing 76.4" … Trigger an alert when crossing the 76.4% line in Fibonacci of Zigzag1
*Same as Zigzag 1 and Zigzag 2 too.
"Choose Zig Zag Leg for fib" parameter means...
Latest : Calculate Fibonacci based on "the most recent Zigzag line".
Previous : Calculate Fibonacci based on "the previous Zigzag line".
-------------------------
3つのZigzagを元に各High&Lowからフィボナッチを自動で表示するインジケーターです。
Zigzagの期間を工夫することで、マルチタイムフレーム分析に役立ちます。
例えば、以下の設定とした場合:
Zigzag 1 Period … 8
Zigzag 2 Period … 25
Zigzag 3 Period … 100
上位時間足Zigzag(Period=100)の高値安値から形成されるフィボナッチを下位時間足に表示することができるのです。
また、このインジケーターではフィボナッチのポイント毎にアラートの設定が可能です。
上位時間足の割安価格(50%以下)や割高価格(50%以上)に価格が戻ってくるのを待っている時などに力を発揮してくれます。
"Fib 1 - Crossing 0.00" … Zigzag1のフィボナッチにおいて、0%ラインとクロスした場合にアラートを発報します
"Fib 1 - Crossing 100.0" … Zigzag1のフィボナッチにおいて、100%ラインとクロスした場合にアラートを発報します
"Fib 1 - Crossing 23.6" … Zigzag1のフィボナッチにおいて、23.6%ラインとクロスした場合にアラートを発報します
"Fib 1 - Crossing 38.2" … Zigzag1のフィボナッチにおいて、38.2%ラインとクロスした場合にアラートを発報します
"Fib 1 - Crossing 50.0" … Zigzag1のフィボナッチにおいて、50.0%ラインとクロスした場合にアラートを発報します
"Fib 1 - Crossing 61.8" … Zigzag1のフィボナッチにおいて、61.8%ラインとクロスした場合にアラートを発報します
"Fib 1 - Crossing 76.4" … Zigzag1のフィボナッチにおいて、76.4%ラインとクロスした場合にアラートを発報します
※Zigzag1およびZigzag2のフィボナッチも同様
"Choose Zig Zag Leg for fib"パラメータについて:
Latest … 一番新しいZigzagのライン(UpまたはDown)を元にフィボナッチを計算します。
Previous … ひとつ前のZigzagのライン(UpまたはDown)を元にフィボナッチを計算します。
Alert

RSI Multi Alerts MTFThis indicator won't plot anything to the chart.
Please follow steps below to set your alarms based on RSI oversold and overbought levels:
1) Add indicator to the chart
2) Go to settings
3) Choose up to 8 different symbols to get alert notification
4) Choose up to 4 different timeframes
5) Set overbought and oversold levels
6) Once all is set go back to the chart and click on 3 dots to set alert in this indicator, rename your alert and confirm
7) You can remove indicator after alert is set and it'll keep working as expected
What is does:
This indicator will generate alerts based on symbols, timeframes and RSI levels settings.
It will consider overbought and oversold levels to alert in each symbol and each timeframe selected. Once these levels are achieved it will send an alert with the following information:
- Symbol name (BTC, ETH, LTC)
- Specific RSI level achieved (e.g: RSI 30, RSI 70 or any custom level)
- Timeframe (e.g: 5m, 1h, 1D)
- Current symbol price
This script will request RSI OB/OS information through request.security() function from all different symbols and timeframes settings. It also requests symbols' price (close).
Due to Tradingview limitation (40 requests calls) it can only request information for 8 symbols for this script (8 symbols X 4 timeframes = 32 + 8 symbols' price (close) = 40)
Standard symbols are Binance USDT-M Futures but you can choose any symbol from Tradingview.
Standard timeframes are 5m|15m|1h|4h but you can choose from a list.
Standard overbought and oversold levels are 70 and 30 but you can change it to other integer values.
Feel free to give feedbacks on comments section below.
Enjoy!
Market Structure MA Based BOS [liwei666]
🎲 Overview
🎯 This BOS(Break Of Structure) indicator build based on different MA such as EMA/RMA/HMA, it's usually earlier than pivothigh() method
when trend beginning, customer your BOS with 2 parameters now.
🎲 Indicator design logic
🎯 The logic is simple and code looks complex, I‘ll explain core logic but not code details.
1. use close-in EMA's highest/lowest value mark as SWING High/Low when EMA crossover/under,
not use func ta.pivothigh()/ta.pivotlow()
2. once price reaching EMA’s SWING High/Low, draw a line link High/Low to current bar, labled as BOS
3. find regular pattern benefit your trading.
🎲 Settings
🎯 there are 4 input properties in script, 2 properties are meaningful in 'GRP1' another 2 are display config in 'GRP2'.
GRP1
MA_Type: MA type you can choose(EMA/RMA/SMA/HMA), default is 'HMA'.
short_ma_len: MA length of your current timeframe on chart
GRP2
show_short_zz: Show short_ma Zigzag
show_ma_cross_signal: Show ma_cross_signal
🎲 Usage
🎯 BOS signal usually worked fine in high volatility market, low volatility is meaningless.
🎯 We can see that it performs well in trending market of different symbols, and BOS is an opportunity to add positions
BINANCE:BTCUSDTPERP
BINANCE:ETHUSDTPERP
🎯 MA Based signal is earlier than pivothigh()/pivotlow() method when trend beginning. it means higher profit-loss rate.
🎯 any questions or suggestion please comment below.
Additionally, I plan to publish 20 profitable strategies in 2023; indicatior not one of them,
let‘s witness it together!
Hope this indicator will be useful for you :)
enjoy! 🚀🚀🚀

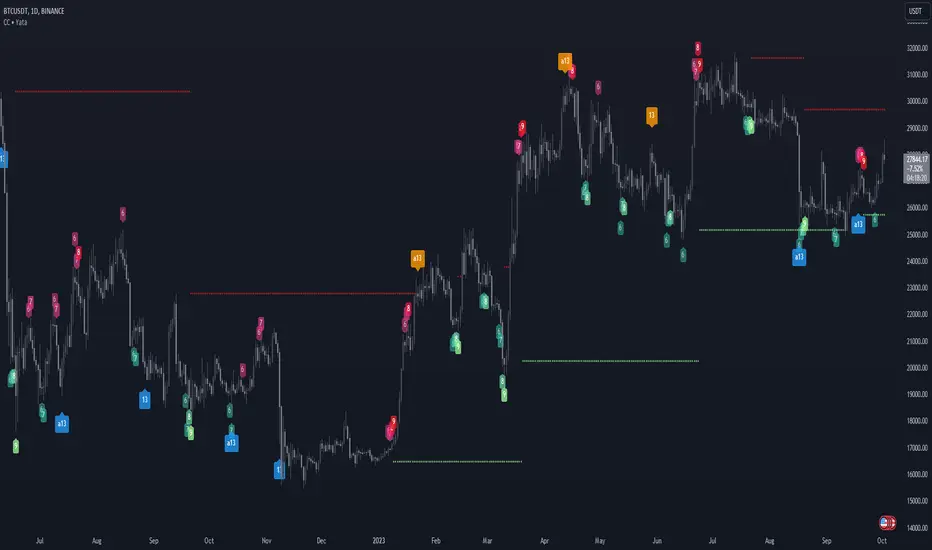
Consecutive Candles lite | Multi Timeframe
Choose to display numbers from 6, 7, 8 or only 9, showing a colored dot until the last number is reached to reduce the clutter
Support and resistance
Customizable labels, several styles are available
Identifies turning point in the trending price of an asset or an index.

Consecutive Candles | Multi Timeframe
Display all numbers or choose from 6, 7, 8 and 9 to reduce the clutter
Support and resistance
Customizable labels, several styles are available
Identifies turning point in the trending price of an asset or an index.
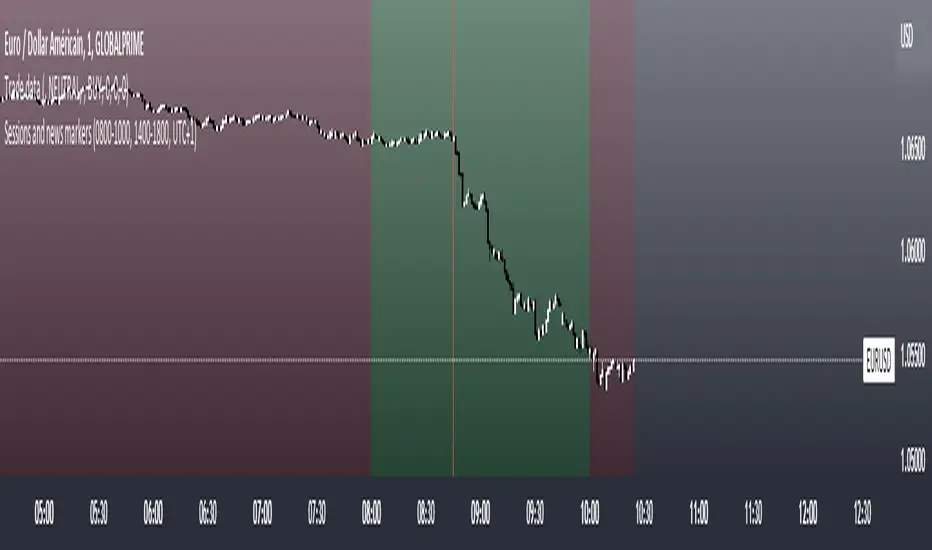
Sessions and news markersHello,
I use this script daily so I thought it might help some of you guys out!
WHAT IS THE SCRIPT
This script can show two custom trading sessions and up to three specific dates and hours to keep in mind while trading (for example a news release).
WHY USE THE SCRIPT
My trading plan tells me to trade from 08:00am to 10:00am (GMT+1) and not to let open trades during a high impact news release, this script allows me to show my trading session and mark the news releases on the chart before trading so I don't forget about them while in the heat of trading.
HOW TO USE THE SCRIPT
It is very straightforward:
How to set up the TRADING SESSIONS:
- Tick the trading sessions that you want to use (one or two)
- Specify the trading hours
- Choose the color of the trading sessions
- Choose the color to fill outside of the trading sessions
- Choose the time zone (GMT, GMT+1, UTC, UTC+2...)
How to set up the NEWS MARKERS:
- Tick the news markers you want to use (up to three)
- Specify the date and hours of the news
- Choose the color of the news markers
- No need to choose the time zone, it will use the timezone of the chart
PS: As you can see in the settings, each session and news marker can have their own color
I hope this helps you out as much as it helps me! If you have any recommendations I would be glad to hear them :)
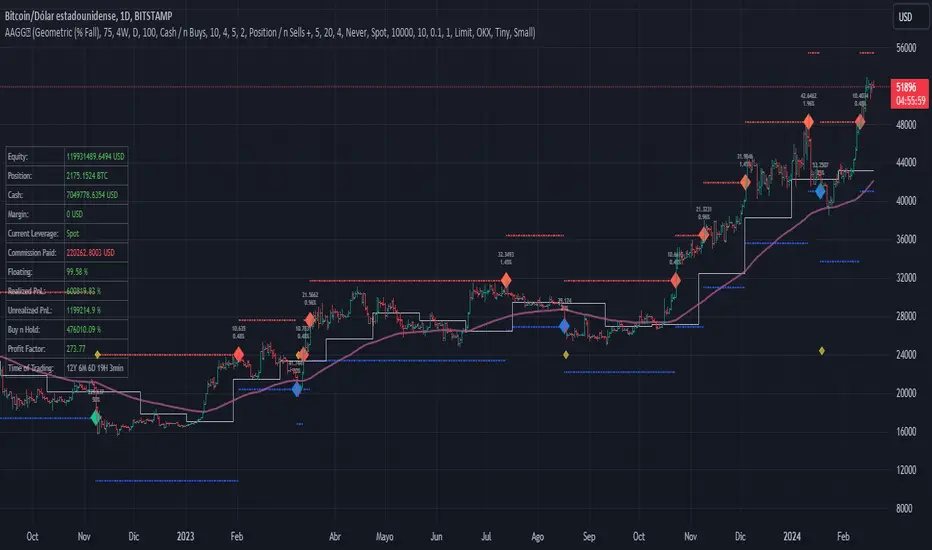
Assassin's Grid
Introduction: Are you a fan of automated grid-based trading and holding onto your crypto assets like they're the last Snickers bar in the world? If so, this Pine script could be your new best friend!
Grid Trading Genius: The script uses some seriously advanced grid trading techniques to automatically place orders at different price levels, creating a mesh of positions that move with the market like a well-oiled machine. This strategy can be great for traders who are willing to sit back and let their positions grow like a fine wine over time.
Optimization Features: The script comes loaded with all sorts of features and tools to help traders optimize their grid positions, like position exits and custom alerts for creating limit and market orders. This helps keep traders in the loop and allows them to take action as needed, like a ninja in the night.
Unique Twists: One of the unique features of this script is the option to choose between normal or incremental entry steps in a 1,2,3,... ratio. By choosing incremental entries, traders can potentially improve their average price and increase their potential profits like a boss. Just keep in mind that this script doesn't have a stop loss feature, but it does include the option to sell without profit on the final entry or on all entries if desired. Additionally, the script is always open to improvement and any ideas for improving it are welcome, like a blank canvas.
Conclusion: If you love automated trading and have the patience and determination to stick to a solid strategy, this Pine script could be a great fit for you. It's suitable for traders who are comfortable with more complex trading approaches and are willing to put in the time and effort to learn and master the script's various features and techniques, like a Jedi Knight
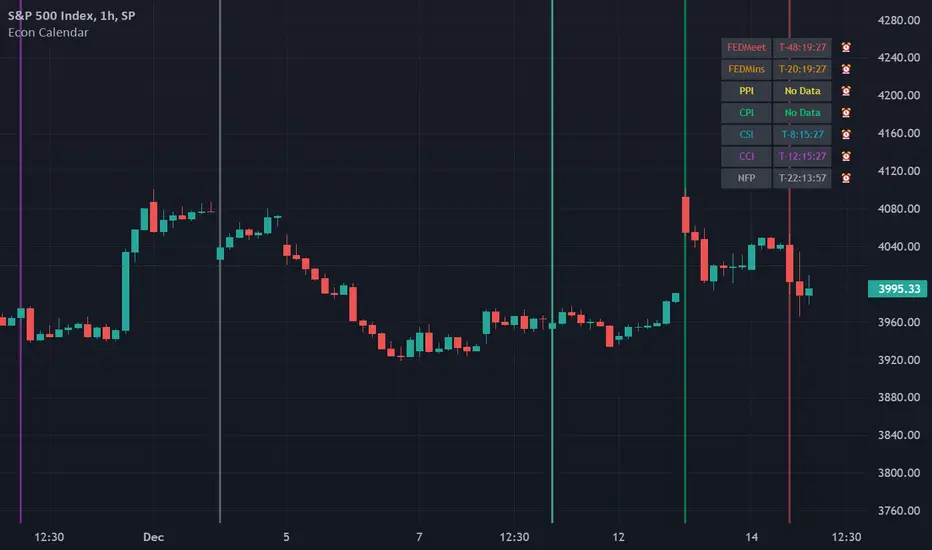
Odd_mod Econ CalendarA modification of Economic Calendar Events: FOMC, CPI, and more written by jdehorty . Please send all tips his way as he is maintaining the underlying data for the Calendar and the original concept.
List of changes:
Optimized code, will only run once on initialization now(No random line in middle of screen on bar change)
Legend - Added short names
Legend - Removed header
Legend - Made repositionable with selectable top margins
Legend - Removed data name from legend when it is disabled
Legend - Removed border
Original Description by jdehorty :
This script plots major events from the Economic Calendar that often correspond to major pivot points in various markets. It also includes built-in logic to retroactively adjust larger time intervals (i.e. greater than 1 hour) to be correctly aligned with the interval during which the event occurred.
Events are taken from the Economic Calendar and will be updated periodically at the following library:
EconomicCalendar
The above library can be used to conveniently access date-related data for major Meetings, Releases, and Announcements as integer arrays, which can be used in other indicators. Currently, it has support for the following events:
FOMC Meetings
The FOMC meets eight times a year to determine the course of monetary policy . The FOMC's decisions are based on a review of economic and financial developments and its assessment of the likely effects of these developments on the economic outlook.
FOMC Minutes
The FOMC minutes are released three weeks after each FOMC meeting. The minutes provide a detailed account of the FOMC's discussion of economic and financial developments and its assessment of the likely effects of these developments on the economic outlook.
Producer Price Index (PPI) Releases
The Producer Price Index (PPI) measures changes in the price level of goods and services sold by domestic producers. The PPI is a weighted average of prices of a basket of goods and services, such as transportation, food, and medical care. PPI is a leading indicator of CPI .
Consumer Price Index ( CPI ) Releases
The Consumer Price Index ( CPI ) measures changes in the price level of goods and services purchased by households. The CPI is a weighted average of prices of a basket of consumer goods and services, such as transportation, food, and medical care. CPI is one of the most widely used measures of inflation .
Consumer Sentiment Index ( CSI ) Releases
The University of Michigan's Consumer Sentiment Index ( CSI ) is a measure of consumer attitudes about the economy. The CSI is based on a monthly survey of U.S. households and reflects the consumers' assessment of present and future economic conditions. The CSI is a leading indicator of consumer spending, which accounts for about two-thirds of U.S. economic activity.
Consumer Confidence Index ( CCI ) Releases
The Consumer Confidence Index is a survey that measures how optimistic or pessimistic consumers are regarding their expected financial situation.
Non-Farm Payroll (NFP) Releases
The Non-Farm Payroll (NFP) is a measure of the change in the number of employed persons, excluding farm workers and government employees. The NFP is a leading indicator of consumer spending, which accounts for about two-thirds of U.S. economic activity.
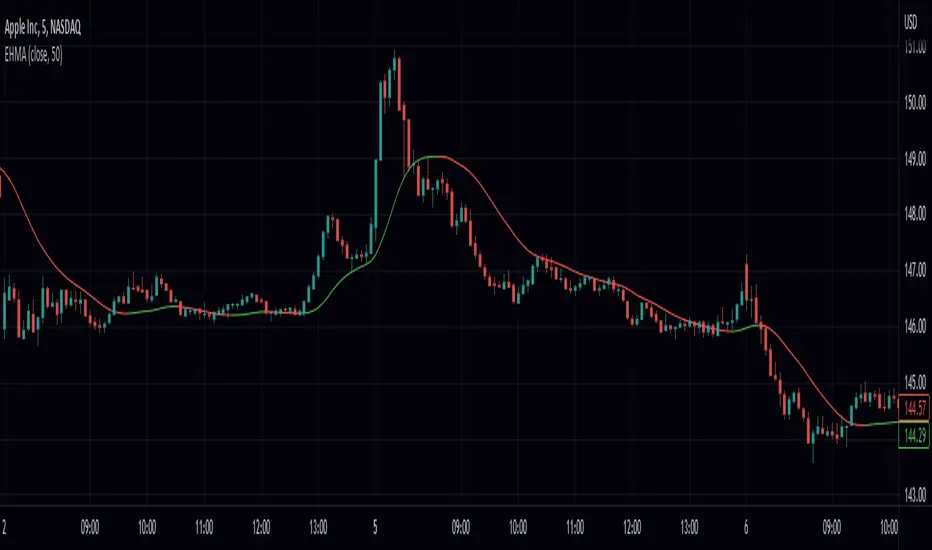
Exponential Hull Moving Average With Alerts (EHMA)Hello! This is simply HMA calculated with EMA's instead of WMA! I have added alerts for the direction of the average.
Heres a recap the traditional HMA:
The Hull Moving Average ( HMA ) attempts to minimize the lag of a traditional moving average while retaining the smoothness of the moving average line. Developed by Alan Hull in 2005, this indicator makes use of weighted moving averages to prioritize more recent values and greatly reduce lag.
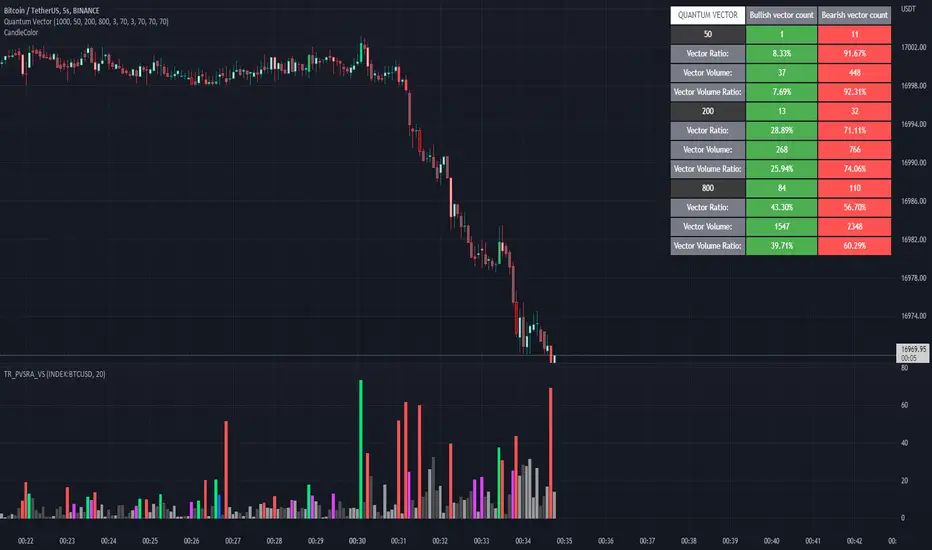
Quantum Vector AlertsIts the part 2 of Multiple Indicators 50EMA Cross Alerts.
Its more suitable for the seconds chart. Beside, you can use it in higher timeframe.
The input bars length is the sample size that the code will use to trigger all alert. 20 mean 20 bar after the current candle.
When you activate volume alert you can select an amount of volume that when volume cross it you will be notified. The volume of every bar is displayed in the screener below volume.
In the section percentage vector counting the script do the sum of the red vector and green vector and give a ratio. In bullish vector count percentage for alert, you can select the percentage difference that you want to receive an alert. If your sample have 3 red vectors and 7 green vectors you will receive an alert saying that there is an imbalance of 70% showing more green vectors.
You can select a variant of percentage vector. The variant will do a summation of volume. If 1 vector candle is the size of the 3 other vector, they will have the same ponderation.
Normal alert counting count the number of vectors in the bars length. You can count the red and green candle only or add the blue and violet.
Bullish vector count will show a notification when the number of green candle will appear on the chart in the selected length. The same process is valid for bearish vector count. For example, if you want 3 bullish candle in 20 bar. You select bars length 20 and bullish vector count 3.
These alerts are suitable to the hybrid system. Thanks to our teacher Trader Reality and to all the member that contribute to this great discord community.
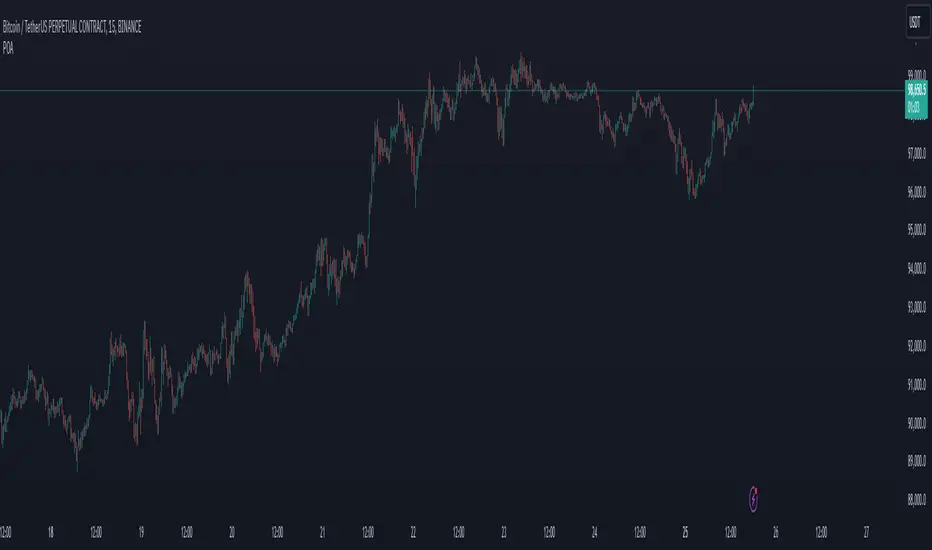
POALibrary "POA"
This library is a client script for making a webhook signal formatted string to POABOT server.
entry_message(password, percent, leverage, kis_number)
Create a entry message for POABOT
Parameters:
password : (string) The password of your bot.
percent : (float) The percent for entry based on your wallet balance.
leverage : (int) The leverage of entry. If not set, your levereage doesn't change.
kis_number : (int) The number of koreainvestment account.
Returns: (string) A json formatted string for webhook message.
close_message(password, percent, kis_number)
Create a close message for POABOT
Parameters:
password : (string) The password of your bot.
percent : (float) The percent for close based on your wallet balance.
kis_number : (int) The number of koreainvestment account.
Returns: (string) A json formatted string for webhook message.
exit_message(password, percent)
Create a exit message for POABOT
Parameters:
password : (string) The password of your bot.
percent : (float) The percent for exit based on your wallet balance.
Returns: (string) A json formatted string for webhook message.
in_trade(start_time, end_time)
Create a trade start line
Parameters:
start_time : (int) The start of time.
end_time : (int) The end of time.
Returns: (bool) Get bool for trade based on time range.
[TTI] Stage Analysis Alert IndexHISTORY AND CREDITS –––––––––––––––––––––––––––––––––––––––––––––––––––––––
The script is created based on lessons and interviews from Stan Weinstein. The Alert Index is being used by Stan and his team to gauge the general markets.
WHAT IT DOES– ––––––––––––––––––––––––––––––––––––––––––––––––––––––
This is an internal fundamental indicator that Stan and its team uses, that gauges the relationship between the 3 month T bill yield and the AAA bonds. The indicator uses the 3 colored system to determine favorable trading conditions in the market.
🟨 Yellow – OK conditions
🟩 Green – Great conditions
🟥 Red – Unfavorable conditions
Remember this is a fundamentals indicator and looks at the market from a much more macro picture.
HOW TO USE IT –––––––––––––––––––––––––––––––––––––––––––––––––––––––––––––
The indicator is to be used in order to determine the agressiveness of the position sizing in the market. Green conditions show very favorable market for long positions and yellow show ok conditions. However, during red condition the trader is advised not to be aggressively exposed in the market

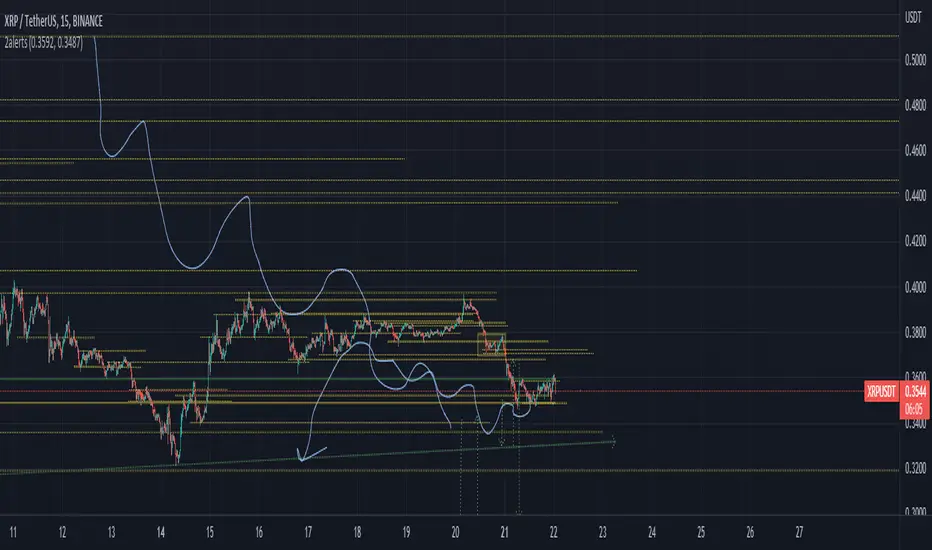
(2) Two AlertsCurrent Trading View free plan allows only ONE active alert.
This simple indicator Allows to trigger this ONE and ONLY alert when price reaches Higher, or Lower price level.
You can set levels and turn alerts for them on/off in settings, or by just drag-n-dropping Horizontal lines on the chart.
To set the only alert you need to create new alert, and change it's following parameters :
condition : 2alerts
Any alert function() call
Feel free to modify it on your needs.
Divergence Finder [Multigrain]█ OVERVIEW
This indicator is a divergence finder, designed to be overlayed on top of any oscillator. By utilizing an Exponential Moving Average, rather than built-in pivot functions, this allows for insignificant pivots of the oscillator to be filtered out. Additionally, by sampling more than just the previous oscillator pivot, this allows for divergences to be found that would otherwise be overlooked through other methods.
█ CONCEPTS
Interim Price Threshold
A new metric used when determining valid divergences is the Interim Price Threshold (IPT). The IPT is the maximum percent delta the price is allowed to "poke-through" the divergent line at any given time.
Interim Oscillator Threshold
Similar to the Interim Price Threshold, the Interim Oscillator Threshold (IOT) is the maximum percent delta the oscillator is allowed to "poke-through" the divergent line at any given time.
Dynamic Midline
Commonly a static midline is utilized when determining whether a divergence may be bullish or bearish. By utilizing the built-in percentile nearest rank function, the midline is automatically and dynamically determined based on the previous 250 bars. As a result certain divergences which may otherwise be overlooked will be discovered.
█ SETTINGS
Oscillator Source: The oscillator in which you want find divergences from. Default to a MACD oscillator when unchanged.
Price Source: The price source in which you want to find divergences from.
Moving Average Length: The length of the exponential moving average used when determining the pivot points of the selected oscillator.
█ USAGES
Divergence in technical analysis can indicate a significant bullish or bearish price move. A bullish divergence occurs when an asset's price makes a new low while an indicator begins to rise. A bearish divergence occurs when the price makes a new high but the indicator under consideration makes a lower high.

SuperTrend Multi Time Frame Long and Short Trading Strategy
Hello All
This is non-repainting Supertrend Multi Time Frame script, I got so many request on Supertrend with Multi Time Frame. This is for all of them ..I am making it open for all so you can change its coding according to your need.
How the Basic Indicator works
SuperTrend is one of the most common ATR based trailing stop indicators.
In this version you can change the ATR calculation method from the settings. Default method is RMA.
The indicator is easy to use and gives an accurate reading about an ongoing trend. It is constructed with two parameters, namely period and multiplier. The default values used while constructing a Supertrend indicator are 10 for average true range or trading period and three for its multiplier.
The average true range (ATR) plays an important role in 'Supertrend' as the indicator uses ATR to calculate its value. The ATR indicator signals the degree of price volatility .
The buy and sell signals are generated when the indicator starts plotting either on top of the closing price or below the closing price. A buy signal is generated when the ‘Supertrend’ closes above the price and a sell signal is generated when it closes below the closing price.
It also suggests that the trend is shifting from descending mode to ascending mode. Contrary to this, when a ‘Supertrend’ closes above the price, it generates a sell signal as the colour of the indicator changes into red.
A ‘Supertrend’ indicator can be used on spot, futures, options or forex, or even crypto markets and also on daily, weekly and hourly charts as well, but generally, it fails in a sideways-moving market.
How the Strategy works
This is developed based on SuperTrend.
Use two time frame for confirm all entry signals.
Two time frame SuperTrend works as Trailing stop for both long and short positions.
More securely execute orders, because it is wait until confine two time frames(example : daily and 30min)
Each time frame developed as customisable for user to any timeframe.
User can choose trading position side from Long, Short, and Both.
Custom Stop Loss level, user can enter Stop Loss percentage based on timeframe using.
Multiple Take Profit levels with customisable TP price percentage and position size.
Back-testing with custom time frame.
This strategy is develop for specially for automation purpose.
The strategy includes:
Entry for Long and Short.
Take Profit.
Stop Loss.
Trailing Stop Loss.
Position Size.
Exit Signal.
Risk Management Feature.
Backtesting.
Trading Alerts.
Use the strategy with alerts
This strategy is alert-ready. All you have to do is:
Go on a pair you would like to trade
Create an alert
Select the strategy as a Trigger
Wait for new orders to be sent to you
This is develop for specially for automating trading on any exchange, if you need to get that automating service for this strategy or any Tradingview strategy or indicator please contact me I am have 8 year experience on that field.
I hope you enjoy it!
Thanks,
Ranga

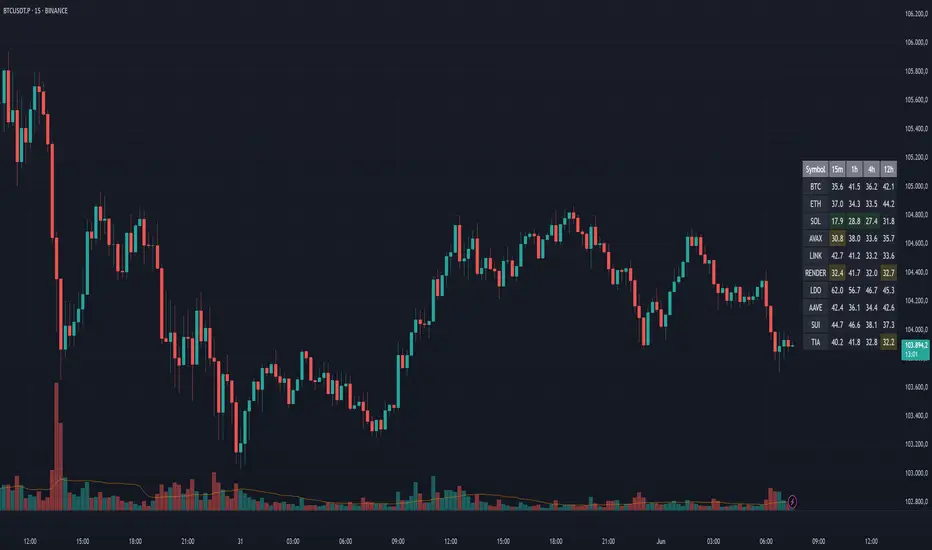
NYSE Market Sentiment Oscillator - Intraday w/ alertsThe ULTIMATE market sentiment indicator that combines the sentiments from the MARKET INTERNALS : $ADD ( NYSE $ADV minus $DECL ), $VOLD ( NYSE $UVOL minus $DVOL ) and $TICK ( NYSE Cumulative tick ). Sentiment is based on calculating the crossovers of moving average pairs for each of the market internals. As a result, 3 corresponding signal lines are generated + 1 combined Market Sentiment Oscillator (aka MSO) signal line.
**Important** This indicator is only meant to be used for intraday 1min-5 min timeframe only *** It may not function at higher timeframes without updating some moving average periods.
WHAT IS IT SHOWING?
Each signal lines represents the trend of the 3 market internals (TICK, ADD, VOLD). If signal line is above zero, it is in a bullish trend; below zero, bearish. The oscillating frequency of these lines are dependent on the length of moving average pairs of your choosing. A combined MSO signal line shows the combined trends of those 3 market internals, hence it represents real time market sentiment of the NYSE.
FEATURES
There are 2 display modes for this indicator:
1) On a separate pane
- in this mode, the signal lines can be toggled to oscillate along the zero line
2) On the price chart
- in this mode, the signal lines can be toggled to oscillate along the OHLC line of the price chart
- comes with Nadaraya-Watson Envelope and ATR bands
BUY/SELL SIGNALS AND STRATEGIES
By default, this indicator comes with two day trading strategies and offers long and short signals with alerts. These strategies attempts to leverage on the oscillating nature of market price movement on major NYSE indices, such as SPY, SPX, QQQ, NAS, all of which have high correlation with the market internals. However, please note that these signals offers no guarantee to profitability, so use at your own risk.
BACKGROUND COLORS SIGNIFYING TRENDS
There are options to display the background colors in 2 colors and shades.
1) Short-term sentiment
- Bright green = ADD / VOLD / TICK all in up trend
- Dimmed green = ADD / VOLD in up trend, but not TICK
- Bright red = ADD / VOLD / TICK all in down trend
- Dimmed red = ADD / VOLD in down trend, but not TICK
2) Trend Convergence
- Green = ADD / VOLD / TICK all bullish
- Red = ADD / VOLD / TICK all bearish
3) MSO
- Green = MSO bullish ( MSO signal line > 0 )
- Red = MSO bearish ( MSO signal line < 0 )
MARKET INTERNALS REAL-TIME DATA TABLE
A data table can be toggled on / off that shows the real-time sentiment and values of the three market internals. It may be useful in making quick trading decisions. The table cells are colored according to their corresponding trends.

[VTaL] Vertical Time Alert Lines - By BlueJayBird🦾 USE
- Vertical lines drawn ON TOP of chart at selected key times of the day, week, month, year.
- You can use it at any symbol (as far as I know).
- Programmatic alerts available.
- Lines from lower time-frames are selectively NOT visible at higher time-frames. Example: At 1h time-frame, vertical lines from 1h and 4h intervals are not visible. Drawing them is considered not really useful.
🎭 MAIN FEATURES
- Available targeted times: 3m, 15m, 1h, 4h, 1D, 1W, 1M, 1Y.
- Offset available for all lines. Example: 1 offset for 4h moves lines from 4AM to 8AM.
- Programmatic alerts for all lines. Example: If alert is enabled for 15m lines, every time those lines are reached, alert will trigger.
- Available drawing themes: Custom, Light, Dark.
💻 NOTES ON CODE
- Vertical lines are drawn using a custom function, which uses line.new() built-in function.
- Alerts are triggered using ta.cross() built-in function. Alert is triggered when close price crosses a given time value from the line.get_x1() built-in function.
- I've added, where necessary, several comments to the code for understanding what's going on. If you have additional questions, you may ask them in the comment section of the publication.
- 3m lines are not really useful in day-trading, they were added for debugging purposes mainly. Useful for learning how to use alerts, though.
👉🏼 NOTES ON ALERTS
- When setting up an alert, the targeted line must be enabled/visible.
- Every time any alert is enabled or disabled, you must create AGAIN the alert from the "Alerts" panel (remember, alerts run in the back-end).
- Alerts contain really useful information. If you have any idea for adding some other data, tell in the comment section. 💡
⚠️ KNOWN ISSUES
- None. Let me know please if you find any.
--------------------------------------------
~ Comment , Follow and Boost ~ 🚀

Crossover Alerts for Yesterday O/H/L/C , Today Vwap [Zero54]This is a very simple script/indicator that trigger alerts every time the script triggers the following conditions.
1) Script crosses yesterday's (previous day's) high
2) Script crosses yesterday's (previous day's) low
3) Script crosses yesterday's (previous day's) open
4) Script crosses yesterday's (previous day's) close
5) Script crosses today's vwap.
I developed this to keep track of the scripts I follow and I find it useful. Hope you will find it useful too.
Steps to use:
1) Open the ticker for which you want to set the alerts.
2) Add this indicator to the chart.
3) Right Click on the text and set choose "Add Alert"
4) After you have done with setting up the alert, feel free to remove the indicator from the chart. It is not necessary for the indicator to be added in the chart in order for it to work.
5) Repeat 1-4 for all the scripts for which you want to set the alerts.
Be advised: During market open, if you have set alerts for multiple scripts, a tsunami of alerts may be triggered.
If you like this alert indicator, please like/boost it. Feel free to re-use this code however you may wish to. Cheers!

DoubleRSI fast/slow signal buy/sell with alert Relative StrengthA combination of two Relative strength index. One fast and one slow line. In a system, this indicator can serve as an additional confirmation.
For example, for a long entry:
slow RSI cross above 50 level and fast RSI cross above 70 level. then check volume and use another indicator such as a MACD for extra confirmation
For example, for a short entry:
slow RSI cross below 50 and fast RSI cross below 30 level. then check volume and use another indicator such as a MACD for confirmation
An alarm function has also been added.
the following settings are possible:
- Source
- Length
- Color
I do not recommend to use this indicator alone.
have fun using this simple and helpful tool.

FrostyBotLibrary "FrostyBot"
JSON Alert Builder for FrostyBot.js Binance Futures and FTX orders
github.com
More Complete Version Soon.
TODO: Comment Functions and annotations from command reference ^^
TODO: Add additional whitelist and symbol mappings.
leverage()
buy()
sell()
cancelall()
closelong()
closeshort()
traillong()
trailshort()
long()
short()
takeprofit()
stoploss()

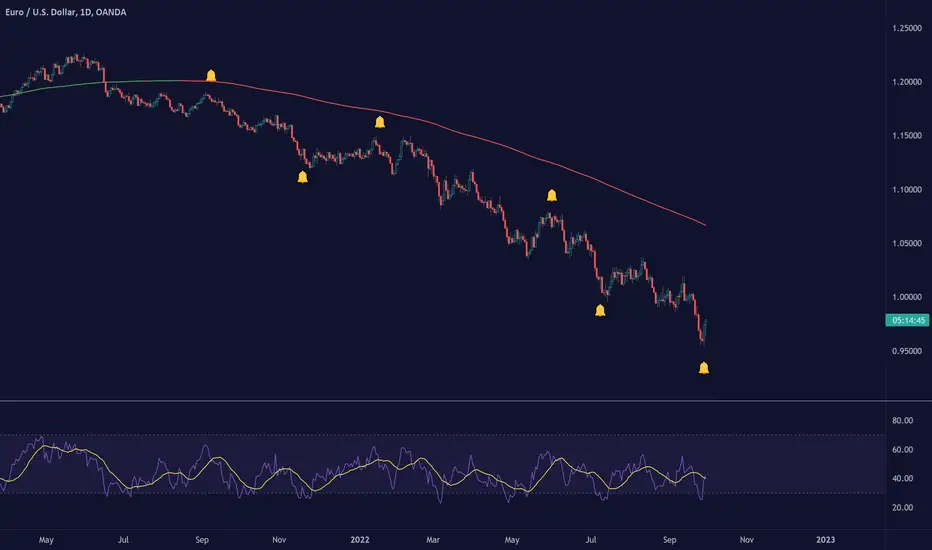
TradingView Alerts (Expo)█ Overview
The TradingView inbuilt alert feature inspires this alert tool.
TradingView Alerts (Expo) enables traders to set alerts on any indicator on TradingView, both public, protected, and invite-only scripts (if you are granted access). In this way, traders can set the alerts they want for any indicator they have access to. This feature is highly needed since many indicators on TradingView do not have the particular alert the trader looks for, this alert tool solves that problem and lets everyone create the alert they need. Many predefined conditions are included, such as "crossings," "turning up/down," "entering a channel," and much more.
█ TradingView alerts
TradingView alerts are a popular and convenient way of getting an immediate notification when the asset meets your set alert criteria. It helps traders to stay updated on the assets and timeframe they follow.
█ Alert table
Keep track of the average amount of alerts that have been triggered per day, per month, and per week. It helps traders to understand how frequently they can expect an alert to trigger.
█ Predefined alerts types
Crossing
The Crossing alert is triggered when the source input crosses (up or down) from the selected price or value.
Crossing Down / Crossing Up
The Crossing Down alert is triggered when the source input crosses down from the selected price or value.
The Crossing Up alert is triggered when the source input crosses up from the selected price or value.
Greater Than / Less Than
The Greater Than alert is triggered when the source input reaches the selected value or price.
The Less Than alert is triggered when the source input reaches the selected value or price.
Entering Channel / Exiting Channel
The Entering Channel alert is triggered when the source input enters the selected channel value.
The Exiting Channel alert is triggered when the source input exits the selected channel value.
Notice that this alert only works if you have selected "Channels."
Inside Channel / Outside Channel
The Inside Channel alert is triggered when the source input is within the selected Upper and Lower Channel boundaries.
The Outside Channel alert is triggered when the source input is outside the selected Upper and Lower Channel boundaries.
Notice that this alert only works if you have selected "Channels."
Moving Up / Moving Down
This alert is the same as "crossing up/down" within x-bars.
The Moving Up alert is triggered when the source input increases by a certain value within x-bars.
The Moving Down alert is triggered when the source input decreases by a certain value within x-bars.
Notice that you have to set the Number of Bars parameter!
The calculation starts from the last formed candlestick.
Moving Up % / Moving Down %
The Moving Up % alert is triggered when the source input increases by a certain percentage value within x-bars.
The Moving Down % alert is triggered when the source input decreases by a certain percentage value within x-bars.
Notice that you have to set the Number of Bars parameter!
The calculation starts from the last formed candlestick.
Turning Up / Turning Down
The Turning Up alert is triggered when the source input turns up.
The Turning Down alert is triggered when the source input turns down.
-----------------
Disclaimer
The information contained in my Scripts/Indicators/Ideas/Algos/Systems does not constitute financial advice or a solicitation to buy or sell any securities of any type. I will not accept liability for any loss or damage, including without limitation any loss of profit, which may arise directly or indirectly from the use of or reliance on such information.
All investments involve risk, and the past performance of a security, industry, sector, market, financial product, trading strategy, backtest, or individual's trading does not guarantee future results or returns. Investors are fully responsible for any investment decisions they make. Such decisions should be based solely on an evaluation of their financial circumstances, investment objectives, risk tolerance, and liquidity needs.
My Scripts/Indicators/Ideas/Algos/Systems are only for educational purposes!
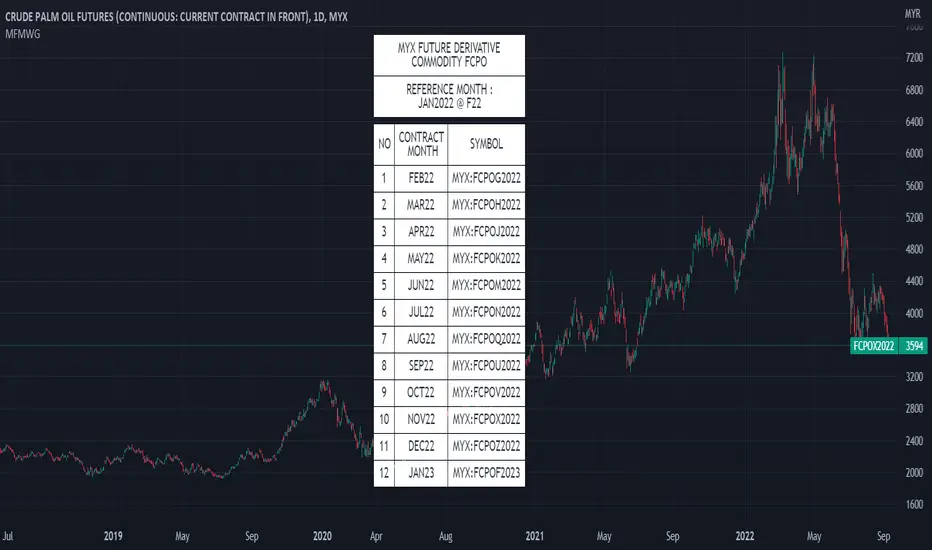
MYX Future Market Watchlist Generator█ OVERVIEW
This indicator listed all Future market in Malaysia and categorize them into Contract Month, Spread, Current Contract and Continuous Contract.
The indicator was developed to make user easier to make watchlist, suitable for beginners and experts in Malaysia Future Market.
This cover all Malaysia Future Markets as follows :
1. Commodity - FCPO, FPKO, FGLD, FTIN, FPOL and FUPO
2. Equity - FKLI and FM70
3. SSF - FCIM, FDRB, FGAM, FHAR, FINA, FMEG, FGEM, FGEN, FTEL and FTOP
4. Financial - FKB3, FMG3, FMG5 and FMGA
█ INSPIRATIONS
This indicator got inspirations from the previous indicators which I developed :
MYX Malaysia Bursa Futures Derivatives Auto Detect
FCPO Contract Month Table
█ CREDITS
I dedicated to known members in this industry especially who actively involved in Malaysia Future Market.
BURSATRENDBANDCHART
zhafrihandsome
XMODEUS
HAIDOJO_trading
datuksri
wrtech2020
FaizHebat
█ FEATURES
1. As mentioned in overview, main ability to categorize and export into watchlist.
2. Dark or light theme table including table position.
█ IMPORTANT NOTES
1. This indicator is one time usage only to generate watchlist through alert.
2. Use live chart to generate alert.
3. Set Alert Frequency to All.
4. Remove Alert once watchlist is done.
5. Usage method is similar to this video . (Sorry no audio provided)
█ EXAMPLE OF USAGE
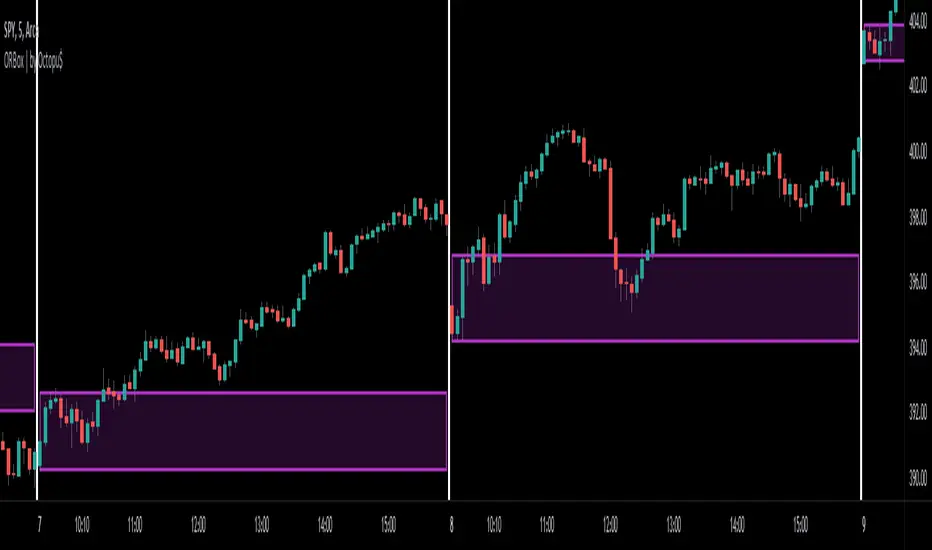
ORBox | by Octopu$📈 ORBox | by Octopu$
ORBox is a Box for the Opening Range Breakout
The Box is added automatically according to the User preferences through GUI
This Indicator includes a Dropdown selection for which Range for the Breakout you want to use
ORBox has built-in Alerts for when the Breakout happens according to your preferences
Works in any Timeframe with any Ticker
(Using SPY 5m just as an example:)
www.tradingview.com
SPY
Features:
• Opening Breakout Range (ORB)
• Dropdown menu selection to choose which TF to watch
• Built-in Alerts for Momentum Awareness
Options:
• Customization for Box Colors and Sizes
• Display ORB for Current Day or Previous
Notes:
v1.0
ORBox Indicator release
Changes and updates can come in the future for additional functionalities or per requests.
Did you like it? Shoot me a message! I'd appreciate if you dropped by to say thanks.
- Octopu$
🐙