Americana Crypto Retail FOMO IndexRetail FOMO Index
Overview
The Retail FOMO Index is a sentiment indicator designed to help identify when retail investors are piling into the crypto market — often a sign that the market may be approaching overheated conditions. Historically, periods of extreme retail enthusiasm have coincided with local and macro tops, making this a useful tool for gauging market temperature.
What It Measures
This indicator combines two real-time data sources to create a composite "FOMO score" scaled from 0 to 100:
Coinbase Premium (50% weight)
This measures the price difference between Bitcoin on Coinbase (USD) and Binance (USDT). When US retail investors are aggressively buying, Coinbase often trades at a premium to other exchanges. A rising premium suggests increased retail demand, while a negative premium can indicate selling pressure or reduced interest.
Coinbase Stock Volume (50% weight)
This tracks the trading volume of COIN (Coinbase's stock on NASDAQ) relative to its recent average. When retail interest in crypto surges, Coinbase stock volume tends to spike as both crypto traders and traditional investors react to market momentum. The indicator calculates a Z-score to identify when volume is unusually high or low compared to its norm.
Settings
The indicator includes adjustable parameters:
Weights: Adjust the balance between Coinbase Premium and COIN Volume if you find one component more relevant
Lookback Period: Controls how much historical data is used for normalization (default: 50 periods)
Smoothing: Reduces noise in the final output (default: 7 periods)
Threshold Levels: Customize the boundaries for each zone
Display Options: Toggle component lines and background fills on/off
Important Notes
The COIN volume data begins in April 2021 (Coinbase IPO), so the indicator does not have data prior to that date
The Coinbase Premium is calculated using BTC regardless of what asset chart you apply it to — BTC tends to be the leading indicator for broad retail sentiment
This indicator works best on daily, weekly, and monthly timeframes
This is a sentiment tool, not a trade signal — use it alongside your existing analysis to add context
Razão Avanço/Declínio

5% Move Counter (Up vs Down)5% Move Counter (Up vs Down)
This indicator tracks how many times a stock has made a 5% or larger move in a single session, and shows the count separately for up days and down days. It’s meant for traders who want quick context on whether a stock has a history of making large moves, instead of manually scrolling through years of price action.
Most tools only tell you what’s happening right now. This one helps you understand what the stock is capable of.
What it shows
Number of 5%+ up days
Number of 5%+ down days
Optional display modes:
All
Up Only
Down Only
Why it’s useful
Different stocks behave differently. Some give clean, powerful bursts when they break out, while others rarely move big even when the setup looks perfect. This tool helps you gauge a stock’s historical “explosiveness” so you can decide whether your strategy fits its behavior.
If your setups depend on volatility or momentum, it helps to know whether the stock has produced big moves before. This gives you that information instantly.
Customization
You can place the stats box anywhere on the chart using a simple 1–9 selector.
You can hide the rows you don’t need through a dropdown.
When a row is hidden, its background becomes fully transparent so the chart stays clean.
Who it’s for
Short-term traders, breakout traders, swing traders, and anyone who wants a quick read on whether a stock moves enough to justify certain types of trades.

WMA SupertrendVWMA Supertrend for identifying good entry points
Divides the slow VWMA and fast VWMA and multiplies by the close price to give a mountain-style price showing possible entries.

US Market Breadth Rhythm OscillatorThis tool is a market-breadth oscillator built on the core concepts of Fosback’s Relative Breadth , enhanced with proprietary calculations, cyclic smoothing, and adaptive rhythm-based bands. Instead of reacting to price, the oscillator measures the internal “calmness” or “loudness” of the U.S. stock market by analyzing the relative imbalance between advancing and declining issues.
High oscillator readings indicate a calm, quiet internal market—a state where daily breadth fluctuations are small and orderly. These calm conditions frequently appear near market tops.
Low oscillator readings reflect a loud, volatile internal market—a period with strong breadth imbalances in either direction. Such “noisy” conditions are typically associated with market lows.
Usage and interpretation
The oscillator also features dynamic cyclic bands that breathe with market rhythm. These shifting upper and lower bands help highlight potential turning points:
A drop down through the upper band may suggest a developing market top.
A rise up through the lower band may signal a positive shift in market dynamics that often precedes an upswing.
Overall, this tool helps visually identify calm/top conditions, loud/bottom conditions, and possible shifts in market trend by combining enhanced Fosback breadth analysis with adaptive cyclic calculations.
It can be used to visualize potential market extremes and market exhaustions on US main indices. So pick a main US stock market index as price chart and add the market breadth rhythm based on the selected market internals.
However, it is not meant as swing trading system on its own. It is an oscillator which allows to identify extreme market internals which are often in alignment with major changes in trend of the price index.
Examples:
The top key image shows the indicator on a 2h Dow Jones Index price chart during the upswing phase from April to December 2025. The following image showcases the indicator for a longer period from 2022 to 2025 on a daily chart of the Dow Jones Index:
Parameter:
Select the market breadth sources that should be used for the calculation. You can choose between the following breadth sources:
Dow Jones
Nasdaq
New York Stock Exchange
Composite
The Composite selection will create all 3 series and create a merged composite US Breadth Rhythm indicator as result.
The arrows on the price chart visualize directly on the price chart when the indicator crosses below or above the dynamic bands.
Recommended usage:
Open an Dow Jones, Nasdaq, Russel 2000 or New York Stock Exchange Index. Use 1 Day, 4h or 2h timeframe. Add the indicator and choose the market breadth for oscillator readings.
Note:
This oscillator is calculated entirely from market breadth metrics, not from the chart’s price. You can select NASDAQ, Dow Jones, or NYSE breadth (advancers/decliners) as the internal data source.
Script pago

Nifty Participants - Top 10 📌 Nifty Participants – Top 10 (Indicator Description)
This indicator displays the top 10 weighted stocks from the NIFTY index and shows how each stock is contributing to the index movement in real time.
For each participant, the script calculates price change, percentage change, RSI, VWAP position, volume spike, previous day levels, and their estimated participation based on weightage.
A dynamic table is plotted on the chart with color-coded cells for bullish, bearish, and neutral conditions. Users can customize which columns to display (LTP, Change, Change %, Share, RSI, VWAP, Volume Spike, Previous Day High/Low) and select the timeframe for calculations. The index itself appears as the first row for quick comparison.
Volume spikes are highlighted when current volume exceeds a configurable multiple of the average volume. RSI and VWAP columns also use adaptive coloring to quickly show strength or weakness.
All weightages are user-editable, and the table automatically limits output to the selected number of rows. This makes it an ideal real-time market breadth and contribution tracker for intraday and positional traders.

EMA Velocity Dual TF Momentum 1h (v2)BINANCE:SOLUSDT
The result is calculated on futures x10
### EMA Velocity Dual TF Momentum (v2) – Public Description
**Overview**
EMA Velocity Dual TF Momentum (v1) is a trend-following momentum strategy that uses the *speed of change* of Exponential Moving Averages (EMA) on two timeframes: the chart timeframe 1h.
The strategy looks for moments when both timeframes point in the same direction and the short‑term momentum is significantly stronger than usual, then manages trades with configurable ATR filtering, stop‑loss / take‑profit and early exit logic.
---
### Core Idea (high level, without formulas)
- On the **lower timeframe** (LTF), the strategy tracks how fast the EMA is moving (its “velocity”) and detects **impulse bars** where this velocity is unusually strong compared to its recent history.
- On the **higher timeframe** (HTF), it also measures EMA velocity and requires that the HTF trend direction is **aligned** with the LTF (both bullish or both bearish), if enabled.
- A **long trade** is opened when:
- LTF EMA velocity is positive (upward momentum),
- LTF momentum is strong enough (impulse),
- HTF EMA velocity is also upwards (if HTF filter is enabled),
- and ATR‑based volatility is above the minimum threshold.
- A **short trade** is opened in the symmetric situation (downward momentum on both timeframes).
- Positions are closed using configurable stop‑loss and take‑profit, and can be partially exited, moved to break‑even and trailed using early‑exit options.
---
### Inputs and Parameters
#### Trend & Momentum (Lower Timeframe)
- **`LTF EMA length (emaLenLTF)`**
Length of the EMA on the chart timeframe used to measure short‑term trend and momentum. Smaller values react faster; larger values are smoother and slower.
- **`LTF velocity lookback (velKLTF)`**
Lookback for computing EMA “velocity” on LTF. Controls how sensitive the momentum calculation is to recent price changes.
- **`LTF impulse lookback bars (impLookback)`**
Window size used to estimate the “normal” average absolute velocity. The strategy compares current momentum against this baseline to detect strong impulse moves.
- **`LTF |velocity| multiplier vs average (impMult)`**
Multiplier for defining what counts as a strong impulse. Higher values = fewer but stronger signals; lower values = more frequent, weaker impulses.
#### Trend & Momentum (Higher Timeframe)
- **`Use higher timeframe alignment (useHTF)`**
If enabled, trades are only taken when the higher‑timeframe EMA velocity confirms the same direction as the lower timeframe.
- **`HTF timeframe (htf_tf)`**
Higher timeframe used for confirmation (e.g. 60 minutes). Defines the “macro” context above the chart timeframe.
- **`HTF EMA length (emaLenHTF)`**
Length of the EMA on the higher timeframe. Controls how smooth and slow the higher‑timeframe trend filter is.
- **`HTF velocity lookback (velKHTF)`**
Lookback for the EMA velocity on HTF. Smaller values react quicker to changes in the higher‑timeframe trend.
#### Volatility / ATR Filter
- **`Use ATR filter (useAtrFilter)`**
Enables a volatility filter based on Average True Range. When active, trades are allowed only if market volatility is not too low.
- **`ATR Period (atrPeriod)`**
Lookback period for ATR calculation. Shorter periods react faster to recent volatility shifts; longer ones are more stable.
- **`ATR Min % for trading (atrMinPerc)`**
Minimum ATR as a percentage of price required to trade. Filters out very quiet, choppy periods where the strategy is more likely to be whipsawed.
#### Risk Management
- **`Use stops (SL/TP) (useStops)`**
Enables fixed stop‑loss and take‑profit exits. If disabled, positions are managed only by early exit logic and manual closing.
- **`Stop Loss % (stopLossPerc)`**
Distance of the protective stop from entry, in percent. Higher values give trades more room but increase risk per trade.
- **`Take Profit % (takeProfitPerc)`**
Distance of the primary profit target from entry, in percent. Controls the reward‑to‑risk profile of each trade.
#### Early Exit / Break‑Even / Trailing
- **`Enable early exit module (useEarlyExit)`**
Master switch for all early exit features: partial profit taking, break‑even stops and trailing exits.
- **`Take partial profit at +% (close 50%) (partialTP)`**
Profit level (in %) at which the strategy closes a partial portion of the position (e.g. 50%), locking in gains while leaving a runner.
- **`Trailing TP distance (%) (trailTP)`**
Distance (in %) for dynamic trailing stop after entry. When positive, the strategy trails the price to protect profits as the move extends.
- **`Break-even stop after +% profit (useBreakEven)`**
Enables automatic move of the stop to the entry price once a certain profit threshold is reached.
- **`Break-even activation (+%) (breakEvenPerc)`**
Profit level (in %) at which the stop is moved to break‑even. Higher values require a larger unrealized profit before break‑even protection kicks in.
#### Visuals
- **`Show labels (showLabels)`**
Toggles on‑chart labels that mark long and short entry signals for easier visual analysis.
- **`Label offset (labelOffset)`**
Horizontal offset (in bars) for placing labels relative to the signal bar. Used only for visual clarity; does not affect trading logic.
---
Если нужно, могу на основе этого текста сразу подготовить компактную версию (ограниченную по символам) специально под поле описания публичного скрипта в TradingView.

EMA Velocity Volatility Clamp (v1)A strategy based on the rate of price change using EMA.
Configured for the 5M Solana.
BINANCE:SOLUSDT

Multi-Strategy XAUUSD 2mKy është një indikator i avancuar shumë-strategjik për XAUUSD, i dizajnuar për scalping në intervale të shkurtra (2-5 minuta).
Përfshin kombinim të strukturës së tregut, volumit, dhe price action, për të gjeneruar sinjale të sakta për hyrje në treg.
Përdoruesi mund të aktivizojë ose çaktivizojë secilën strategji nga paneli i kontrollit.
Ky mjet është vetëm për qëllime edukative — nuk përbën këshillë financiare.
This is a highly advanced multi-strategy indicator for XAUUSD, designed for scalping on short timeframes (2-5 minutes).
It combines market structure, volume analysis, and price action to generate accurate trade entry signals.
Users can enable or disable each strategy individually from the control panel.
This tool is intended for educational purposes only and does not constitute financial advice.

ADR Color CodedAbove 1 is green, below 1 is red.
Color coded to provide better visibilty when identifying divergences with volume and price

ALISH WEEK LABELS THE ALISH WEEK LABELS
Overview
This indicator programmatically delineates each trading week and encapsulates its realized price range in a live-updating, filled rectangle. A week is defined in America/Toronto time from Monday 00:00 to Friday 16:00. Weekly market open to market close, For every week, the script draws:
a vertical start line at the first bar of Monday 00:00,
a vertical end line at the first bar at/after Friday 16:00, and
a white, semi-transparent box whose top tracks the highest price and whose bottom tracks the lowest price observed between those two temporal boundaries.
The drawing is timeframe-agnostic (M1 → 1D): the box expands in real time while the week is open and freezes at the close boundary.
Time Reference and Session Boundaries
All scheduling decisions are computed with time functions called using the fixed timezone string "America/Toronto", ensuring correct behavior across DST transitions without relying on chart timezone. The start condition is met at the first bar where (dayofweek == Monday && hour == 0 && minute == 0); on higher timeframes where an exact 00:00 bar may not exist, a fallback checks for the first Monday bar using ta.change(dayofweek). The close condition is met on the first bar at or after Friday 16:00 (Toronto), which guarantees deterministic closure on intraday and higher timeframes.
State Model
The indicator maintains minimal persistent state using var globals:
week_open (bool): whether the current weekly session is active.
wk_hi / wk_lo (float): rolling extrema for the active week.
wk_box (box): the graphical rectangle spanning × .
wk_start_line and a transient wk_end_line (line): vertical delimiters at the week’s start and end.
Two dynamic arrays (boxes, vlines) store object handles to support bounded history and deterministic garbage collection.
Update Cycle (Per Bar)
On each bar the script executes the following pipeline:
Start Check: If no week is open and the start condition is satisfied, instantiate wk_box anchored at the current bar_index, prime wk_hi/wk_lo with the bar’s high/low, create the start line, and push both handles to their arrays.
Accrual (while week_open): Update wk_hi/wk_lo using math.max/min with current bar extremes. Propagate those values to the active wk_box via box.set_top/bottom and slide box.set_right to the current bar_index to keep the box flush with live price.
Close Check: If at/after Friday 16:00, finalize the week by freezing the right edge (box.set_right), drawing the end line, pushing its handle, and flipping week_open false.
Retention Pruning: Enforce a hard cap on historical elements by deleting the oldest objects when counts exceed configured limits.
Drawing Semantics
The range container is a filled white rectangle (bgcolor = color.new(color.white, 100 − opacity)), with a solid white border for clear contrast on dark or light themes. Start/end boundaries are full-height vertical white lines (y1=+1e10, y2=−1e10) to guarantee visibility across auto-scaled y-axes. This approach avoids reliance on price-dependent anchors for the lines and is robust to large volatility spikes.
Multi-Timeframe Behavior
Because session logic is driven by wall-clock time in the Toronto zone, the indicator remains consistent across chart resolutions. On coarse timeframes where an exact boundary bar might not exist, the script legally approximates by triggering on the first available bar within or immediately after the boundary (e.g., Friday 16:00 occurs between two 4-hour bars). The box therefore represents the true realized high/low of the bars present in that timeframe, which is the correct visual for that resolution.
Inputs and Defaults
Weeks to keep (show_weeks_back): integer, default 40. Controls retention of historical boxes/lines to avoid UI clutter and resource overhead.
Fill opacity (fill_opacity): integer 0–100, default 88. Controls how solid the white fill appears; border color is fixed pure white for crisp edges.
Time zone is intentionally fixed to "America/Toronto" to match the strategy definition and maintain consistent historical backtesting.
Performance and Limits
Objects are reused only within a week; upon closure, handles are stored and later purged when history limits are exceeded. The script sets generous but safe caps (max_boxes_count/max_lines_count) to accommodate 40 weeks while preserving Editor constraints. Per-bar work is O(1), and pruning loops are bounded by the configured history length, keeping runtime predictable on long histories.
Edge Cases and Guarantees
DST Transitions: Using a fixed IANA time zone ensures Friday 16:00 and Monday 00:00 boundaries shift correctly when DST changes in Toronto.
Weekend Gaps/Holidays: If the market lacks bars exactly at boundaries, the nearest subsequent bar triggers the start/close logic; range statistics still reflect observed prices.
Live vs Historical: During live sessions the box edge advances every bar; when replaying history or backtesting, the same rules apply deterministically.
Scope (Intentional Simplicity)
This tool is strictly a visual framing indicator. It does not compute labels, statistics, alerts, or extended S/R projections. Its single responsibility is to clearly present the week’s realized range in the Toronto session window so you can layer your own execution or analytics on top.

Niveles Históricos + EMA 200 (zoom fijo) by flavexIndicador estrategia minimos y maximos diarios de 4 h. muestra ema 200 suavizada.

RSI ROC Signals with Price Action# RSI ROC Signals with Price Action
## Overview
The RSI ROC (Rate of Change) Signals indicator is an advanced momentum-based trading system that combines RSI velocity analysis with price action confirmation to generate high-probability buy and sell signals. This indicator goes beyond traditional RSI analysis by measuring the speed of RSI changes and requiring price confirmation before triggering signals.
## Core Concept: RSI Rate of Change (ROC)
### What is RSI ROC?
RSI ROC measures the **velocity** or **acceleration** of the RSI indicator, providing insights into momentum shifts before they become apparent in traditional RSI readings.
**Formula**: `RSI ROC = ((Current RSI - Previous RSI) / Previous RSI) × 100`
### Why RSI ROC is Superior to Standard RSI:
1. **Early Momentum Detection**: Identifies momentum shifts before RSI reaches traditional overbought/oversold levels
2. **Velocity Analysis**: Measures the speed of momentum changes, not just absolute levels
3. **Reduced False Signals**: Filters out weak momentum moves that don't sustain
4. **Dynamic Thresholds**: Adapts to market volatility rather than using fixed RSI levels
5. **Leading Indicator**: Provides earlier signals compared to traditional RSI crossovers
## Signal Generation Logic
### 🟢 Buy Signal Process (3-Stage System):
#### Stage 1: Trigger Activation
- **RSI ROC** > threshold (default 7%) - RSI accelerating upward
- **Price ROC** > 0 - Price moving higher
- Records the **trigger high** (highest point during trigger)
#### Stage 2: Invalidation Check
- Signal invalidated if **RSI ROC** drops below negative threshold
- Prevents false signals during momentum reversals
#### Stage 3: Confirmation
- **Price breaks above trigger high** - Price action confirmation
- **Current candle is green** (close > open) - Bullish price action
- **State alternation** - Ensures no consecutive duplicate signals
### 🔴 Sell Signal Process (3-Stage System):
#### Stage 1: Trigger Activation
- **RSI ROC** < negative threshold (default -7%) - RSI accelerating downward
- **Price ROC** < 0 - Price moving lower
- Records the **trigger low** (lowest point during trigger)
#### Stage 2: Invalidation Check
- Signal invalidated if **RSI ROC** rises above positive threshold
- Prevents false signals during momentum reversals
#### Stage 3: Confirmation
- **Price breaks below trigger low** - Price action confirmation
- **Current candle is red** (close < open) - Bearish price action
- **State alternation** - Ensures no consecutive duplicate signals
## Key Features
### 🎯 **Smart Signal Management**
- **State Alternation**: Prevents signal clustering by alternating between buy/sell states
- **Trigger Invalidation**: Automatically cancels weak signals that lose momentum
- **Price Confirmation**: Requires actual price breakouts, not just momentum shifts
- **No Repainting**: Signals are confirmed and won't disappear or change
### ⚙️ **Customizable Parameters**
#### **RSI Length (Default: 14)**
- Standard RSI calculation period
- Shorter periods = more sensitive to price changes
- Longer periods = smoother, less noisy signals
#### **Lookback Period (Default: 1)**
- Period for ROC calculations
- 1 = compares to previous bar (most responsive)
- Higher values = smoother momentum detection
#### **RSI ROC Threshold (Default: 7%)**
- Minimum RSI velocity required for signal trigger
- Lower values = more signals, potentially more noise
- Higher values = fewer but higher-quality signals
### 📊 **Visual Signals**
- **Green Arrow Up**: Buy signal below price bar
- **Red Arrow Down**: Sell signal above price bar
- **Clean Chart**: No additional lines or oscillators cluttering the view
- **Size Options**: Customizable arrow sizes for visibility preferences
## Advantages Over Traditional Indicators
### vs. Standard RSI:
✅ **Earlier Signals**: Detects momentum changes before RSI reaches extremes
✅ **Dynamic Thresholds**: Adapts to market conditions vs. fixed 30/70 levels
✅ **Velocity Focus**: Measures momentum speed, not just position
✅ **Better Timing**: Combines momentum with price action confirmation
### vs. Moving Average Crossovers:
✅ **Leading vs. Lagging**: RSI ROC is forward-looking vs. backward-looking MAs
✅ **Volatility Adaptive**: Automatically adjusts to market volatility
✅ **Fewer Whipsaws**: Built-in invalidation logic reduces false signals
✅ **Momentum Focus**: Captures acceleration, not just direction changes
### vs. MACD:
✅ **Price-Normalized**: RSI ROC works consistently across different price ranges
✅ **Simpler Logic**: Clear trigger/confirmation process vs. complex crossovers
✅ **Built-in Filters**: Automatic signal quality control
✅ **State Management**: Prevents over-trading through alternation logic
## Trading Applications
### 📈 **Trend Following**
- Use in trending markets to catch momentum continuations
- Combine with trend filters for directional bias
- Excellent for breakout strategies
### 🔄 **Swing Trading**
- Ideal timeframes: 4H, Daily, Weekly
- Captures major momentum shifts
- Perfect for position entries/exits
### ⚡ **Scalping (Advanced Users)**
- Lower timeframes: 1m, 5m, 15m
- Reduce threshold for more frequent signals
- Combine with volume confirmation
### 🎯 **Momentum Strategies**
- Perfect for momentum-based trading systems
- Identifies acceleration phases in trends
- Complements breakout and continuation patterns
## Optimization Guidelines
### **Conservative Settings (Lower Risk)**
- RSI Length: 21
- ROC Threshold: 10%
- Lookback: 2
### **Standard Settings (Balanced)**
- RSI Length: 14 (default)
- ROC Threshold: 7% (default)
- Lookback: 1 (default)
### **Aggressive Settings (Higher Frequency)**
- RSI Length: 7
- ROC Threshold: 5%
- Lookback: 1
## Best Practices
### 🎯 **Entry Strategy**
1. Wait for signal arrow confirmation
2. Consider market context (trend, support/resistance)
3. Use proper position sizing based on volatility
4. Set stop-loss below/above trigger levels
### 🛡️ **Risk Management**
1. **Stop Loss**: Place beyond trigger high/low levels
2. **Position Sizing**: Use 1-2% risk per trade
3. **Market Context**: Avoid counter-trend signals in strong trends
4. **Time Filters**: Consider avoiding signals near major news events
### 📊 **Backtesting Recommendations**
1. Test on multiple timeframes and instruments
2. Analyze win rate vs. average win/loss ratio
3. Consider transaction costs in backtesting
4. Optimize threshold values for different market conditions
## Technical Specifications
- **Pine Script Version**: v6
- **Signal Type**: Non-repainting, confirmed signals
- **Calculation Basis**: RSI velocity with price action confirmation
- **Update Frequency**: Real-time on bar close
- **Memory Management**: Efficient state tracking with minimal resource usage
## Ideal For:
- **Momentum Traders**: Captures acceleration phases
- **Swing Traders**: Medium-term position entries/exits
- **Breakout Traders**: Confirms momentum behind breakouts
- **System Traders**: Mechanical signal generation with clear rules
This indicator represents a significant evolution in momentum analysis, combining the reliability of RSI with the precision of rate-of-change analysis and the confirmation of price action. It's designed for traders who want sophisticated momentum detection with built-in quality controls.

SOL Dashboard v6 — Investor / Swing / Scalp (VWAP, ATR, RS (SCP)
**SOL Dashboard v6 — Investor / Swing / Scalp (VWAP, ATR, RSI, BTC\Ð influence, noise-filters)**
**In short:** a universal indicator for SOLUSDT (Spot/Futures), combining three analysis horizons — Investor (D1), Swing (H1/H4), and Scalp (5m/3m/1m) — in a single script. It provides clean signals (arrows), a summary table of layer states, alerts, as well as a set of noise filters (VWAP/RSI/volume/EMA “gap”/candle body requirement/cooldown). Optional BTC/ETH trend influence filters are available. Suitable for both spot and futures.
---
### What the indicator does
**Investor (HTF, default D1):** market background. EMA(50/200) → defines long-term phase (BULL/BEAR/NEUTRAL).
**Swing (MTF, default H1):** medium-term direction. EMA(20/50) + weekly VWAP (option).
**Scalp (LTF, default 5m):** quick entries. EMA(9/21) → SCALP BUY/SELL arrows strictly at the crossover candle, plus filters.
---
### Visual elements
* EMA lines for each layer (toggled on/off).
* VWAP lines: daily (scalp filter) and weekly (swing filter).
* SCALP BUY / SCALP SELL arrows (optional).
* Table in the top-right corner: Investor/Swing/Scalp modes and hints (including BTC/ETH states if influence is enabled).
* (Optional) Debug label — shows which filter is blocking the signal (RSI/VWAP/GAP/BODY/VOL/AGREE/CD).
---
### Signals (arrow logic)
**Base trigger:** crossover(EMA Fast, EMA Slow) on bar close (default EMA9/21 for LTF).
Arrows appear only if confirmations are met:
1. EMA slope matches signal (both rising for BUY / both falling for SELL).
2. Candle closed on the “correct” side of both EMAs (above/below).
3. Noise filters (toggleable/configurable):
* VWAP (daily): BUY only above VWAP; SELL only below.
* RSI(14): BUY if RSI>50; SELL if RSI<50.
* EMA-Gap (%): minimum difference between Fast/Slow EMAs (avoids micro-crossovers in chop).
* Body ratio: minimum body-to-range ratio (filters out dojis/wicks).
* Volume filter: volume ≥ median over N bars (default 20).
* Cooldown: minimum bars between same-direction signals.
4. Trend agreement (optional): requires alignment with Swing and BTC/ETH Swing modes.
**Result:** an arrow appears at the crossover only if all active filters are satisfied.
---
### Alerts
* **SCALP BUY (filtered):** “ETH/SOL scalp BUY (cross-confirmed)”
* **SCALP SELL (filtered):** “ETH/SOL scalp SELL (cross-confirmed)”
* (Optional) EXIT signals (if included in your build): exit on opposite side of EMA25 or VWAP.
---
### BTC/ETH influence (optional)
* Toggleable trend filters:
* Script checks BTCUSDT and/or ETHUSDT Swing states (EMA20/50 on H1/H4).
* BUY only if BTC/ETH are in BULL and SOL(H1) is BULL.
* SELL only if all corresponding Swing modes are BEAR.
This increases accuracy in trending markets (can be disabled in chop if you want more entries).
---
### Recommended presets
**1) Conservative (cleaner, less noise):**
* LTF = 5m (or 3m); EMA 9/21
* VWAP daily: ON, RSI: ON
* minEmaGapPct: 0.12–0.14%
* minBodyRatio: 0.60–0.70
* cooldownBars: 7–10
* BTC/ETH agreement: ON
* confirmBars: 1 (or 0 in trends)
**2) Base (balanced):**
* LTF = 5m; EMA 9/21
* VWAP: ON, RSI: ON
* minEmaGapPct: 0.08–0.12%
* minBodyRatio: 0.55–0.65
* cooldownBars: 5–7
* BTC/ETH agreement: ON in trend / OFF in chop
* confirmBars: 0 (or 1 in chop)
**3) Aggressive (more entries):**
* LTF = 3m or 1m; EMA 7/14 (or 7/25 if enabled)
* VWAP: ON, RSI: ON
* minEmaGapPct: 0.06–0.08%
* minBodyRatio: 0.50
* cooldownBars: 3–5
* BTC/ETH agreement: OFF in chop
* confirmBars: 0 (or 1 if too many false signals)
---
### How to read the summary table
* **Investor (D1):** EMA50 vs EMA200 → BULL/BEAR/NEUTRAL.
* **Swing (H1/H4):** EMA20 vs EMA50 (+ W-VWAP) → trade direction.
* **Scalp (LTF):** EMA Fast vs EMA Slow → short-term phase.
* **BTC / ETH (Swing):** their states (if influence enabled).
👉 Alignment of Investor + Swing + Scalp in one direction = maximum trend strength.
👉 Disagreement = reduce position size / wait for confirmation.
---
### Practical application
* **Entries:** SCALP arrows in Swing direction (and optionally BTC/ETH) + above/below VWAP.
* **Stops:** recommended ATR(14, LTF) × 1.6–2.0 (or beyond EMA21/EMA25).
* **Targets:** at least 1.8–2.2 R, take 30–50% at +1R, leave remainder as trailing (EMA9/EMA25/VWAP).
* **Trend filter:** trade longs mainly when price > daily VWAP and Swing = BULL (and vice versa).
---
### Settings (key parameters)
* Independent TFs for Investor / Swing / Scalp.
* EMA Fast/Slow set separately for each layer.
* VWAP (Daily/Weekly) as toggleable filters.
* RSI filter (BUY >50 / SELL <50).
* Noise filters: EMA-Gap, Body ratio, Volume ≥ median, Cooldown.
* Trend agreement: BTC/ETH Swing + SOL Swing.
* Debug mode: shows which filter is blocking a signal.
---
### FAQ
**Why no arrows when “crossover is visible”?**
Because arrows are plotted on bar close only if all active filters (VWAP/RSI/GAP/BODY/VOL/AGREE/CD) are satisfied. Enable Debug to see which filter blocks the signal.
**When to enable BTC/ETH influence?**
In trending markets → ON (accuracy ↑). In chop, if you want more entries → OFF.
**Works on Spot/Futures?**
Yes. But remember: futures fees are charged on position notional, not margin — factor this into risk management.
---
### Disclaimer
This is a research tool. Not financial advice. Trading crypto assets and derivatives carries high risk (especially with leverage). Always use stop-losses and manage risk per trade.
---
\#SOL #SOLUSDT #Scalping #Swing #Investor #VWAP #EMA #RSI #ATR #Crypto #Futures #NoiseFilters #BTCInfluence #ETHInfluence #TrendFilter #TradingView


Portfolio Average Line - XDDThis indicator is used to compare a ticker to different portfolios.
You can use up to 10 tickers in a portfolio, and have up to 6 portfolios at a time.
There are 2 averaging methods:
1. Checked Box: each tickers percentage is added up, then the average is displayed
2. Unchecked Box: each tickers price is added up, then the average is displayed
Good luck trading!

Turtle Body Setup by TradeTech AnalysisOverview
Turtle Body Setup is a minimalist, rules-based pattern detector built around a simple idea: a sequence of shrinking candle bodies (compression) often precedes a directional expansion (breakout). The script identifies those compression phases and then flags the first candle whose body expands significantly beyond the recent average, with polarity taken from the candle’s direction.
This is not a mash-up of many public indicators. It focuses on one original micro-structure concept: strict body-contraction → body-expansion . The logic is fully described below so traders and moderators can understand what it does and how to use it.
How it Works
1. Compression detection (body contraction):
• Over a user-defined window Compression Lookback (N), the script counts strictly shrinking candle bodies (|close-open|).
• When the count ≥ Min Shrinking Candles, we mark the market as in compression.
2. Expansion / Breakout qualification:
• Compute avgBody = SMA(body, N).
• A candle is a breakout when current body > avgBody × Breakout Body Multiplier.
• Polarity: green (close>open) → Bullish breakout; red (close

S&P 500 Weighted Advance Decline LineS&P 500 Weighted Advance Decline Line Indicator
Overview
This indicator creates a market cap weighted advance/decline line for the S&P 500 that tracks breadth based on actual index weights rather than treating all stocks equally. By weighting each stock's contribution according to its true S&P 500 impact, it provides more accurate market breadth analysis and better insights into underlying market strength and potential turning points.
Key Features
Market Cap Weighted: Each stock contributes based on its actual S&P 500 weight
Top 40 Stocks: Covers ~51% of the index with the largest companies
(limited by TradingView's 40 security call maximum for Premium accounts)
Real-Time Updates: Cumulative line shows long-term breadth trends
Visual Indicators: Background coloring, moving average option, and data table
Stock Coverage
Sector Breakdown:
Technology (29.8%) - Dominates the coverage as expected
Financials (5.8%) - Major banking and payment companies
Consumer/Retail (3.7%) - Consumer staples and retail giants
Healthcare (3.2%) - Pharma and healthcare services
Communication (1.97%) - Telecom and tech services
Energy (1.35%) - Oil and gas majors
Industrial (0.9%) - Aerospace and industrial equipment
Other Sectors (4.6%) - Miscellaneous including software and payments
Includes the 40 largest S&P 500 companies by weight, featuring:
Tech Leaders (29.8%): AAPL (7.0%), MSFT (6.5%), NVDA (4.5%), AMZN (3.5%), META (2.5%), GOOGL/GOOG (3.8%), AVGO (1.5%), ORCL (1.22%), AMD (0.51%), plus others
Financials (5.8%): BRK.B (1.8%), JPM (1.2%), V (1.0%), MA (0.8%), BAC (0.63%), WFC (0.46%)
Healthcare (3.2%): LLY (1.2%), UNH (1.2%), JNJ (1.1%), ABBV (0.8%), PG (0.9%)
Consumer/Retail (3.7%): WMT (0.8%), HD (0.8%), COST (0.7%), KO (0.6%), PEP (0.6%), NKE (0.4%)
Communication (1.97%): TMUS (0.47%), CSCO (0.47%), DIS (0.5%), CRM (0.5%)
Energy** (1.35%): XOM (0.8%), CVX (0.55%)
Industrial** (0.9%): GE (0.5%), BA (0.4%)
Other Sectors (4.6%): PLTR (0.65%), ADBE (0.6%), PYPL (0.3%), plus others
How to Interpret
Trend Signals
Rising A/D Line: Broad market strength, more weighted buying than selling
Falling A/D Line: Market weakness, more weighted selling pressure
Flat A/D Line: Balanced market conditions
Divergence Analysis
Bullish Divergence: S&P 500 makes new lows but A/D Line holds higher
Bearish Divergence: S&P 500 makes new highs but A/D Line fails to confirm
Confirmation
Strong trends occur when both price and A/D Line move in the same direction
Weak trends show when price moves but breadth doesn't follow
Settings
Lookback Period: Days for advance/decline comparison (default: 1)
Show Moving Average: Optional trend smoothing
MA Length: Moving average period (default: 20)
Limitations
Covers ~51% of S&P 500 (not complete market breadth)
Optimized for TradingView Premium accounts (40 security limit)
Heavy weighting toward mega-cap technology stocks
Dependent on real-time data quality
Intelligent Fear Indicator Pro+ v1.0 [EN] Intelligent Fear Pro+ — Make Your Decisions with Confidence
Turn candlesticks into clear, professionally filtered signals. The indicator combines pattern recognition with trend, volume, and volatility filters to deliver market signals that cut through the noise and highlight high-probability opportunities. It provides stronger confidence in every decision and shows only what matters on the chart for more accurate entries and exits, helping you pick the best trades across different timeframes.
Why You’ll Love It
High-quality signals: Confirms patterns with trend, volume, VWAP, ADX, and ATR.
Multi-timeframe confirmation: Smart filtering using higher-timeframe signals to reduce false alerts.
Instant alerts: Ready-to-use notifications so you never miss a move.
Practical design: Clean chart markers and a strong trend box to clarify current direction.
Flexible for any market: Works on forex, stocks, futures, and crypto — from scalping to swing trading.
What It Detects
Powerful patterns: Three White Soldiers / Three Black Crows, Five Soldiers / Five Crows, Cup & Handle, Engulfing, Morning Star, and Evening Star.
Professional filters: EMA trend, volume, VWAP, ADX (trend strength), ATR (true body momentum).
Optional VIX filter: Avoid trades during peak fear/volatility cycles.
How to Use It Quickly
Add it to your chart and adjust to your trading style.
Watch for pattern signals + confirmation from filters (trend/volume/VWAP).
Plan entries and exits with clear risk management.
⚠️ Important Note: This indicator is a decision-support tool, not investment advice. Always apply strict risk management.
Download Intelligent Fear Pro+ now and start seeing the market with greater clarity and speed.

NYSE Advancing Issues & Volume RatiosOverview
This comprehensive market breadth indicator tracks two essential NYSE ratios that provide deep insights into market sentiment and internal strength:
NYSE Advancing Issues Ratio
NYSE Advancing Volume Ratio
Dual Ratio Analysis
Issues Ratio: Measures the percentage of NYSE stocks advancing vs. total issues
Volume Ratio: Measures the percentage of NYSE volume flowing into advancing stocks
Both ratios displayed as easy-to-read percentages (0-100%)
Customizable Display Options
Toggle each ratio on/off independently
Choose from multiple moving average types (SMA, EMA, WMA)
Adjustable moving average periods
Custom color schemes for better visualization
Reference Levels
50% Line: Market neutral point (gray dashed)
10% Line: Extremely bearish breadth (red dotted)
90% Line: Extremely bullish breadth (green dotted)
Optional background highlighting for extreme readings
Smart Alerts
Cross above/below 50% (neutral) for both ratios
Extreme readings: Above 90% (strong bullish) and below 10% (strong bearish)
Real-time notifications for key market breadth shifts
📈 How to Interpret
Bullish Signals
Above 50%: More stocks/volume advancing than declining
Above 90%: Extremely strong market breadth (rare occurrence)
Divergence: Price making new highs while breadth weakens (potential warning)
Market Timing
Extreme readings (10%/90%) often coincide with market turning points
Breadth thrusts from extreme levels can signal powerful moves
Use with other technical indicators for enhanced timing

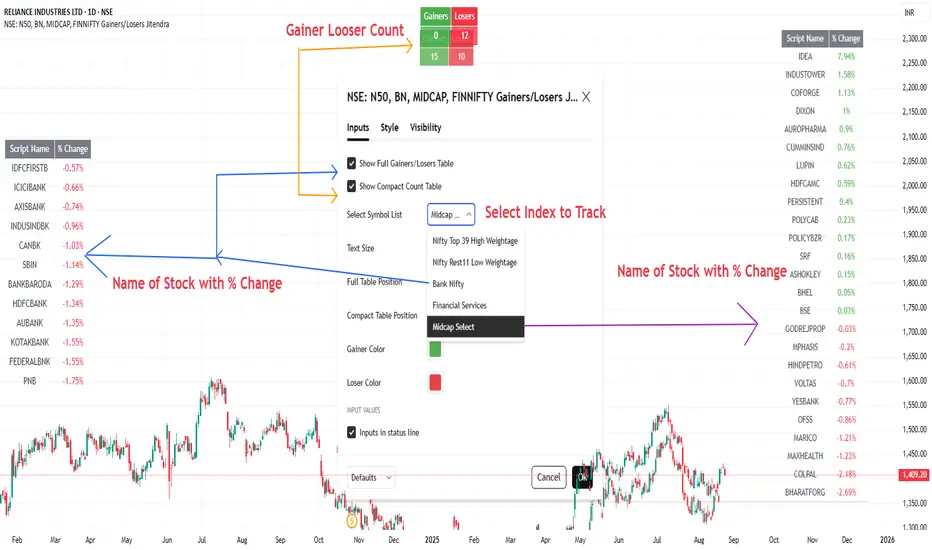
NSE: N50, BN, MIDCAP, FINNIFTY Gainers/Losers JitendraSummary of This Indicator
I Have Created This Gainers/Losers dashboard for selected NSE Indices
It is Divided in to symbol groups
1. Nifty Top 39 -High Weight Stocks
2. Nifty Rest 11-Remaining 11 Nifty stocks Low Weightage
3. Bank Nifty,
4. Financial Services,
5. Midcap Select
All Stock Used in Script is As per Latest Data Published by NSE, you can also check buy clicking below link
www.niftyindices.com
Main Features of Indicator
It Has Two Display Modes
Full Table → Shows each stock’s name and its daily % change, sorted from top gainer to top loser.
Compact Count Table → Shows just total number of gainers vs losers.
Customizable Inputs
Choose symbol list (High-weight Nifty, Bank Nifty, etc.).
Select table size (tiny → large).
Control table position (Top/Bottom/Middle, Left/Right/Center).
Customize gainer/loser colors.
Option to toggle full table or compact table on/off.
Data Handling
Fetches each stock’s close price vs previous day using request.security().
Calculates % change for all symbols.
Uses a bubble sort function to arrange stocks in descending order of % change.
Outputs
Full Gainers/Losers Table (sorted, detailed).
Compact Summary Table (just counts).
After Selecting Nifty Indices
Data Fetch Command Summary
Symbol Loop & Data Fetch
for i = 0 to array.size(symbolList)-1
sym = array.get(symbolList, i)
= request.security(sym, 'D', [close, close ])
chg = na(y) ? na : (c - y) / y * 100
if not na(chg)
array.push(chgList, chg) // store % change
array.push(nameList, sym) // store symbol name
gainers += chg > 0 ? 1 : 0
losers += chg < 0 ? 1 : 0
Sorting Function (Bubble Sort, Descending by % Change)
f_sortDesc(_a, _b) =>
len = array.size(_a)
if len > 1
for i = 0 to len - 2
for j = i + 1 to len - 1
if array.get(_a, j) > array.get(_a, i)
tempVal = array.get(_a, i)
tempSym = array.get(_b, i)
array.set(_a, i, array.get(_a, j))
array.set(_b, i, array.get(_b, j))
array.set(_a, j, tempVal)
array.set(_b, j, tempSym)
Thanks
Whaley Thrust — ADT / UDT / SPT (2010) + EDT (EMA) + Info BoxDescription
Implements Wayne Whaley’s 2010 Dow Award breadth-thrust framework on daily data, with a practical extension:
• ADT (Advances Thrust) — 5-day ratio of advances to (adv+dec). Triggers: > 73.66% (thrust), < 19.05% (capitulation).
• UDT (Up-Volume Thrust) — 5-day ratio of up-volume to (up+down). Triggers: > 77.88%, < 16.41%. Defaults to USI:UVOL / USI:DVOL (edit if your feed differs).
• SPT (Price Thrust) — 5-day % change of a benchmark (default SPY, toggle to use chart symbol). Triggers: > +10.05%, < −13.85%.
• EDT (EMA extension) — Declines-share thrust derived from WBT logic (not in Whaley’s paper): EMA/SMA of Declines / (Adv+Decl). Triggers: > 0.8095 (declines thrust), < 0.2634 (declines abating).
• All-Clear — Prints when ADT+ and UDT+ occur within N days (default 10); marks the second event and shades brighter green.
Visuals & Controls
• Shape markers for each event; toggle text labels on/off.
• Optional background shading (green for thrusts, red for capitulations; brighter green for All-Clear).
• Compact info box showing live ADT / UDT / SPT (white by default; turns green/red at thresholds).
• Min-spacing filter to prevent duplicate prints.
Tips
• Use on Daily charts (paper uses 5 trading days). Weekly views can miss mid-week crosses.
• If UDT shows 100%, verify your Down Volume symbol; the script requires both UVOL and DVOL to be > 0.
• Best use: treat capitulations (−) as setup context; act on thrusts (+)—especially when ADT+ & UDT+ cluster (All-Clear).
Credit
Core method from Wayne Whaley (2010), Planes, Trains and Automobiles (Dow Award). EDT is an added, complementary interpretation using WBT-style smoothing.

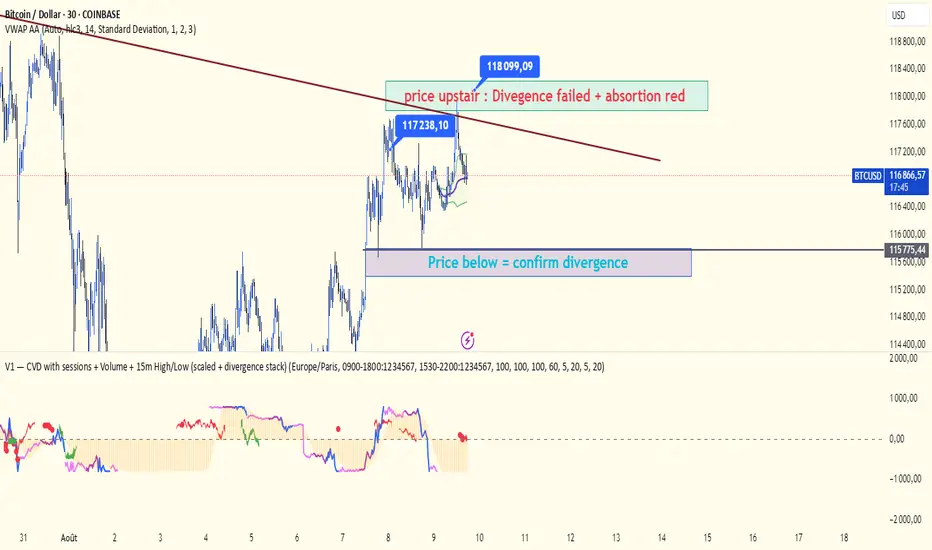
V1 — CVD with sessions scaled + divergence stackCVD with session: the three different session colors (fuchsia, purple, and blue).
There are two areas — green and red — which represent divergences with the price.
Be careful: both divergence and confirmation require a valid structure change.
The bubble is a visual aid to help validate or reject the divergence.
A bubble is calculated based on the previous session. You can adjust the volatility using lookbackCloseLL and lookbackHighBR.