Adaptive

Signal/Noise Adaptive Moving Average [Jwammo12]This is an adaptive moving average based on a signal noise ratio. It's inspiration is frm Eugene Durenard's book Professional Automated Trading Theory and Practice. Shout out to CryptoStatistical for his implemenation of Durenard's concepts that became the basis for this script.
Check out my breakout strategy based on this concept here .

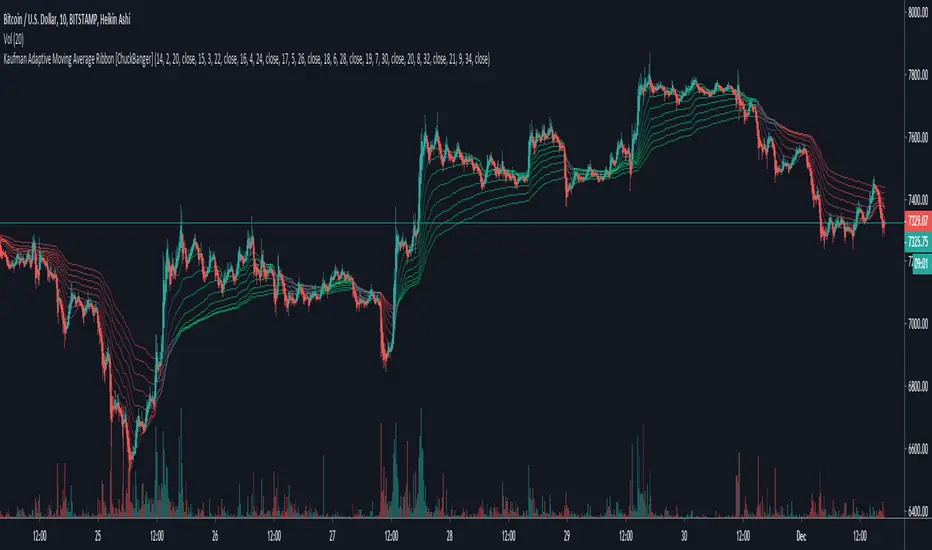
Kaufman Adaptive Moving Average Ribbon [ChuckBanger]Kaufman Adaptive Moving Average is one of the best moving averages in my opinion. So I made a ribbon script out of it. Good luck traders :)
Market Adaptive Stop-LossI realized that the zone changes in the stoploss remained slow, so I couldn't make enough use of the characteristics of technical indicators when opening positions.
This pushed me to keep stop-loss under the influence of a dependent variable.
This script helped me a lot (everget) :
I've redesigned the stop-loss to be affected by intersections.
Therefore, this script is also suitable for adaptive moving averages, fractional periods.
Script features:
1.You can select calculation methods created by using various technical analysis methods from the scripts' settings:
-Moving Average Convergence Divergence ( Macd )
-Stochastic Oscillator ( Stoch )
-Stochastic Relative Strength Index (StochRSI)
-Stochastic Money Flow Index (StochMFI ) (More info : )
-Know Sure Thing ( KST )
-OBV ( On Balance Volume )
-SMA ( Simple Moving Average )
-EMA ( Exponential Moving Average )
-FISHERTRANSFORM ( Fisher Transform )
-AWESOMEOSCILLATOR( Awesome Oscillator )
-PSAR ( Parabolic Stop and Reverse - Parabolic SAR )
-HULLMA( Hull Moving Average )
-VWMA ( Volume Weighted Moving Average )
-RMA (Moving Average using in Relative Strength Index calculations.)
-COG (Center of Gravity )
-ACC-DIST ( Accumulation / Distribution Index )
2 - The region is determined according to the above calculation methods and if it is larger or smaller than the previous stop loss level.
And if the price in the negative zone is lower than the stoploss, it is the exact signal and is shown with more highlighted colors.
And, in the positive zone, where the price is greater than the stoploss, the trade zones are certain.
Shown with more highlighted colors.
If the zones are correct but stop-loss is not suitable for opening positions:
In other words, if the stop-loss is above/under the highest-lowest levels in the positive zone or if the stop loss is located in the lower zone in the negative zone, these zones are shown to be darker and dimmed so that they do not cause false movements.
*** SUMMARY : As a result, you can use this script with support and resistances,and trend lines to get good results.
I hope it helps in your analyzes. Best regards.

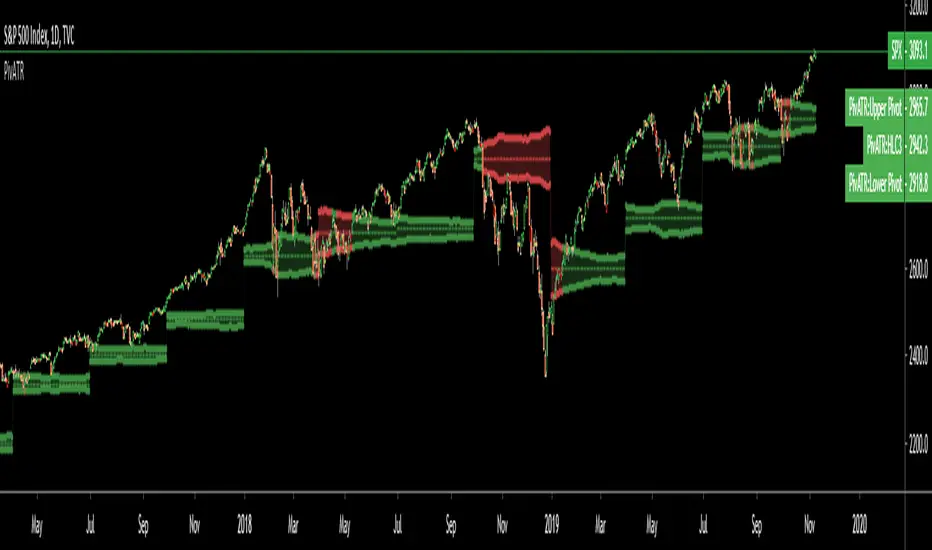
Adaptive Pivot (HLC3)SUMMARY:
Standard Pivot (HLC3) with ATR leeway added to make it adaptive to market volatility.
DESCRIPTION:
Adaptive Pivot is an indicator utilizing the simplicity of HLC3 Pivots as a turning point (and sometimes a trend indicator) while addressing it's fixed and inflexible nature.
Because the indicator is just a single line in the chart, the price may go near it but never touch it. Or it can go pass through it and never retest it again. In an attempt to lessen these from occurring, we can combine pivots with average true range (ATR). This is the specific formula I applied in this indicator:
>Upper Pivot = HLC3 + ATR
>Lower Pivot = HLC3 - ATR
This creates a kind of a range or cloud around the Pivot, making it possibly a more accurate indicator for market turning points.
ADJUSTABLE PARAMETERS:
The usual ATR parameters are included in this indicator:
>ATR_Length = input(14, title="ATR Length", minval=1)
>ATR_Smoothing = input(title="ATR Smoothing", defval="RMA", options="RMA", "SMA", "EMA", "WMA")
Added to the usual ones is this:
>ATR_Multiplier = input(1, title="ATR Multiplier", minval=0.1)
which modifies the extent of the ATR (similar to Chandelier Exit) as it is added/subtracted from the pivot values.
Pivot’s timeframe is also adjustable:
>Pivot_Timeframe = input("3M", title='Pivot Resolution')
Note: I did not lock the type to input.resolution to allow for more possible timeframes.
OTHER PARAMETERS
Indicator color will change to green when the open is above the HLC3 Pivot and change to red when the reverse is true.
Price-Line Channel - A Friendly Support And Resistance IndicatorIntroduction
Lines are the most widely used figures in technical analysis, this is due to the linear trends that some securities posses (daily log SP500 for example), support and resistances are also responsible for the uses of lines, basically linear support and resistances are made with the assumption that the line connecting two local maximas or minimas will help the user detect a new local maxima or minima when the price will cross the line.
Technical indicators attempting to output lines have always been a concern in technical analysis, the mostly know certainly being the linear regression, however any linear models would fit in this category. In general those indicators always reevaluate their outputs values (repainting), others non repainting indicators returning lines are sometimes to impractical to set-up. This is what has encouraged me to make a simpler indicator based on the framework used in the recursive bands indicator that i published.
The proposed indicator aim to be extremely flexible and easy to use while returning linear support and resistances, an option that allow readjustment is also introduced, thus allowing for a "smarter" indicator.
The Indicator
The indicator return two extremities, the upper one aim to detect resistance points while the lower one aim to detect support points. The length setting control the steepness of the line, with higher values of length involving a lower slope, this make the indicator less reactive and interact with the price less often.
The name "price-line" comes from the fact that the channel is dependent on its own interaction with the price, therefore a breakout methodology can also be used, where price is up-trending when crossing with the upper extremity and down trending when crossing with the lower one.
Readjusted Option
The line steepness can be readjusted based on the market volatility, it make more sense for the line to be more steep when the market is more volatile, thus making it converge faster toward the price, this of course is done at the cost of some linearity. This is achieved by checking the "readjustment" option. The effects can be shown on BTCUSD, below the indicator without the readjusted option :
when the "readjustment" option is checked we have the following results :
The volatile down movement on BTCUSd make the upper extremity converge faster toward the price, this option can be great for volatile markets.
Conclusion
The recursive bands indicator prove to be an excellent framework that allow for the creation of lots of indicators, the proposed indicator is extremely efficient and provide an easy solution for returning linear support and resistances without much drawbacks, the readjusted option allow the indicator to adapt to the market volatility at the cost of linearity.
The performance of the indicator is relative to the motion of the price, however the indicator show signs of returning accurate support and resistances points. I hope the indicator find its use in the community.
Thanks for reading !
Note
Respect the house rules, always request permission before publishing open source code. This is an original work, requesting permission is the least you can do.

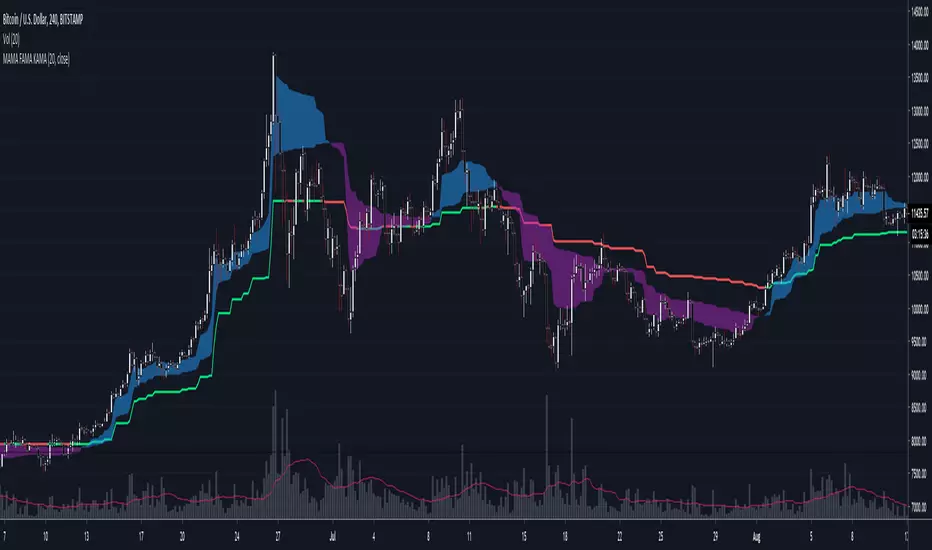
MAMA FAMA KAMA.. chameleon 🎵
Uses Kaufmann's Efficiency Ratio to generate adaptive inputs for Ehler's MAMA/FAMA. Alphas from the Hilbert transform are then used in place for the KAMA calculation.
Original MAMA/FAMA by everget : link
--------------------------------------
If you find it useful please consider a tip/donation :
BTC - 3BMEXEDyWJ58eXUEALYPadbn1wwWKmf6sA
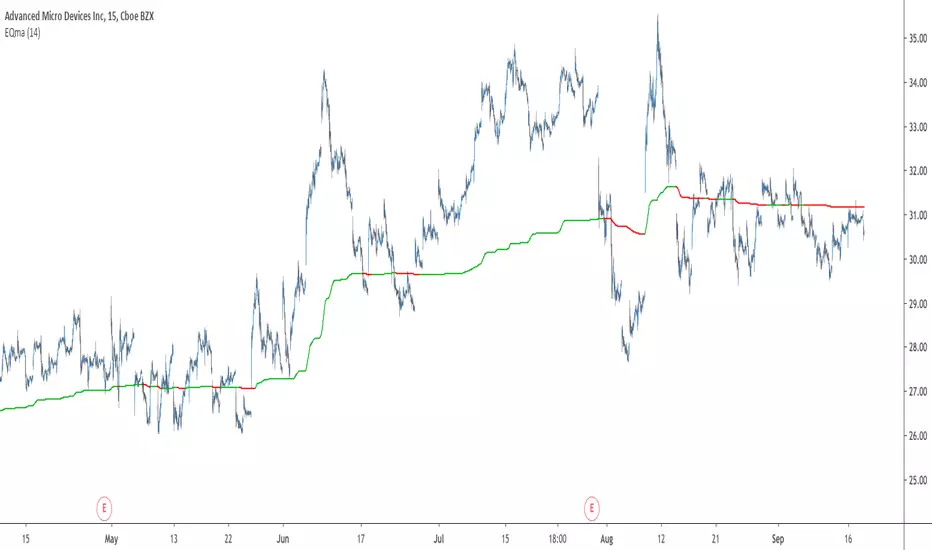
EQma - Adaptive Smoothing Based On Optimal Markets DetectionIntroduction
"You don’t put sunscreen when there is no sun, you don’t use an umbrella when there is no rain, you don’t use a kite when there is no wind, so why would you use a trend following strategy when there is no trend ?"
This is how i start my 4th paper "A New Technical Indicator For Optimal Markets Detection" where i present two new technical indicators. We talked about the first one, running equity, which aim to detect the best moment to enter trades, based on this new metric i made an adaptive moving average.
You can see the full paper here figshare.com
The Indicator
The moving average is based on exponential averaging and use a smoothing variable alpha based on the running equity metric, in order to calculate alpha the running equity is divided by the optimal equity which show the best returns possible for the conditions used. Basically the indicator work as follow :
When the running equity is close to the optimal equity it means that the price need no/little filtering since it does not contain information that need to be filtered, therefore alpha is high, however when the running equity is far from the optimal equity this mean that the price posses malign information that need to be removed.
This is why the indicator will be closer to the price when length is high :
See the full paper for an explanation on how this work.
I added various options for the indicator, one will reduce the lag by squaring alpha, thus giving for length = 14 :
The efficient option will make use of recursion to provide a more efficient indicator :
In green the efficient version, note how this option can allow a better fit with the price.
Conclusion
This is an indicator but at its core its rather a framework, if you have read the paper you'll see that the conditions are just 1 and -1 that changes with time, basically its like making a strategy with :
Condition = if buy then 1 else if sell then -1 else Precedent value of condition.
So those two indicators allow to give useful and usable information about your strategy. I hope it can be of use for anyone here, if so don't hesitate to send me what you made using the proposed indicator (and with all my indicators in general). If you are writing a paper and you think this indicator could fit in your work then let me know so i can be aware of it :)
Thanks for reading !
Acknowledgement
My papers are quite ridiculous but they still manage to get some views, some researchers don't even reach those number in so little time which is quite unfortunate but also really motivating for me, so thanks to those who take time to read them and give me some feedback :)
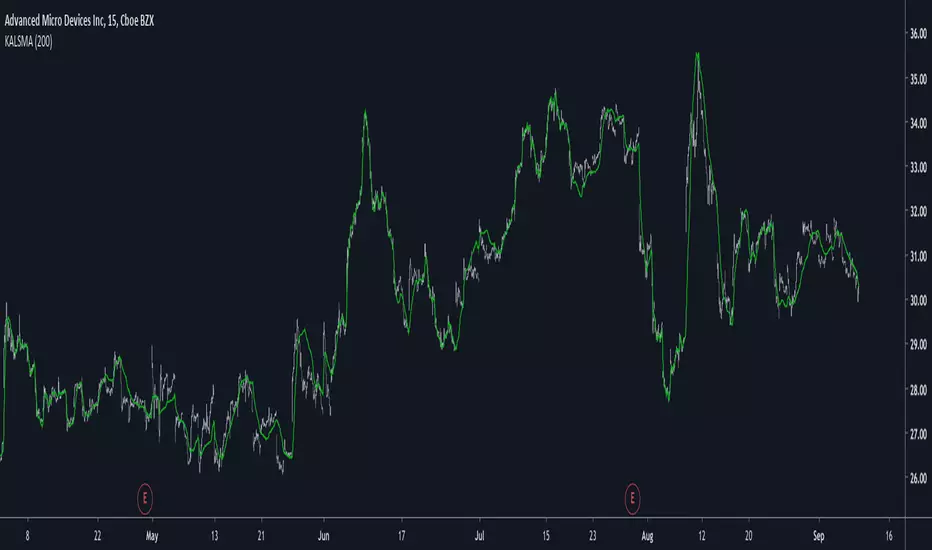
Kaufman Adaptive Least Squares Moving AverageIntroduction
It is possible to use a wide variety of filters for the estimation of a least squares moving average, one of the them being the Kaufman adaptive moving average (KAMA) which adapt to the market trend strength, by using KAMA in an lsma we therefore allow for an adaptive low lag filter which might provide a smarter way to remove noise while preserving reactivity.
The Indicator
The lsma aim to minimize the sum of the squared residuals, paired with KAMA we obtain a great adaptive solution for smoothing while conserving reactivity. Length control the period of the efficiency ratio used in KAMA, higher values of length allow for overall smoother results. The pre-filtering option allow for even smoother results by using KAMA as input instead of the raw price.
The proposed indicator without pre-filtering in green, a simple moving average in orange, and a lsma with all of them length = 200. The proposed filter allow for fast and precise crosses with the moving average while eliminating major whipsaws.
Same setup with the pre-filtering option, the result are overall smoother.
Conclusion
The provided code allow for the implementation of any filter instead of KAMA, try using your own filters. Thanks for reading :)
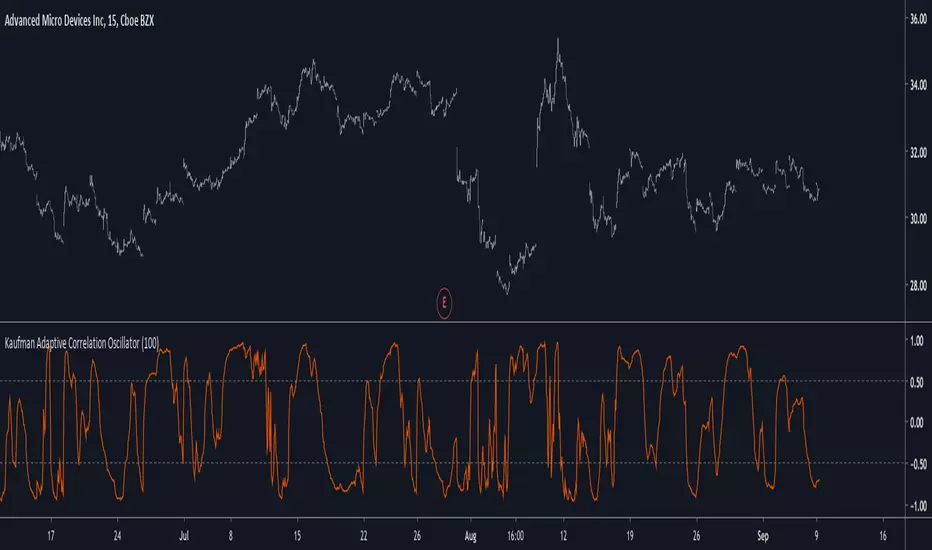
Kaufman Adaptive Correlation OscillatorIntroduction
The correlation oscillator is a technical indicator that measure the linear relationship between the market closing price and a simple increasing line, the indicator is in a (-1,1) range and rise when price is up-trending and fall when price is down-trending. Another characteristic of the indicator is its inherent smoothing which provide a noise free (to some extent) oscillator.
Such indicator use simple moving averages as well as estimates of the standard deviation for its calculation, but we can easily make it adaptive, this is why i propose this new technical indicator that create an adaptive correlation oscillator based on the Kaufman adaptive moving average.
The Indicator
The length parameter control the period window of the moving average, larger periods return smoother results while having a low kurtosis, which mean that values will remain around 1 or -1 a longer period of time. Pre-filtering apply a Kaufman adaptive moving average to the input, which allow for a smoother output.
No pre-filtering in orange, pre-filtering in yellow, period = 100 for both oscillators.
If you are not aware of the Kaufman adaptive moving average, such moving average return more reactive results when price is trending and smoother results when price is ranging, this also apply for the proposed indicator.
Conclusion
Classical correlation coefficients could use this approach, therefore the linear relationships between any variables could be measured. The fact that the indicator is adaptive add a certain potential, however such combination make the indicator have the drawback of kama + the correlation oscillator, which might appear at certain points.
Thanks for reading !
Powered Kaufman Adaptive Moving AverageIntroduction
The ability the Kaufman adaptive moving average (KAMA) has to be flat during ranging markets and close to the price during trending markets is what make this moving average one of the most useful in technical analysis. KAMA is calculated by using exponential averaging using the efficiency ratio (ER) as smoothing variable where 1 > ER > 0 . An increasing efficiency ratio indicate a trending market. Based on one of my latest indicator (see Kaufman Adaptive Bands) i propose this modified KAMA that allow to emphasis the abilities of KAMA by powering the efficiency ratio. I also added a new option that allow for even more adaptivity.
The Indicator
The indicator is a simple KAMA of period length that use a powered ER with exponent factor .
When factor = 1 the indicator is a simple KAMA, however when factor > 1 there can be more emphasis on the flattening effect of KAMA.
You can also restrain this effect by using 1 > factor > 0
Note that when the exponent is lower than 1 and greater than 0 you are basically applying a nth square root to the value, for example pow(2,0.5) = sqrt(2) because 1/0.5 = 2, in our case :
pow(ER,factor > 1) < ER and pow(ER,1 > factor > 0) > ER
Self Powered P-KAMA
When the self powered option is checked you are basically powering ER with the reciprocal of ER as exponent, however factor does no longer change anything. This can give interesting results since the exponent depend on the market trend strength.
In orange the self powered KAMA of period length = 50 and in blue a basic powered KAMA with a factor of 3 and a period of length = 50.
Conclusion
Applying basic math to indicators is always fun and easy to do, if you have adaptive moving averages using exponential averaging try powering your smoothing variable in order to see interesting results. I hope you like this indicator. Thanks for reading !

Kaufman Adaptive BandsIntroduction
Bands are quite efficient in technical analysis, they can provide support and resistance levels, provide breakouts points, trailing stop loss/take profits positions and can show the current market volatility to the user. Most of the time bands are made from a central tendency estimator like a moving average plus/minus a volatility indicator. Therefore bands can be made out of pretty much everything thus allowing for any kind of flavors.
So i propose a band indicator made from a Kaufman adaptive moving average using an estimate of the standard deviation.
Construction
The Kaufman moving average is an exponential averager using the efficiency ratio as smoothing variable, length control the period of kama and in order to provide more smoothness a power parameter has been introduced, higher values of power will return smoother results.
The volatility indicator is made from a biased estimation of the standard deviation by using the square root of the mean of the square minus the square of the mean method, except that we use kama instead of a mean.
The bands are made by adding/subtracting this volatility indicator with kama.
How To Use
The ability of the indicator to adapt to the current market state is what makes him a great tool for avoiding major exposition during ranging market, therefore the indicator will have a greater motion during trending market, or more simply the bands will move during trending markets while staying "flat" during ranging ones. Therefore the indicator might be more suited to breakouts, even if some cases will return what where turning points, this is particularly true during ranging markets.
Of course the efficiency ratio is not an "unbiased" trend metric indicator, it can consider high volatility markets as trending markets. Its one of his downsides.
High values of power will create smoother bands.
When using a low power parameter use an higher mult. In general using a low power value will make the bands move more freely as well as making them closer to each others.
Conclusion
At least the indicator is really nice to the eyes when using high power values, its ability to adapt to the market is a great addition to other more classical bands indicators, i also introduced a volatility estimator based on kama, some might have used the following estimation : kama(abs(price - kama)) which would have created a slower result. A trailing stop might be made from it if i see request about such addition.
If you are curious here are some more images of the indicator performing on different markets. Thanks for reading !

Adaptive Trailing StopIntroduction
The ability to adapt to possible markets states is important in technical analysis, this is why making adaptive indicator might help get better results. I propose a trailing stop indicator using recursion that can adapt to the efficiency ratio. I have added alerts since it's a often requested feature.
The Indicator
Its quite classical, bands are firstly made then a trailing stop is built around them. The bands are recursive, this allow for faster calculations in general but it also allow for a faster adaptivity. An higher length or factor will make the indicator detect longer term trends, factor determine the raising power of the efficiency ratio.
When smooth is checked the trailing stop will appear smoother.
When adaptive is unchecked the indicator will still act as a trailing stop but might be more affected to ranging markets.
Set a static/trailing stop loss :
You can set your stop loss based on the indicator, a static stop loss can be set at the value of the trailing stop when you enter the market. You can also set it as trailing stop, the indicator will follow the trend thus allowing for potential profits to grow's.
Determine The Trend Direction :
You can generate buy sell signals based on the indicator position relative to the price, when the indicator is lower than the price this indicate a up trending market, when the indicator is higher than the price this indicate a down trending market. If the trailing stop move this indicate a strong current trend.
False signals with trailing stops can happen, the price might go toward the trailing stop making it generate another signal, when market is ranging and exhibiting cyclical behaviour this can affect the indicator and the user might get stuck in a series of false signals, higher length/factor values can fix that at the cost of less early signals.
Identification Of Support And Resistance
Bands during low volatility/ranging markets can return potential reversal points when crossing with the price. The indicator can also do it, even if high/low crosses are better suited to determine support and resistance levels when using a trailing stop. You can use support/resistance identification in conjonction of the current trend detected by the indicator.
Conclusion
The indicator is fully operational in fixed mode while having potential down points in adaptive mode. As you can see the code that return the bands is fully recursive and might provide a great way to create adaptive bands in the future.
I have been asked to give more detail about the indicator uses rather than the construction, i hope the showcased uses are convenient.
Note that the showcased uses can be applied to any trailing stop.
Thanks for reading.

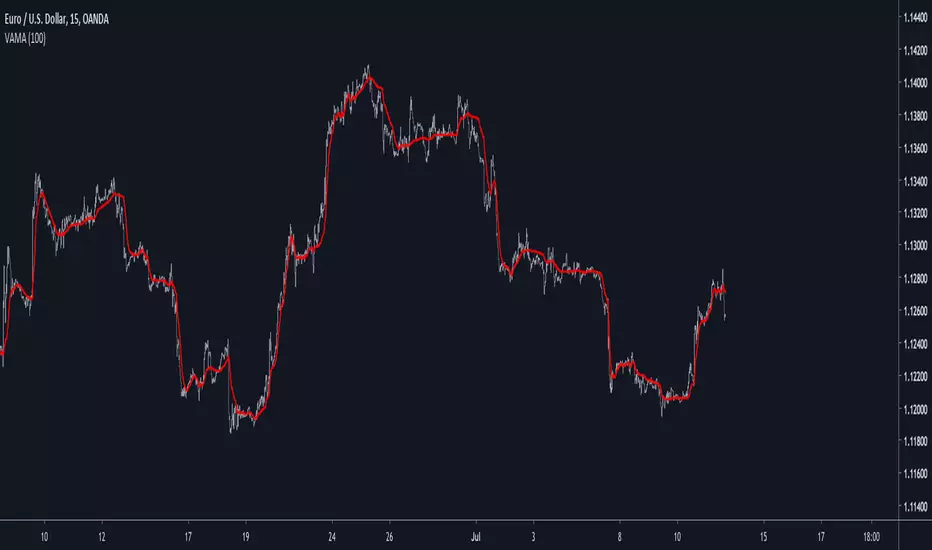
SVAMA - A Non Parametric Adaptive Moving Average Based On VolumeIntroduction
Technical indicators often have parameters settings that the user must enter, those are inconvenient when the user must design a strategy because such settings must be optimized, it must also been noted that the optimal settings at time t could change at time t+n , this is why non parametric indicators are more efficient. Today i propose a moving average adapting to the market volume without using parameters affecting the smoothing.
The Indicator
The volume is rescaled in a range of (1,0) by using max or min normalization. Exponential averaging is used to provide the moving average.
When using max normalization the moving average react faster when the volume is closer to its all time high, when using min normalization the moving average react faster when the volume is closer to its all time low. You can select the method (max or min) from the "Method" parameter.
Volume tend to be higher and more periodic with higher time-frames, this is why lower time-frames might return smoother results when using the Max method. It is recommended to use the Max method when we want a faster moving average while the Min method is more suited to get a slower moving average.
Both methods can provide an interesting MA-Cross system when used on higher time frames.
Conclusion
There should be more non parametric indicators, this would allow for faster and easier optimization processes when creating a strategy, in theory any indicator using a moving average or highest/lowest could be made non parametric by using a running mean or running max/min but the indicator might loose important information.
This is one of my main focus right now since such indicators could also allow for improvements when used with artificial intelligence. I hope you find an use to it, don't hesitate to send me your suggestions.
Thanks for reading !

Variable Adaptive Moving AverageAbout This Indicator
This was one of my first indicators, its also the first indicator i made a preprint paper about, i strongly encourage you to read the paper i made here : hal.archives-ouvertes.fr
Dont be triggered by the lack of quality of the paper, i only did it for fun. I might further develop this preprint thus ending with something more readable.
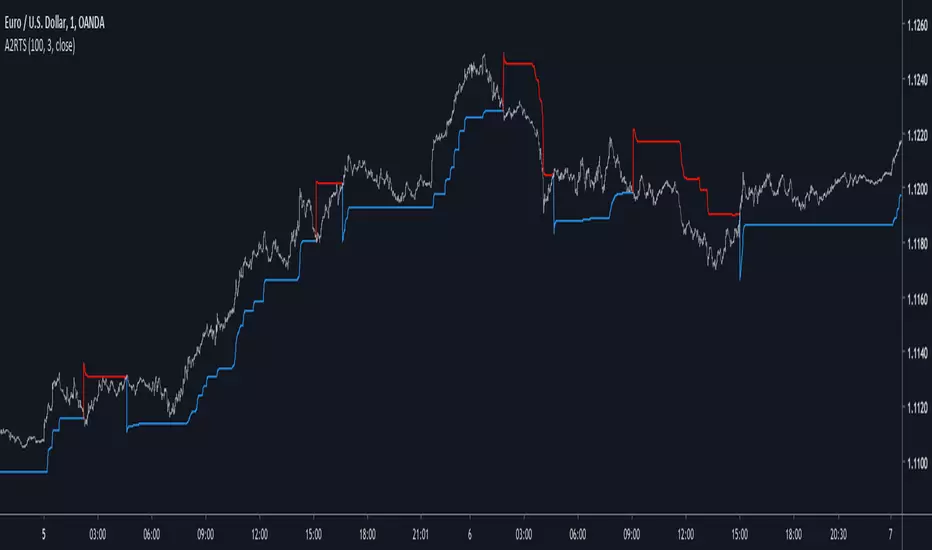
Adaptive Autonomous Recursive Trailing StopIntroduction
Trailing stop are important indicators in technical analysis, today i propose a new trailing stop A2RTS based on my last published indicator A2RMA (1), this last indicator directly used an error measurement thus providing a way to create enveloppes, which provide a direct way to create trailing stops based on highest/lowest rules.
The Indicator
If you need a more detailed explanation of this indicator i encourage you to check the A2RMA indicator post i made, parameters does not differ from the supertrend, thus having a length parameter and a factor parameter who is here described as gamma , gamma control how far away are the bands from each others thus spotting longer terms trends when gamma is higher.
On BTCUSD
Something worth mentioning is that the indicator sometimes behave like my MTA trailing stop indicator (2) who is closer to the price when a trend persist thus providing early exit points, however A2RTS behave a bit better.
Price can sometimes break the trailing stop, this can be interpreted as a support/resistance or just as an exit point, the support resistance methodology on trailing stop is not the most recommended.
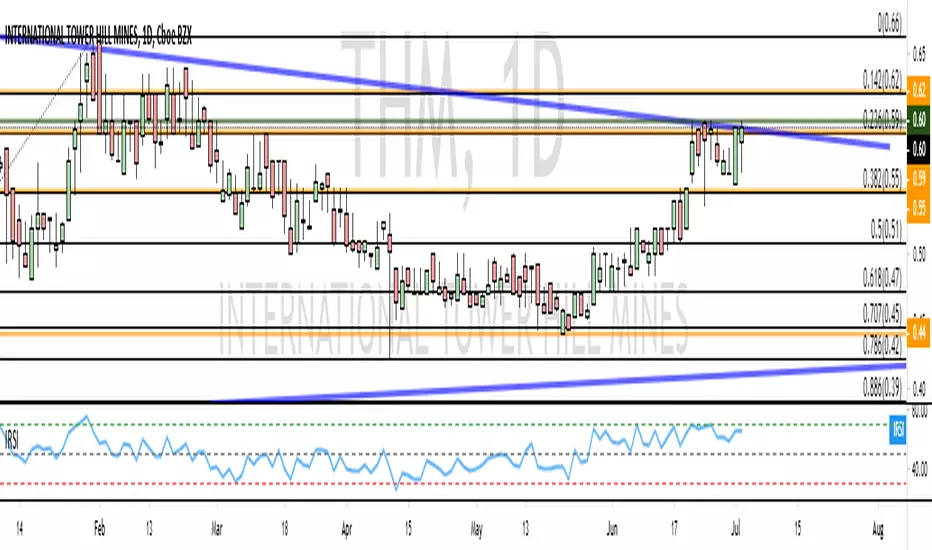
Sometimes it is recommended to have an higher length rather than an high gamma like in this case for INTEL CORP, below gamma = 3 and length = 20
The microprocessor market like to use higher length's instead of higher gamma's , A2RMA is a non-linear filter, this would explain such behaviour.
Conclusion
Trailing stops might not suffer as much from whipsaw trades than MA crossovers but they still remain inefficient when market is not trending, results of the proposed indicator on major forex pairs are more than disappointing, but i hope this will serve as basis for other trailing stops that might act a little bit better. I conclude this post by thanking everyone who support my work and i encourage you to modify this indicator and share it with the community.
Thanks for reading !
Cited Articles
Adaptive Autonomous Recursive Moving AverageIntroduction
Using conditions in filters is a way to make them adapt to those, i already used this methodology in one of my proposed indicators ARMA which gave a really promising adaptive filter, ARMA tried to have a flat response when dealing with ranging market while following the price when the market where trending or exhibiting volatile movements, the filter was terribly simple which is one of its plus points but its down points where clearly affecting its performance thus making it almost impractical.
Today i propose a new filter A2ARMA which aim to correct all the bad behaviours of ARMA while having a good performance on various markets thanks to the added adaptivity.
Fixes And Changes
ARMA was dealing with terribles over/under-shoots which affected its performance, adding a zero-lag option made the thing even worse, in order to fix those mistakes i first cleaned the code, then i removed the offset for src in d , this choice is optional but the filter is sometimes more accurate this way.
The major change is the use of an adaptive moving average instead of the triangular moving average that smoothed the output, this adaptive moving average is calculated using exponential averaging while using the efficiency ratio as smoothing variable, this choice surprisingly removed the majority of overshoots while adding more adaptivity to the filter.
The Indicator
The Indicator work the same way as ARMA, not reacting during flat market periods while following the price when this one is volatile or trending. length control the smoothing amount while gamma determine how the filter is affected during flat market periods, gamma = 0 is just a double smoothed adaptive moving average, higher values of gamma will filter flat markets with a certain degree.
On Intel Corp with gamma = 0, i want to filter the flat period starting at July 10, gamma = 3 will certainly help us on this task.
Hooray, the problem appear to be solved ! Lower values of gamma also produce desirable effect as shown below :
gamma = 2
So far so good, but gamma or length might have different optimal values depending on the market, also problems still exists as shown here :
Seagate is tricky, gamma at 2.4 might help
The relationship between length and gamma is somewhat complicated.
On Different Markets
While some filters will process market price the same way no matter the market they are affected, A2ARMA will change drastically depending of the market.
On AMD
On EURUSD
On BTCUSD
Comparison With ARMA
ARMA with parameters roughly matching A2RMA, overall most of the problems i wanted to fix where indeed fixed.
Conclusion
A huge thanks for the support i received during this "Blank Page" period i'am suffering, ARMA was an indicator i really wanted to further develop without giving up on the code simplicity and i think this version might provide useful results, we can also notice that the decision making is easier with this version of the indicator thanks to the added coloring (which would have been impossible with ARMA).
My work don't have license attached to it, feel free to modify and share your findings, mentioning is appreciated :)
Thanks for reading !

Ehlers Ideal RSIThis script has been updated to Pine v4. Original script by JustUncleL (link in code)
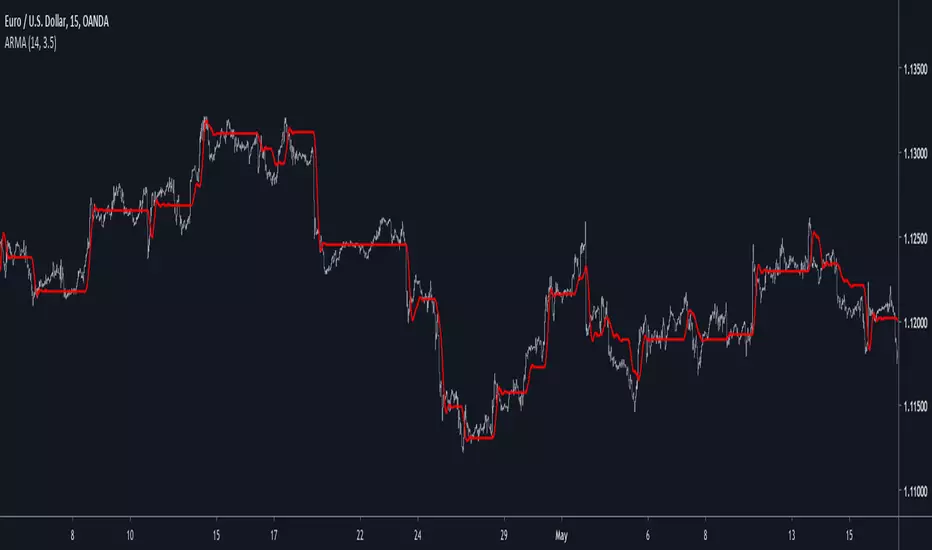
Autonomous Recursive Moving AverageIntroduction
People often ask me what is my best indicators, i can't really respond to this question with a straight answer but i would say you to check this indicator. The Autonomous Recursive Moving Average (ARMA) is an adaptive moving average that try to minimize the sum of squares thanks to a ternary operator, this choice can seem surprising since most of the adaptive moving averages adapt to a smoothing variable thanks to exponential averaging, but there are lot of downsides to this method, i really wanted to have a flat filter during flat markets and this is what i achieved.
The Indicator
length control the amount of smoothing during trending periods, gamma is the trend sensitivity threshold, higher values of gamma will make an overall flat filter, adjust gamma to skip ranging markets.
gamma = 2, we can adjust to 3 while preserving smoothing reactivity with trading periods.
gamma = 3
low length and higher gamma create more boxy result, the filter add overshoots directly in the output, its unfortunate.
The Zero-Lag option can reduce the lag as well as getting additional flat results without changing gamma.
Conclusion
The indicator need work, but i can't leave without publishing it, the overshoots are a big problems, changing sma for another stable filter can help. I hope you find an use to it, i really like this indicator.
Thanks for reading
Ratio OCHL Averager - An Alternative to VWAPIntroduction
I had the idea to make this indicator thanks to @dpanday with the support of @Coppermine and @Reika. Vwap is a non parametric indicator based on volume used by lot of traders and institutions, its non parametric particularity makes it great because it don't need to go through parameter optimization. Today i present a similar indicator called Ratio OCHL Averager based on exponential averaging by using the ratio of open-close to high-low range by using monthly high/low.
The Indicator
The indicator can more recursive by checking the "recursive" option, this allow to use the indicator output instead of the open price for the calculation of the ratio of open-close to high-low range. The result is a more reactive estimation,
The indicator reactivity change based on the time frame you are in, using higher time frame result in a more reactive indicator, however it is way less reactive than the vwap, this is a personal choice since i wanted this indicator to be smooth even with high time frames, if you want to change that you use another resolution for H and L in line 5,6.
Conclusion
I presented an alternative to vwap based on the Ratio OCHL indicator. I hope you like it and thanks for reading !
Thanks to Coppermine and Reika for the support during the creation of the indicator

Volume Adaptive BandsIntroduction
I have been asked by @Coppermine and @Verbena to make bands that use volume to provide adaptive results. My first approach was to use exponential averaging, in order to do so i needed to quantify volume movement using rescaling with the objective to make the bands go away from each others when there is low volume, this approach is efficient and can work on any time frame, however i decided at the end to use another method which rely on recursive weighting, cleaner but more parametric. Those bands aim to highlight great breakouts point to go with the trend.
The Indicator
length control the period of the moving averages used in the script, however low length's don't necessarily provide indications for shorter terms breakouts as shown here :
As i said the bands are close to each others when there is high volume and away when there is low volumes.
Low volume period, bands will avoid to cross price
High volume, bands will be close to generate signals.
Correction Factor
Higher time frames will lower the distance between each band, this is because volume is higher during higher time frames, remember that the indicator bands are close to each others when volume is high.
1h chart eurusd.
This is why i added a correction factor, this factor can help you control the distance between each bands, when the correction factor is greater than 1 the bands will be closer to each others, this is useful for low time frames where the average volume is lower. When the time frame is high, use values between 0 and 1 to increase distance between each bands.
Correction factor = 0.2
Conclusion
I presented a new adaptive band indicator that adapt to trading volume by using recursive weighting, volume can be replaced by other indicators but you can have results going nuts, at the end its about experimentation. I hope you will find an use to it, thanks to @Coppermine and @Verbena for the request :)
Thanks for reading !

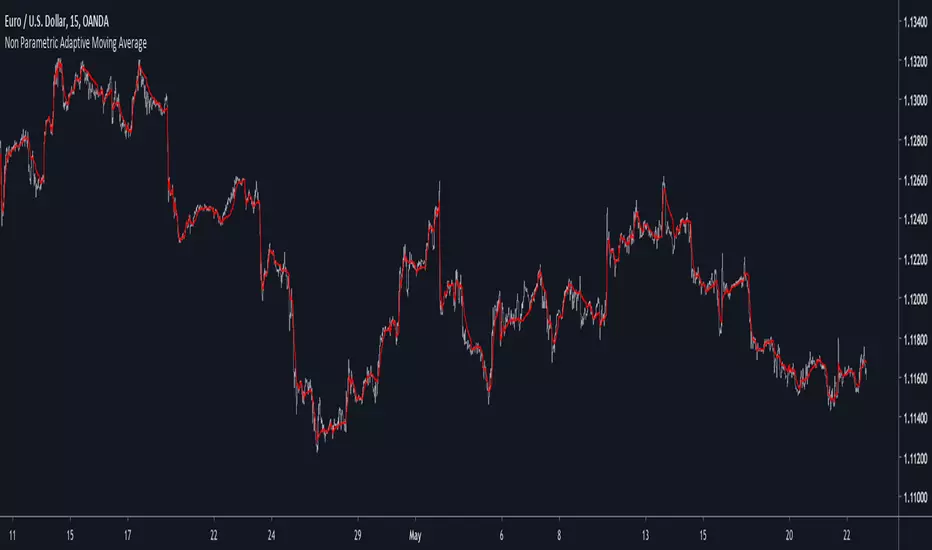
Non Parametric Adaptive Moving AverageIntroduction
Not be confused with non-parametric statistics, i define a "non-parametric" indicator as an indicator who does not have any parameter input. Such indicators can be useful since they don't need to go through parameter optimization. I present here a non parametric adaptive moving average based on exponential averaging using a modified ratio of open-close to high-low range indicator as smoothing variable.
The Indicator
The ratio of open-close to high-low range is a measurement involving calculating the ratio between the absolute close/open price difference and the range (high - low) , now the relationship between high/low and open/close price has been studied in econometrics for some time but there are no reason that the ohlc range ratio may be an indicator of volatility, however we can make the hypothesis that trending markets contain less indecision than ranging market and that indecision is measured by the high/low movements, this is an idea that i've heard various time.
Since the range is always greater than the absolute close/open difference we have a scaled smoothing variable in a range of 0/1, this allow to perform exponential averaging. The ratio of open-close to high-low range is calculated using the vwap of the close/high/low/open price in order to increase the smoothing effect. The vwap tend to smooth more with low time frames than higher ones, since the indicator use vwap for the calculation of its smoothing variable, smoothing may differ depending on the time frame you are in.
1 minute tf
1 hour tf
Conclusion
Making non parametric indicators is quite efficient, but they wont necessarily outperform classical parametric indicators. I also presented a modified version of the ratio of open-close to high-low range who can provide a smoothing variable for exponential averaging. I hope the indicator can help you in any way.
Thanks for reading !
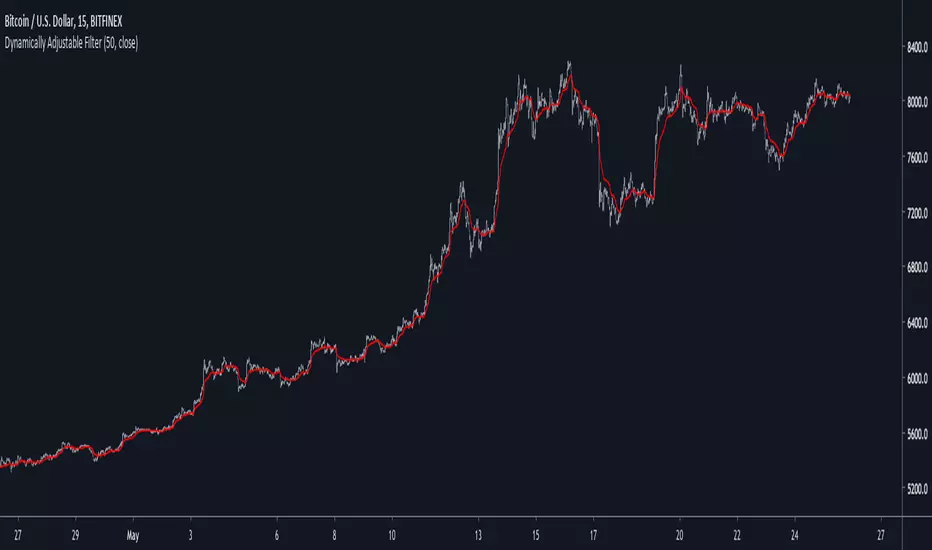
Dynamically Adjustable FilterIntroduction
Inspired from the Kalman filter this indicator aim to provide a good result in term of smoothness and reactivity while letting the user the option to increase/decrease smoothing.
Optimality And Dynamical Adjustment
This indicator is constructed in the same manner as many adaptive moving averages by using exponential averaging with a smoothing variable, this is described by :
x= x_1 + a(y - x_1)
where y is the input price (measurements) and a is the smoothing variable, with Kalman filters a is often replaced by K or Kalman Gain , this Gain is what adjust the estimate to the measurements. In the indicator K is calculated as follow :
K = Absolute Error of the estimate/(Absolute Error of the estimate + Measurements Dispersion * length)
The error of the estimate is just the absolute difference between the measurements and the estimate, the dispersion is the measurements standard deviation and length is a parameter controlling smoothness. K adjust to price volatility and try to provide a good estimate no matter the size of length . In order to increase reactivity the price input (measurements) has been summed with the estimate error.
Now this indicator use a fraction of what a Kalman filter use for its entire calculation, therefore the covariance update has been discarded as well as the extrapolation part.
About parameters length control the filter smoothness, the lag reduction option create more reactive results.
Conclusion
You can create smoothing variables for any adaptive indicator by using the : a/(a+b) form since this operation always return values between 0 and 1 as long as a and b are positive. Hope it help !
Thanks for reading !