Delta Zones🔶 Delta Zones — A Precision Tool for Time-Price Mapping 🔶
The Delta Zones indicator is a refined structure-mapping tool that dynamically tracks zones of dominant trading activity across recent sessions.
These zones are projected forward in time, offering traders a reliable visual guide to where significant interactions between buyers and sellers are likely to take place.
This tool was designed for intraday use, but its adaptability makes it powerful even on higher timeframes, giving traders insights into market behavior without the noise. You need to change session setting from indicator to higher TF that the chart. For intra, its by default on daily.
🔧 What This Indicator Does
Detects and displays the key activity zone for the current session (today).
Recalls the most active zone from the previous session, allowing you to track momentum or reversal bias.
Color codes each zone based on where price currently trades relative to it:
Neutral gradient (orange/white) for today’s zone, showing where price is consolidating or reacting.
Bullish green fade if price is trading above yesterday’s zone.
Bearish red fade if price is trading below yesterday’s zone.
Extends each zone forward (default 200 bars) so you can observe price behavior as it revisits these areas over time.
📈 How to Use Delta Zones
Trend Continuation:
If price pushes beyond today's zone and maintains momentum, it may suggest strength in that direction. Watch how price reacts on retests of this zone.
Fade or Mean Reversion:
When price strays far from a Delta Zone and struggles to gain ground, it often rotates back into that region. These situations can offer attractive risk-reward setups.
Zone Polarity from Prior Sessions:
Yesterday’s zone serves as a directional cue — if price opens and stays above it (green-filled), sentiment favors strength. If it stays below (red-filled), weakness may persist.
Support/Resistance Anchors:
Use zones as dynamic S/R levels — watch for wick tests, engulfing candles, or volume surges at zone edges for potential trade entries or exits.
🎛️ Inputs You Can Control
Session Length (Default: Daily): Defines how often a new zone is calculated.
💡 Pro Tip
These zones act like magnetic fields around price — not only can they contain price, but they also attract it. The key is to recognize when price is respecting, rejecting, or absorbing at the edges of the zone.
Pair Delta Zones with your favorite price action, momentum, or volume tools for sharper decision-making. For example, "Accumulation/Distribution Money Flow" script which I published few days ago.
⚠️ Note
This is a conceptually adaptive framework designed to simplify the visual structure of the market. While no model guarantees predictive accuracy, Delta Zones are especially useful for contextualizing price behavior and anticipating where meaningful reactions may occur.
This is an educational idea, use it at your own risk.
Past performance does not guarantee future success.
[i]price

Multi-Timeframe Price LevelsThis indicator displays key price levels from multiple timeframes on your chart, helping you identify important support and resistance zones.
## Features
- **Multiple Timeframes**: View price levels from 4H, Daily, 3-Day, Weekly, and Monthly charts simultaneously
- **Customizable Price Types**: Choose to display Open, Close, High, and Low prices
- **Color-Coded**: Each timeframe has its own color for easy identification
- **Fully Customizable**: Enable/disable specific timeframes and price types as needed
## How to Use
1. Add the indicator to your chart
2. Use the input options to select which timeframes and price types you want to display
3. Look for areas where multiple price levels converge - these often act as strong support/resistance zones
## Color Guide
- **Red**: 4-Hour timeframe
- **Blue**: Daily timeframe
- **Green**: 3-Day timeframe
- **Purple**: Weekly timeframe
- **Orange**: Monthly timeframe
For each timeframe, the transparency varies by price type:
- Open: 70% transparency
- Close: 50% transparency
- High: 30% transparency
- Low: 10% transparency (most visible)
## Trading Applications
- Identify key support and resistance levels
- Spot multi-timeframe confluences for stronger trade setups
- Plan entries and exits based on historical price reactions
- Set stop losses and take profit targets at significant levels
This indicator works best when combined with your existing trading strategy to confirm important price zones.

Grid Level Visualizer v1.0Overview
This indicator draws a customizable grid of horizontal price levels directly on your chart. It's designed to help traders visualize potential support and resistance zones, manage grid trading strategies, or simply divide a price range into equal segments. The script offers interactive controls, extensive customization options, and alert functionality.
Key Features:
Customizable Grid: Draws a grid based on user-defined Upper Price Bound and Lower Price Bound.
Interactive Bounds: Easily adjust the Upper and Lower bounds by dragging the corresponding lines directly on the chart (click the line first to select, then drag). Bounds can also be set numerically in the settings.
Adjustable Levels: Specify the total number of horizontal lines in the grid (Number of Grid Levels), including bounds.
Custom Styling: Independently configure the color, width, and style (Solid, Dashed, Dotted) for the boundary lines and the intermediate grid lines.
Price Labels: Optional display of price values for each grid level, positioned on the right side near the current bar.
Labels for boundary levels automatically inherit the boundary line colors.
Adjustable horizontal offset (Price Label Offset (X)) for labels.
Customizable text size (Text Size) and color (Price Text Color (Mid)) for mid-levels.
Grid Start Time: Define a specific date and time (Grid Start Time) from which the grid lines should start appearing on the chart (defaults to the beginning of the current month).
Line Extension: Grid lines automatically extend to the right margin of the chart.
Alert Condition: Provides a "Grid Level Cross" condition for creating custom alerts when price crosses any active grid level.
Alert Toggle: An option (Enable Alert Condition?) in the settings to enable or disable the availability of the "Grid Level Cross" condition when creating alerts.
Real-time Calculation: Uses calc_on_every_tick=true for responsive alert checking against the current price.
How to Use:
Add the "Improved Grid Level Visualizer" indicator to your chart.
Set Bounds: Adjust the Upper Price Bound and Lower Price Bound lines by clicking and dragging them on the chart, or set precise values in the indicator settings.
Set Levels: Define the Number of Grid Levels you need in the settings.
Set Start Time: Use the Grid Start Time input to control when the grid visualization begins.
Customize: Configure colors, line styles, label visibility, etc., in the settings panel.
Set Alerts (Optional): Follow the steps below.
Notes:
The grid levels are calculated purely based on the mathematical division of the specified price range. They do not automatically adapt to market structure unless you manually adjust the bounds.
When changing the Grid Start Time after the indicator has been running, you might need to refresh the chart or remove/re-add the indicator for the visual starting point to update correctly.

Metatrader CalculatorThe “ Metatrader Calculator ” indicator calculates the position size, risk, and potential gain of a trade, taking into account the account balance, risk percentage, entry price, stop loss price, and risk/reward ratio. It supports the XAUUSD, XAGUSD, and BTCUSD pairs, automatically calculating the position size (in lots) based on these parameters. The calculation is displayed in a table on the chart, showing the lot size, loss in dollars, and potential gain based on the defined risk.

Price Levels by Market Cap (Manual)This indicator will forecast the price by marketcap. The crypto's current circulating supply should be inputted manually.

Major Support and Resistance Price LevelsThis indicator is to be used to automatically plot Major Support and Resistance Price Levels. This is not a TREND support/resistance identifier. This is strictly for auto-plotting historically important price levels.
I would suggest adjusting the support/resistance filter before adjusting the sensistivity levels as I've testing out the setting quite a bit, but as always, do what works best for your chart.
If there is an input that you would like to have me add, let me know and I'll see what I can do.
Things to Consider:
Currently this works best on the 4H through 3D chart for Identifying major price levels; however lower timeframes do still work. Because of the large swings that can be typical when coming from Afterhours trading into Market hours, timeframes under 2H can create some false positives. This is obviously not as much of an issue on crypto or forex.
I will be working on allowing lower or higher timeframes with this indicator in order to circumvent the need to jump back to other timeframes and reference them if they are under that 2h threshold.
Future Updates:
Plotting different timeframe's results on a lower or higher timeframe.

MTF Fractals [RunRox]🔽 MTF Fractals is a powerful indicator designed to visualize fractals from multiple timeframes directly on your chart, highlight liquidity sweeps at these fractal levels, and provide several additional features we’ll cover in detail below.
We created this indicator because we couldn’t find a suitable tool that met our specific needs on TradingView. Therefore, we decided to develop a valuable indicator for the entire TradingView community, combining simplicity and versatility.
⁉️ WHAT IS A FRACTALS?
In trading, a fractal is a technical analysis pattern composed of five consecutive candles, typically highlighting local market turning points. Specifically, a fractal high is formed when a candle’s high is higher than the highs of the two candles on either side, whereas a fractal low occurs when a candle’s low is lower than the lows of the two adjacent candles on both sides.
Traders use fractals as reference points for identifying significant support and resistance levels, potential reversal areas, and liquidity zones within price action analysis. Below is a screenshot illustrating clearly formed fractals on the chart.
📙 FRACTAL FORMATION
Here’s how fractals form depending on your chosen setting (3, 5, 7, or 9):
▶️ 3-bar fractal – forms when the central candle is higher (for highs) or lower (for lows) than one candle on each side.
▶️ 5-bar fractal – forms when the central candle is higher or lower than two candles on both sides.
▶️ 7-bar fractal – forms when the central candle is higher or lower compared to the three candles on each side.
▶️ 9-bar fractal – forms similarly but requires four candles on each side, making the fractal significantly more reliable and robust.
A higher number of bars ensures stronger fractal levels, highlighting more significant potential reversal points on the chart.
Now that we’ve covered the theory behind fractal formation, let’s explore the indicator’s functionality in more detail.
Below, I’ll explain each feature clearly and illustrate how you can effectively utilize this indicator in your trading.
🕐 MULTI-TIMEFRAME FRACTALS
We realized that displaying fractals only from the current timeframe isn’t always convenient, so we’ve introduced Multi-Timeframe Fractals into this indicator.
Now you can easily display fractals from higher timeframes directly on your current chart, providing you with broader market context and clearer trading signals.
Fractals from Current Timeframe – Fractals identified directly on the chart’s current timeframe.
Fractals from Higher Timeframes – Fractals sourced from higher timeframes and displayed clearly on your current chart for enhanced market perspective.
📈 FRACTAL LINES
Since fractals represent areas of high liquidity, we’ve added an option to extend fractal levels horizontally as Fractal Lines across your chart.
This feature allows you to clearly visualize critical liquidity areas from higher timeframes, directly on your current timeframe chart, as demonstrated in the screenshot below.
With this approach, you can clearly visualize significant fractal levels from higher timeframes directly on your current chart - for example, projecting fractals from the 1-hour (1H) timeframe onto a 3-minute (3m) chart. ✅ This helps you easily identify critical liquidity areas and potential reversal zones without the need to switch between multiple timeframes.
💰 LIQUDITY SWEEP (LIQUDITY GRAB)
To enhance your trading experience, we’ve introduced a feature that clearly identifies liquidity sweeps of fractal levels.
A Liquidity Sweep occurs when a candle closes beyond a fractal line, leaving a wick that pierces through it, signaling that liquidity has been collected at this level.
Below, you’ll find two examples illustrating this functionality:
▶️ Fractal lines from the current timeframe
▶️ Fractal lines projected from higher timeframes
The first example illustrates liquidity being swept from fractals on the current timeframe .
Here, the candle clearly closes beyond the fractal line, leaving a wick through it. This indicates a liquidity sweep at the fractal level, visually highlighting a potential reversal or continuation opportunity directly on your chart.
In the second example, fractals from the higher timeframe are projected onto your current chart.
When a candle on your current timeframe closes beyond an HTF fractal line - leaving a wick through this level - the indicator highlights it clearly. This signals to traders a potential reversal zone, indicating that liquidity has been swept, and price may reverse or significantly react from this area.
You can also enable the display of additional labels on the chart. These labels clearly mark liquidity sweeps at fractal levels, making it easier to visually identify potential reversal points directly on your chart.
⚙️ SETTINGS
Below are the indicator settings with detailed explanations for each parameter.
🔷 Bars in Fractal – Number of candles to the right and left required to form a fractal.
🔷 Fractal Timeframe – Select the timeframe from which you want to display fractals on the current chart.
🔷 Max Age, bars – Number of bars during which the fractal will remain active.
🔷 Show Fractal Line – Display or hide fractal lines.
🔷 Line Style – Choose the style of the line displayed on the chart.
🔷 Line Width – Thickness of the fractal line.
🔷 High Fractal – Style and color of bearish fractals.
🔷 Low Fractal – Style and color of bullish fractals.
🔷 Fractal Label Size – Select the size of fractal labels.
🔷 Show Sweep Labels – Option to display labels when a liquidity sweep occurs.
🔷 Label Color – Color and transparency of the area marked on the chart during a sweep.
🔷 Shade Sweep Area – Show or hide the sweep area shading.
🔷 Area Color – Color and transparency settings for the sweep area.
🔶 We’d love to hear your feedback and any suggestions for additional features you’d like to see in this indicator. We’ll be happy to consider your ideas and continue improving the indicator!

1H/3m Concept [RunRox]🕘 1H/3m Concept is a versatile trading methodology based on liquidity sweeps from fractal points identified on higher timeframes, followed by price reversals at these key moments.
Below, I will explain this concept in detail and provide clear examples demonstrating its practical application.
⁉️ WHAT IS A FRACTALS?
In trading, a fractal is a technical analysis pattern composed of five consecutive candles, typically highlighting local market turning points. Specifically, a fractal high is formed when a candle’s high is higher than the highs of the two candles on either side, whereas a fractal low occurs when a candle’s low is lower than the lows of the two adjacent candles on both sides.
Traders use fractals as reference points for identifying significant support and resistance levels, potential reversal areas, and liquidity zones within price action analysis. Below is a screenshot illustrating clearly formed fractals on the chart.
📌 ABOUT THE CONCEPT
The 1H/3m Concept involves marking Higher Timeframe (HTF) fractals directly onto a Lower Timeframe (LTF) chart. When a liquidity sweep occurs at an HTF fractal level, we remain on the same LTF chart (since all HTF fractals are already plotted on this lower timeframe) and wait for a clear Market Structure Shift (MSS) to identify our potential entry point.
Below is a schematic illustration clearly demonstrating how this concept works in practice.
Below is another 💡 real-chart example , showing liquidity in the form of a 1H fractal, swept by a rapid impulse move. Immediately afterward, a clear Market Structure Shift (MSS) occurs, signaling a potential entry point into the trade.
Another example is shown below, where we see our hourly fractal, from which price clearly reacts, providing an opportunity to search for an entry point.
As illustrated on the chart, the fractal levels from the higher timeframe are clearly displayed, but we’re working directly on the 5-minute chart. This allows us to remain on one timeframe without needing to switch back and forth between charts to spot such trading setups.
🔍 MTF FRACTALS
This concept can be applied across various HTF-LTF timeframe combinations. Although our examples illustrate 1H fractals used on a 5-minute chart, you can effectively utilize many other timeframe combinations, such as:
30m HTF fractals on 1m chart
1H HTF fractals on 3m chart
4H HTF fractals on 15m chart
1D HTF fractals on 1H chart
The key idea behind this concept is always the same: identify liquidity at fractal levels on the higher timeframe (HTF), then wait for a clear Market Structure Shift (MSS) on the lower timeframe (LTF) to enter trades.
⚙️ SETTINGS
🔷 Trade Direction – Select the preferred trading direction (Long, Short, or Both).
🔷 HTF – Choose the higher timeframe from which fractals will be displayed on the current chart.
🔷 HTF Period – Number of candles required on both sides of a fractal candle (before and after) to confirm fractal formation on the HTF.
🔷 Current TF Period – Sensitivity to the impulse that sweeps liquidity, used for identifying and forming the MSS line.
🔷 Show HTF – Enable or disable displaying HTF fractal lines on your chart. You can also customize line style and color.
🔷 Max Age (Bars) – Number of recent bars within which fractals from the selected HTF will be displayed.
🔷 Show Entry – Enable or disable displaying the MSS line on the chart.
🔷 Enable Alert – Activates TradingView alerts whenever the MSS line is crossed.
You can also enable 🔔 alerts, which notify you whenever price crosses the MSS line. This significantly simplifies the process of identifying these setups on your charts. Simply configure your preferred timeframes and wait for notifications when the MSS line is crossed.
🔶 We greatly appreciate your feedback and suggestions for improving the indicator!

Price AltimeterThis indicator should help visualize the price, inspired by a Digital Altimeter in a Pilots HUD.
It's by default calibrated to Bitcoin, with the small levels showing every $100 and the larger levels setup to display on every $1000. But you can change this to whatever you want by changing the settings for: Small and Large Level Increments.
The default colors are grey, but can be changed to whatever you want, and there are two cause if you want they work as a gradient.
There are options to fade as the values go away from the current price action.
There are options for Forward and Backward Offsets, 0 is the current price and each value represents a candle on whatever time frame your currently on.
Other Options include the Fade Ratio, the Line Width and Style, which are all self explanatory.
Hope you Enjoy!
Backtest it in fast mode to see it in action a little better...
Known Issues:
For some reason it bug's out when either or are displaying more than 19 lines, unsure why so its limited to that for now.
Extra Note on what this may be useful for: I always wanted to make this, but didn't realize how to put things in front of the price action... Offset! Duh! Anyways, I thought of this one because I often it's hard on these charts to really get an idea for absolute price amounts across different time frames, this in an intuitive, at a glance way to see it because the regular price thing on the right always adds values between values when you zoom in and you can sometimes get lost figuring out the proportions of things.
Could also be useful for Scalping?
Cumulative Price Change AlertCumulative Price Change Alert
Version: 1.0
Author: QCodeTrader 🚀
Overview 🔍
The Cumulative Price Change Alert indicator analyzes the percentage change between the current and previous open prices and sums these changes over a user-defined number of bars. It then generates visual buy and sell signals using arrows and labels on the chart, helping traders spot cumulative price momentum and potential trading opportunities.
Key Features ⚙️
Customizable Timeframe 🕒:
Use a custom timeframe or default to the chart's timeframe for price data.
User-Defined Summation 🔢:
Specify the number of bars to sum, allowing you to analyze cumulative price changes.
Custom Buy & Sell Conditions 🔔:
Set individual percentage change thresholds and cumulative sum thresholds to tailor signals for
your strategy.
Visual Alerts 🚀:
Displays green upward arrows for buy signals and red downward arrows for sell signals directly
on the chart.
Informative Labels 📝:
Provides labels with formatted percentage change and cumulative sum details for the analyzed
bars.
Versatile Application 📊:
Suitable for stocks, forex, crypto, commodities, and more.
How It Works ⚡
Price Change Calculation ➗:
The indicator calculates the percentage change between the current bar's open price and the
previous bar's open price.
Cumulative Sum ➕:
It then sums these percentage changes over the last N bars (as specified by the user).
Signal Generation 🚦:
Buy Signal 🟢: When both the individual percentage change and the cumulative sum exceed
their respective buy thresholds, a green arrow and label are displayed.
Sell Signal 🔴: Conversely, if the individual change and cumulative sum fall below the sell
thresholds, a red arrow and label are shown.
How to Use 💡
Add the Indicator ➕:
Apply the indicator to your chart.
Customize Settings ⚙️:
Set a custom timeframe if desired.
Define the number of bars to sum.
Adjust the buy/sell percentage change and cumulative sum thresholds to match your trading
strategy.
Interpret Visual Cues 👀:
Monitor the chart for green or red arrows and corresponding labels that signal potential buy or
sell opportunities based on cumulative price movements.
Settings Explained 🛠️
Custom Timeframe:
Select an alternative timeframe for analysis, or leave empty to use the current chart's timeframe.
Number of Last Bars to Sum:
Determines how many bars are used to compute the cumulative percentage change.
Buy Condition - Min % Change:
The minimum individual percentage change required to consider a buy signal.
Buy Condition - Min Sum of Bars:
The minimum cumulative percentage change over the defined bars needed for a buy signal.
Sell Condition - Max % Change:
The maximum individual percentage change threshold for a sell signal.
Sell Condition - Max Sum of Bars:
The maximum cumulative percentage change over the defined bars for triggering a sell signal.
Best Use Cases 🎯
Momentum Identification 📈:
Quickly spot strong cumulative price movements and momentum shifts.
Entry/Exit Signals 🚪:
Use the visual signals to determine potential entry and exit points in your trading.
Versatile Strategy Application 🔄:
Effective for scalping, swing trading, and longer-term analysis across various markets.
UPD: uncheck labels for better performance

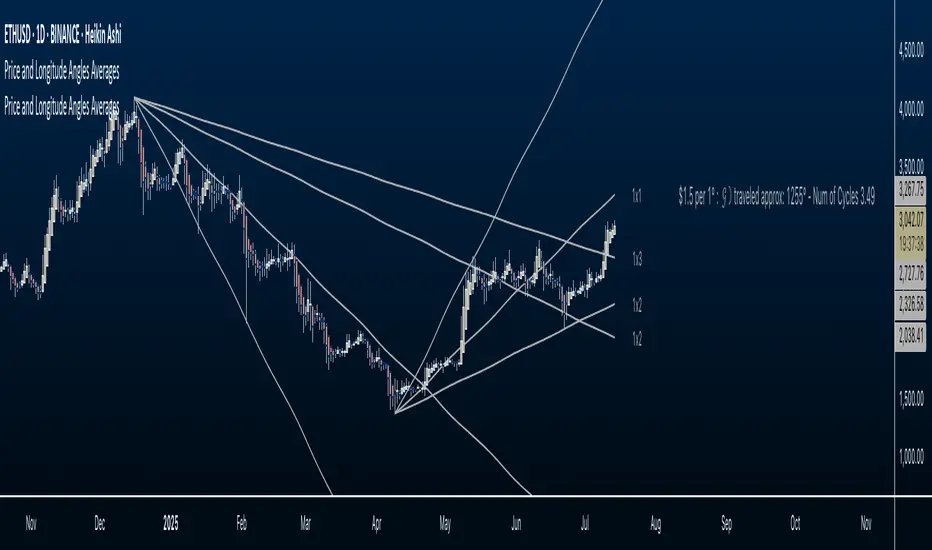
Price and Longitude Angles Planetary Price & Longitude Angles Indicator
This indicator plots planetary price and longitude angles starting from a user-selected date and time, offering a distinctive lens to explore the relationship between price and planetary timing. It supports both heliocentric and geocentric, enabling flexible and in-depth planetary analysis. The angles can be plotted across any time frame for maximum versatility.
How to Use
Once the indicator is loaded, you’ll be prompted to select a starting date and time for your analysis. From there, customize it as follows:
Select Planetary Options:
To plot the price and longitude for a single planet, choose the same planet in both dropdown menus.
To plot the average of two planets, select a different planet in each dropdown.
Set the Price Per Degree of Longitude: Adjust this value to define the scaling of the planetary angles relative to price.
Customize Fan Settings:
Toggle the mirroring of the fan on or off based on your needs.
Show or hide specific angle divisions to tailor the display to your preferences.
Display or conceal the information label that indicates the price per longitude and the number of degrees traveled.
This indicator is inspired by the methodologies of W.D. Gann and Patrick Mikula, expanding on concepts from Gann Scientific Method Unveiled, Volume 2. It was built using Astrolib by @BarefootJoey
I crafted this tool through dedication to support my own study of these ideas. I’m sharing it open-source not only to deepen my understanding and honor the work of Gann and Mikula, but also to invite collaboration. There’s always room for improvement—whether in functionality, accuracy, or design—and I hope others will join me in refining it. This is for those like me: eager to explore these concepts but lacking tools to experiment with. Let’s build on it together.
Price Level Multi Timeframe [Snowdex]Price Level Multi-Timeframe Indicator
This indicator visualizes important price levels from multiple timeframes (e.g., daily, weekly, monthly) directly on the chart. It helps traders identify significant support and resistance levels for better decision-making.
Features:
Displays price levels for multiple timeframes: daily (1D), weekly (1W), monthly (1M), quarterly (3M), semi-annual (6M), and yearly (12M).
Customizable options to show or hide levels and adjust their colors.
Highlights high, low, and close levels of each timeframe with labels and dotted lines.
Includes options to extend levels visually for better clarity.
Benefits:
Easily compare price levels across timeframes.
Enhance technical analysis with multi-timeframe insights.
Identify key areas of support and resistance dynamically.

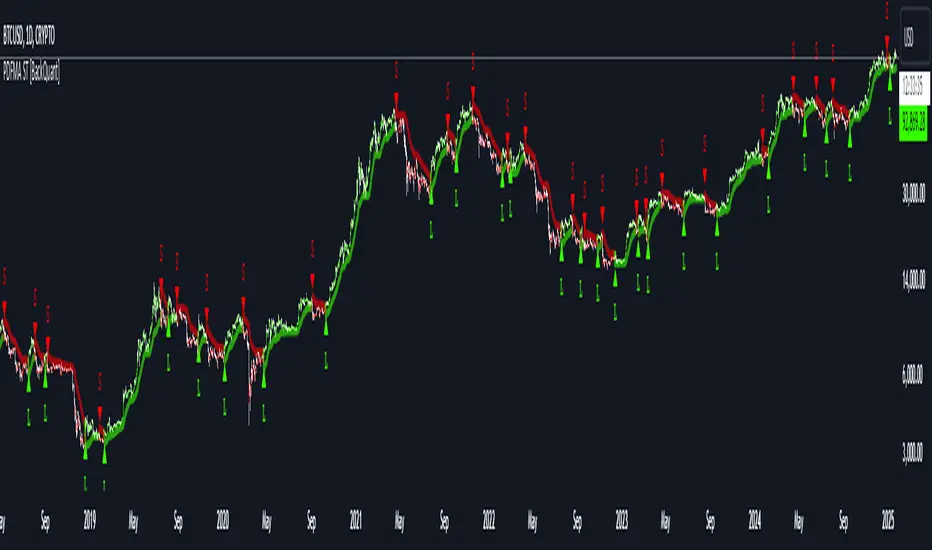
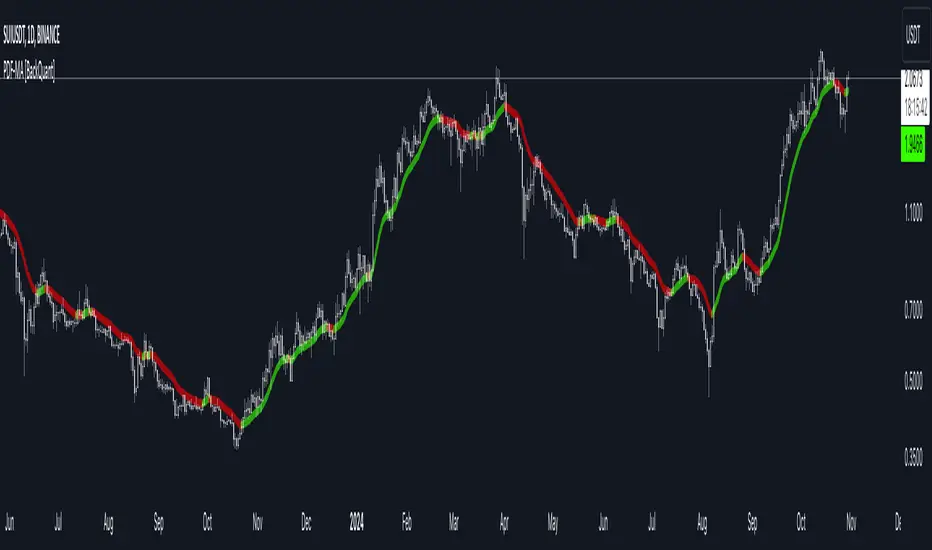
PDF-MA Supertrend [BackQuant]PDF-MA Supertrend
The PDF-MA Supertrend combines the innovative Probability Density Function (PDF) smoothing with the widely popular Supertrend methodology, creating a robust tool for identifying trends and generating actionable trading signals. This indicator is designed to provide precise entries and exits by dynamically adapting to market volatility while visualizing long and short opportunities directly on the chart.
Core Feature: PDF Smoothing
At the foundation of this indicator is the PDF smoothing technique, which applies a Probability Density Function to calculate a smoothed moving average. This method allows the indicator to assign adaptive weights to data points, making it responsive to market changes without overreacting to short-term volatility.
Key parameters include:
Variance: Controls the spread of the PDF weighting. A smaller variance results in sharper responses, while a larger variance smooths out the curve.
Mean: Shifts the PDF’s center, allowing traders to tweak how weights are distributed around the data points.
Smoothing Method: Offers the choice between EMA (Exponential Moving Average) and SMA (Simple Moving Average) for blending the PDF-smoothed data with traditional moving average methods.
By combining these parameters, the PDF smoothing creates a moving average that effectively captures underlying trends.
Supertrend: Adaptive Trend and Volatility Tracking
The Supertrend is a well-known volatility-based indicator that dynamically adjusts to market conditions using the ATR (Average True Range). In this script, the PDF-smoothed moving average acts as the price input, making the Supertrend calculation more adaptive and precise.
Key Supertrend Features:
ATR Period: Determines the lookback period for calculating market volatility.
Factor: Multiplies the ATR to set the distance between the Supertrend and the price. A higher factor creates wider bands, filtering out smaller price movements, while a lower factor captures tighter trends.
Dynamic Direction: The Supertrend flips its direction based on price interactions with the calculated upper and lower bands:
Uptrend : When the price is above the Supertrend, the direction turns bullish.
Downtrend : When the price is below the Supertrend, the direction turns bearish.
This combination of PDF smoothing and Supertrend calculation ensures that trends are detected with greater accuracy, while volatility filters out market noise.
Long and Short Signal Generation
The PDF-MA Supertrend generates actionable trading signals by detecting transitions in the trend direction:
Long Signal (𝕃): Triggered when the trend transitions from bearish to bullish. This is visually represented with a green triangle below the price bars.
Short Signal (𝕊): Triggered when the trend transitions from bullish to bearish. This is marked with a red triangle above the price bars.
These signals provide traders with clear entry and exit points, ensuring they can capitalize on emerging trends while avoiding false signals.
Customizable Visualization Options
The indicator offers a range of visualization settings to help traders interpret the data with ease:
Show Supertrend: Option to toggle the visibility of the Supertrend line.
Candle Coloring: Automatically colors candlesticks based on the trend direction:
Green for long trends.
Red for short trends.
Long and Short Signals (𝕃 + 𝕊): Displays long (𝕃) and short (𝕊) signals directly on the chart for quick identification of trade opportunities.
Line Color Customization: Allows users to customize the colors for long and short trends.
Alert Conditions
To ensure traders never miss an opportunity, the PDF-MA Supertrend includes built-in alerts for trend changes:
Long Signal Alert: Notifies when a bullish trend is identified.
Short Signal Alert: Notifies when a bearish trend is identified.
These alerts can be configured for real-time notifications via SMS, email, or push notifications, making it easier to stay updated on market movements.
Suggested Parameter Adjustments
The indicator’s effectiveness can be fine-tuned using the following guidelines:
Variance:
For low-volatility assets (e.g., indices): Use a smaller variance (1.0–1.5) for smoother trends.
For high-volatility assets (e.g., cryptocurrencies): Use a larger variance (1.5–2.0) to better capture rapid price changes.
ATR Factor:
A higher factor (e.g., 2.0) is better suited for long-term trend-following strategies.
A lower factor (e.g., 1.5) captures shorter-term trends.
Smoothing Period:
Shorter periods provide more reactive signals but may increase noise.
Longer periods offer stability and better alignment with significant trends.
Experimentation is encouraged to find the optimal settings for specific assets and trading strategies.
Trading Applications
The PDF-MA Supertrend is a versatile indicator suited to a variety of trading approaches:
Trend Following : Use the Supertrend line and signals to follow market trends and ride sustained price movements.
Reversal Trading : Spot potential trend reversals as the Supertrend flips direction.
Volatility Analysis : Adjust the ATR factor to filter out minor price fluctuations or capture sharp movements.
Final Thoughts
The PDF-MA Supertrend combines the precision of Probability Density Function smoothing with the adaptability of the Supertrend methodology, offering traders a powerful tool for identifying trends and volatility. With its customizable parameters, actionable signals, and built-in alerts, this indicator is an excellent choice for traders seeking a robust and reliable system for trend detection and entry/exit timing.
As always, backtesting and incorporating this indicator into a broader strategy are recommended for optimal results.
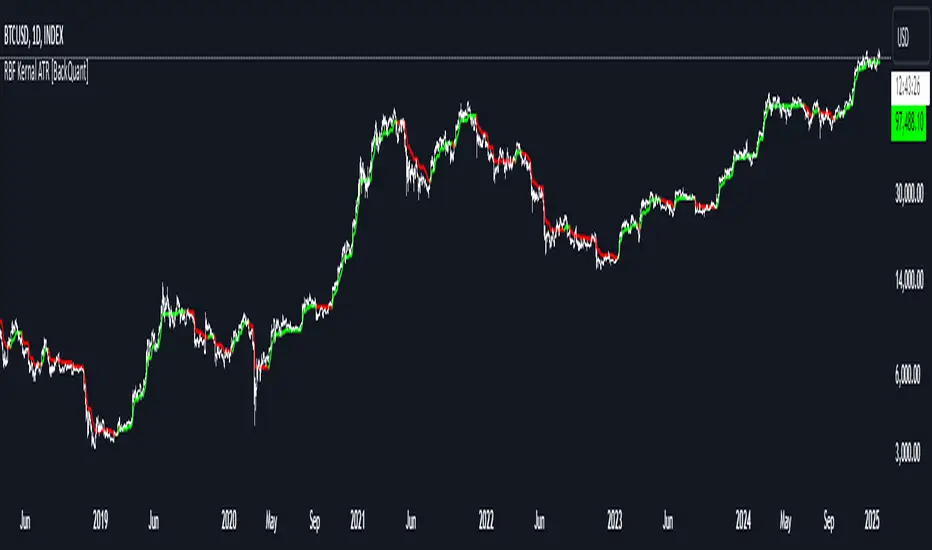
Radial Basis Kernal ATR [BackQuant]Radial Basis Kernel ATR
The Radial Basis Kernel ATR is a trading indicator that combines the classic Average True Range (ATR) with advanced Radial Basis Function (RBF) kernel smoothing . This innovative approach creates a highly adaptive and precise tool for detecting volatility, identifying trends, and providing dynamic support and resistance levels.
With its configurable parameters and ability to adjust to market conditions, this indicator offers traders a robust framework for making informed decisions across various assets and timeframes.
Key Feature: Radial Basis Function Kernel Smoothing
The Radial Basis Function (RBF) kernel is at the heart of this indicator, applying sophisticated mathematical techniques to smooth price data and calculate an enhanced version of ATR. By weighting data points dynamically, the RBF kernel ensures that recent price movements are given appropriate emphasis without overreacting to short-term noise.
The RBF kernel uses a gamma factor to control the degree of smoothing, making it highly adaptable to different asset classes and market conditions:
Gamma Factor Adjustment :
For low-volatility data (e.g., indices), a smaller gamma (0.05–0.1) ensures smoother trends and avoids overly sharp responses.
For high-volatility data (e.g., cryptocurrencies), a larger gamma (0.1–0.2) captures the increased price fluctuations while maintaining stability.
Experimentation is Key : Traders are encouraged to backtest and visually compare different gamma values to find the optimal setting for their specific asset and strategy.
The gamma factor dynamically adjusts based on the variance of the source data, ensuring the indicator remains effective across a wide range of market conditions.
Average True Range (ATR) with Dynamic Bands
The ATR is a widely used volatility measure that captures the degree of price movement over a specific period. This indicator enhances the traditional ATR by integrating the RBF kernel, resulting in a smoothed and adaptive ATR calculation.
Dynamic bands are created around the RBF kernel output using a user-defined ATR factor , offering valuable insights into potential support and resistance zones. These bands expand and contract based on market volatility, providing a visual representation of potential price movement.
Moving Average Confluence
For additional confirmation, the indicator includes the option to overlay a moving average on the smoothed ATR. Traders can choose from several moving average types, such as EMA , SMA , or Hull , and adjust the lookback period to suit their strategy. This feature helps identify broader trends and potential confluence areas, making the indicator even more versatile.
Long and Short Trend Detection
The indicator provides long and short signals based on the directional movement of the smoothed ATR:
Long Signal : Triggered when the ATR crosses above its previous value, indicating bullish momentum.
Short Signal : Triggered when the ATR crosses below its previous value, signaling bearish momentum.
These trend signals are visually highlighted on the chart with green and red bar coloring (optional), providing clear and actionable insights.
Customization Options
The Radial Basis Kernel ATR offers extensive customization options, allowing traders to tailor the indicator to their preferences:
RBF Kernel Settings
Source : Select the price data (e.g., close, high, low) used for the kernel calculation.
Kernel Length : Define the lookback period for the RBF kernel, controlling the smoothing effect.
Gamma Factor : Adjust the smoothing sensitivity, with smaller values for smoother trends and larger values for responsiveness.
ATR Settings
ATR Period : Set the period for ATR calculation, with shorter periods capturing more short-term volatility and longer periods providing a broader view.
ATR Factor : Adjust the scaling of ATR bands for dynamic support and resistance levels.
Confluence Settings
Moving Average Type : Choose from various moving average types for additional trend confirmation.
Moving Average Period : Define the lookback period for the moving average overlay.
Visualization
Trend Coloring : Enable or disable bar coloring based on trend direction (green for long, red for short).
Background Highlighting : Add optional background shading to emphasize long and short trends visually.
Line Width : Customize the thickness of the plotted ATR line for better visibility.
Alerts and Automation
To help traders stay on top of market movements, the indicator includes built-in alerts for trend changes:
Kernel ATR Trend Up : Triggered when the ATR indicates a bullish trend.
Kernel ATR Trend Down : Triggered when the ATR signals a bearish trend.
These alerts ensure traders never miss important opportunities, providing timely notifications directly to their preferred device.
Suggested Gamma Values
The effectiveness of the gamma factor depends on the asset type and the selected kernel length:
Low Volatility Assets (e.g., indices): Use a smaller gamma factor (approximately 0.05–0.1) for smoother trends.
High Volatility Assets (e.g., crypto): Use a larger gamma factor (approximately 0.1–0.2) to capture sharper price movements.
Experimentation : Fine-tune the gamma factor using backtests or visual comparisons to optimize for specific assets and strategies.
Trading Applications
The Radial Basis Kernel ATR is a versatile tool suitable for various trading styles and strategies:
Trend Following : Use the smoothed ATR and dynamic bands to identify and follow trends with confidence.
Reversal Trading : Spot potential reversals by observing interactions with dynamic ATR bands and moving average confluence.
Volatility Analysis : Analyze market volatility to adjust risk management strategies or position sizing.
Final Thoughts
The Radial Basis Kernel ATR combines advanced mathematical techniques with the practical utility of ATR, offering traders a powerful and adaptive tool for volatility analysis and trend detection. Its ability to dynamically adjust to market conditions through the RBF kernel and gamma factor makes it a unique and indispensable part of any trader's toolkit.
By combining sophisticated smoothing , dynamic bands , and customizable visualization , this indicator enhances the ability to read market conditions and make more informed trading decisions. As always, backtesting and incorporating it into a broader strategy are recommended for optimal results.
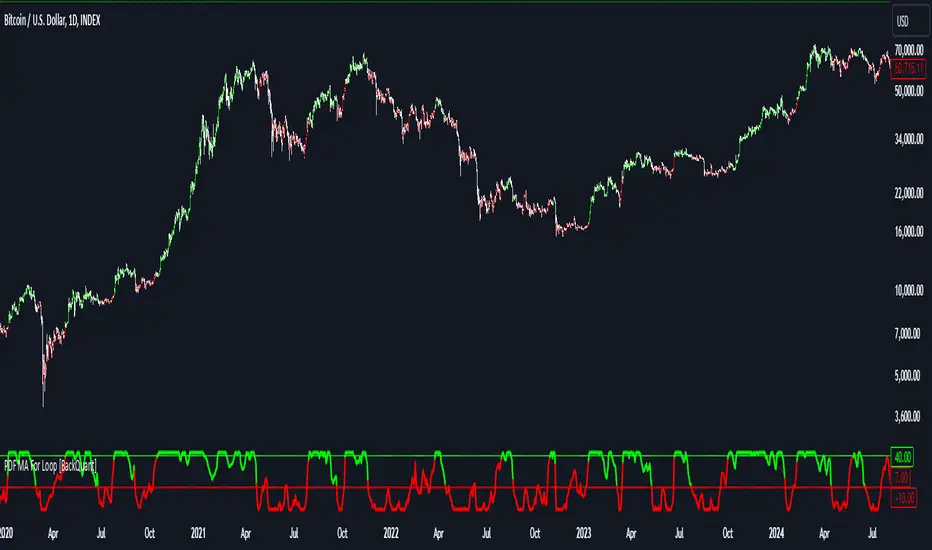
PDF MA For Loop [BackQuant]PDF MA For Loop
Introducing the PDF MA For Loop, an innovative trading indicator that combines Probability Density Function (PDF) smoothing with a dynamic for-loop scoring mechanism. This advanced tool provides traders with precise trend-following signals, helping to identify long and short opportunities with improved clarity and adaptability to market conditions.
If you would like to check out the stand alone PDF Moving Average:
Core Concept: Probability Density Function (PDF) Smoothing
The PDF smoothing method is a unique approach that applies adaptive weights to price data based on a Probability Density Function. This ensures that recent data points receive appropriate emphasis while maintaining a smooth transition across the data set. The result is a moving average that is not only smoother but also more responsive to market changes.
Key parameters in PDF smoothing:
Variance : Controls the spread of the PDF, where a higher value results in broader smoothing and a lower value makes the moving average more sensitive.
Mean : Centers the PDF around a specific value, influencing the weighting and responsiveness of the smoothing process.
By combining PDF smoothing with traditional moving averages (EMA or SMA), the indicator creates a hybrid signal that balances responsiveness and reliability.
For-Loop Scoring Mechanism
At the heart of this indicator is the for-loop scoring mechanism, which evaluates the smoothed PDF moving average over a defined range of historical data points. This process assigns a score to the current market condition based on whether the PDF moving average is greater than or less than previous values.
Long Signal: A long signal is generated when the score exceeds the Long Threshold (default set at 40), indicating upward momentum.
Short Signal: A short signal is triggered when the score crosses below the Short Threshold (default set at -10), suggesting potential downward momentum.
This dynamic scoring system ensures that the indicator remains adaptive, capturing trends and shifts in market sentiment effectively.
Customization Options
The PDF MA For Loop includes a variety of customizable settings to fit different trading styles and strategies:
Calculation Settings
Price Source : Select the input price for the calculation (default is the close price).
Smoothing Method : Choose between EMA or SMA for the additional smoothing layer, providing flexibility to adapt to market conditions.
Smoothing Period : Adjust the lookback period for the smoothing function, with shorter periods providing more sensitivity and longer periods offering greater stability.
Variance & Mean : Fine-tune the PDF function parameters to control the weighting of the smoothing process.
Signal Settings
Thresholds : Customize the upper and lower thresholds to define the sensitivity of the long and short signals.
For Loop Range : Set the range of historical data points analyzed by the for-loop, influencing the depth of the scoring mechanism.
UI Settings
Signal Line Width: Adjust the thickness of the plotted signal line for better visibility.
Candle Coloring: Enable or disable the coloring of candlesticks based on trend direction (green for long, red for short, gray for neutral).
Background Coloring: Add background shading to highlight long and short signals for an enhanced visual experience.
Alerts and Automation
The indicator includes built-in alert conditions to notify traders of important market events:
Long Signal Alert: Notifies when the score exceeds the upper threshold, indicating a bullish trend.
Short Signal Alert: Notifies when the score crosses below the lower threshold, signaling a bearish trend.
These alerts can be configured for real-time notifications, allowing traders to respond quickly to market changes without constant chart monitoring.
Trading Applications
The PDF MA For Loop is versatile and can be applied across various trading strategies and market conditions:
Trend Following: The PDF smoothing method combined with for-loop scoring makes this indicator particularly effective for identifying and following trends.
Reversal Trading: By observing the thresholds and score, traders can anticipate potential reversals when the trend shifts from long to short (or vice versa).
Risk Management: The dynamic thresholds and scoring provide clear signals, allowing traders to enter and exit trades with greater confidence and precision.
Final Thoughts
The PDF MA For Loopis merges advanced mathematical concepts with practical trading tools. By leveraging Probability Density Function smoothing and a dynamic for-loop scoring system, it provides traders with clear, actionable signals while adapting to market conditions.
Whether you’re looking for an edge in trend-following strategies or seeking precision in identifying reversals, this indicator offers the flexibility and power to enhance your trading decisions
As always, backtesting and integrating the PDF MA For Loop into a comprehensive trading strategy is recommended for optimal performance, as no single indicator should be used in isolation.
Thus following all of the key points here are some sample backtests on the 1D Chart
Disclaimer: Backtests are based off past results, and are not indicative of the future.
INDEX:BTCUSD
INDEX:ETHUSD
BINANCE:SOLUSD
JaT - Max/Min Labels ProDescription:
The JaT - Max/Min Labels Pro is a powerful and customizable tool designed for traders who want clear, precise, and visually appealing identification of local price extremes. This indicator dynamically detects local maxima and minima based on user-defined sensitivity and displays their values as labels directly on the chart.
Key Features:
Dynamic Extremes Detection: Automatically identifies local highs and lows using a user-configurable lookback period and sensitivity setting.
Customizable Label Offset: Allows you to position labels further away from the bars for enhanced visibility.
Clear Visualization: Labels are color-coded for clarity:
Green for Highs: Transparent green text (50% opacity) displayed above the bar.
Red for Lows: Transparent red text (50% opacity) displayed below the bar.
Efficient Performance: Utilizes optimized Pine Script arrays to manage labels dynamically and avoid clutter.
User-Friendly: Simple configuration with adjustable parameters for lookback period, sensitivity, and label offset.
Parameters:
Lookback Period: Defines the range of bars to analyze for extremes.
Sensitivity: Adjusts the smoothing level for extreme detection using a moving average.
Label Offset: Controls the vertical distance of labels from the bar, ensuring they are easy to read without overlapping.
Who is it for?
This indicator is ideal for traders who rely on technical analysis to spot potential reversal points, breakout levels, or key support/resistance zones. Whether you're a day trader, swing trader, or long-term investor, the JaT - Max/Min Labels Pro provides an elegant and practical solution for enhancing your charting workflow.
How to Use:
Add the indicator to your chart.
Configure the settings to suit your trading style:
Adjust the Lookback Period to define how far back the indicator analyzes.
Set the Sensitivity to control how frequently highs and lows are detected.
Use the Label Offset to adjust label placement for better visibility.
Observe the dynamically generated labels highlighting price extremes.
Feel free to tweak or expand this description if you'd like to emphasize other features or include additional instructions. Let me know if there's anything else you'd like to add or adjust! 😊

Improved Trend Shot | JeffreyTimmermansImproved Trend Shot
The "Improved Trend Shot" is an advanced trend-following tool that integrates cutting-edge features and the principles of John Ehlers’ SuperSmoother Filter to provide traders with more accurate trend detection and better decision-making. This enhanced version includes multiple smoothing types, customizable lengths, dynamic alerts, and a comprehensive dashboard to help traders quickly interpret market conditions.
This script is inspired by "TRW" . However, it is more advanced and includes additional features and options.
Key Features and Improvements
Smoothed Lines and Trend Detection
The core of the Improved Smooth Trend Shot relies on three key lines to capture market momentum:
Fast Line: Highly sensitive to short-term price changes, offering rapid responsiveness to market movements.
Middle Line: Provides a medium-term view of market trends, acting as a more stable reference.
Slow Line: Focuses on long-term trends, offering a broader perspective on market direction.
These three smoothed lines interact dynamically to create a visual color-coded cloud that helps traders easily interpret market conditions:
Green Cloud: Indicates an upward trend when the Fast line is above the Slow line.
Red Cloud: Signals a downward trend when the Fast line is below the Slow line.
The cloud color adjusts based on the relative positioning of the Fast, Middle, and Slow lines, helping traders to identify bullish or bearish trends with ease.
Dynamic Cloud Visualization and Alerts
The cloud and trend lines adapt to market conditions, updating in real-time to reflect changes in trend strength and momentum. Traders can also set up real-time alerts to notify them of important trend shifts, such as:
Fast and Slow Crossovers: Alerts when the Fast line crosses the Slow line.
Middle and Slow Crossovers: Alerts when the Middle line crosses the Slow line.
This makes it easier to capture trading opportunities and respond promptly to market changes.
Enhanced Smoothing Options
Traders can now choose from multiple smoothing types, including:
EMA (Exponential Moving Average)
SMA (Simple Moving Average)
DEMA (Double Exponential Moving Average)
WMA (Weighted Moving Average)
Each smoothing type has different properties, allowing traders to select the best fit for their trading style. The smoothing length can also be customized, offering flexibility in fine-tuning how sensitive or stable the trend lines should be.
Improved Signal Logic and Precision
The signal logic has been optimized for better precision. Now, the system provides more accurate buy and sell alerts based on:
Trend Detection: The color-coded cloud and the relative positions of the Fast, Middle, and Slow lines help visualize whether the trend is bullish or bearish.
Rising and Falling Indicators: The indicator also checks if each line is rising or falling over the last three bars, offering early signals of momentum shifts.
Dashboard Insights
The dashboard provides real-time updates on the positions and movements of the smoothed lines:
Line Positions: Displays the positions of the Fast, Middle, and Slow lines.
Trend Direction: Shows whether each line is rising or falling.
Price Levels: Displays the price levels for each of the smoothed lines, offering clear reference points for market evaluation.
These features help traders better understand the state of the market, offering valuable insights for both trend-following and reversal-based strategies.
Crossovers and Signal Triggers
The Improved Smooth Trend Shot focuses on crossovers between the different smoothed lines as primary trading signals. There are two types of crossovers:
Fast Shots: This occurs when the Fast line crosses the Slow line.
Slow Shots: This occurs when the Middle line crosses the Slow line.
These crossovers serve as key entry or exit points for traders, helping them spot potential trend reversals. The improved logic ensures that crossovers are accurately detected, reducing the chances of false signals.
Customization Options
The Improved Smooth Trend Shot offers a high degree of customization:
Smoothing Length: Adjust the smoothing period to balance between fast responses and stable trends.
Source Selection: Default to the average of high and low prices (hl2), or choose other price sources.
Smoothing Type: Select from EMA, SMA, DEMA, or WMA for personalized trend analysis.
Signal Type: Choose between Fast Shots or Slow Shots based on the type of crossover you want to focus on.
Long, Medium, and Short-Term Applications
Although the default settings are optimized for long-term trend analysis, the Improved Smooth Trend Shot is highly adaptable. By adjusting the smoothing length and selecting different smoothing types, traders can use the tool for:
Short-Term Trading: Focus on fast responses to market shifts using shorter smoothing periods.
Medium-Term Trading: Tailor the settings to capture intermediate trends.
Long-Term Trend Analysis: Use longer smoothing periods for a more stable and comprehensive view of market dynamics.
Advanced ATR Filtering and Alerts
The inclusion of ATR (Average True Range) filtering helps ensure that signals are triggered only when significant price movements occur. This helps reduce noise and false signals, ensuring traders only act on meaningful market shifts.
Conclusion
The Improved Smooth Trend Shot is a powerful and versatile tool that enhances the original SuperSmoother Filter with advanced features like customizable smoothing options, real-time alerts, and an intuitive dashboard. Whether you're a day trader, swing trader, or long-term investor, this enhanced indicator provides a comprehensive and actionable view of market trends.
The combination of enhanced signal accuracy, dynamic trend visualization, and in-depth customization ensures that the Improved Smooth Trend Shot is an indispensable tool for traders across all market conditions.
-Jeffrey

Liquitive Buy/Sell Dollar AveragerLiquitive Buy/Sell Dollar Averager Indicator
The "Liquitive Buy/Sell Dollar Averager" is a versatile trading tool designed for intraday and multi-timeframe analysis, combining advanced range-bound calculations, RSI normalization, volume spikes, and candle pattern recognition to identify optimal buy and sell conditions. This indicator is particularly suitable for traders employing strategies that focus on dollar-cost averaging, position scaling, and systematic buy/sell decision-making.
Key Features:
Adaptive RSI-Based Levels:
Dynamically calculates inner bounds (IB) and outer bounds (OB) using RSI and price ranges, helping to identify overbought and oversold conditions relative to the price action.
Normalizes RSI values to the price range for seamless visualization overlaid on the chart.
Volume and Candle Analysis:
Detects significant volume spikes relative to a moving average, signaling increased market activity.
Identifies spiking green/red candles to capture momentum-driven price movements.
Dynamic Support and Resistance:
Calculates and plots support and resistance levels based on recent swing highs and lows.
Median and boundary lines help visualize key price levels for decision-making.
Profitability Check:
Buy and Sell Signals:
Checks profitability thresholds based on percentage gains/losses.
Incorporates logic for "time to buy" and "time to sell" using target profit margins.
Implements average move percentage to define realistic thresholds for buy/sell actions.
Time-Based Trading Restrictions:
Configures trading logic to disallow trades after a specific time (e.g., 3:40 PM for intraday sessions).
Ensures logical entry and exit decisions are only made within active trading hours.
Color-Coded Visualization:
Background colors dynamically shift between green (bullish), red (bearish), and neutral, depending on RSI and price position relative to the inner bounds.
Opacity of the background adjusts based on normalized RSI differences to provide a visual cue of market strength.
Customizable Parameters:
Allows user input for key settings like lookback periods, RSI length, percent ranges, volume thresholds, and transparency levels, enabling flexible configuration tailored to individual strategies.
Actionable Alerts and Signals:
Plots "Open Position", "Add to Position", and "Close Position" markers directly on the chart, making it easy to follow systematic trading rules.
How It Works:
Buy Signals:
Triggered when price conditions, volume spikes, and RSI-based thresholds align with profitability metrics.
Designed for dollar-cost averaging, identifying opportunities to add to long positions or open new positions.
Sell Signals:
Evaluates profitability conditions to identify when to close or scale out of positions.
Incorporates real-time evaluation of market momentum and profitability.

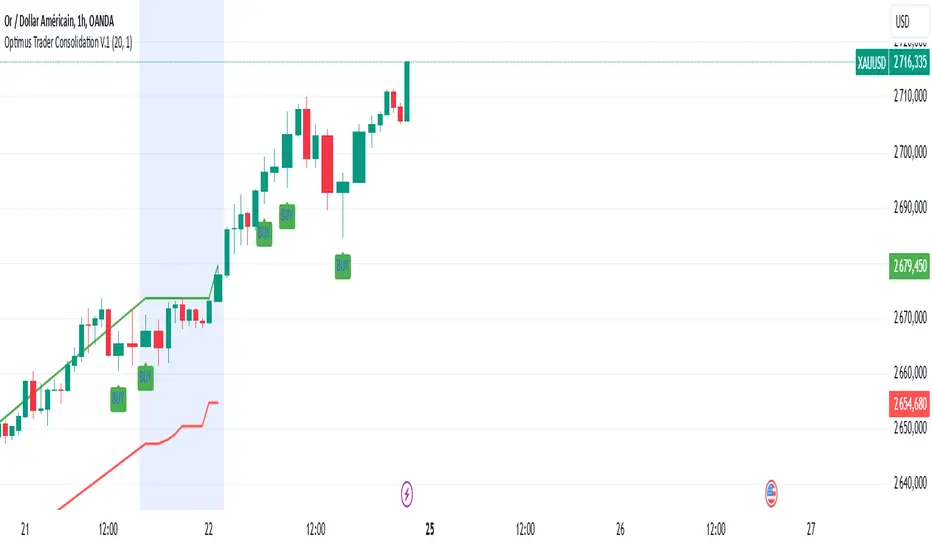
Optimus Trader Consolidation V.1 Indicator Description: "Optimus Trader Consolidation V.1"
This Pine Script indicator is designed to assist traders by identifying key market conditions, including **trend direction**, **volume dynamics**, **liquidity zones**, and **consolidation periods**, alongside candlestick patterns like **Pin Bars** and **Inside Bars**. It provides clear buy and sell signals based on a confluence of these factors. Here’s a detailed breakdown of its functionality:
---
Key Features:
1. **Moving Average (MA) and VWAP Integration**:
- The indicator uses a 50-period Simple Moving Average (SMA) and VWAP (Volume Weighted Average Price) to identify the market trend.
- **Uptrend**: Price is above both the MA and VWAP.
- **Downtrend**: Price is below both the MA and VWAP.
2. **Volume Threshold**:
- A dynamic volume threshold is calculated based on the 20-period SMA of volume, multiplied by a factor of 1.2.
- This ensures signals are filtered to consider only significant volume spikes, avoiding noise from low-volume periods.
3. **Pin Bar Detection**:
- Identifies bullish and bearish Pin Bars based on candlestick characteristics:
- **Bullish Pin Bar**: Large wick above the body, small lower wick, and a green body.
- **Bearish Pin Bar**: Large wick below the body, small upper wick, and a red body.
4. **Inside Bar Detection**:
- Detects Inside Bars, where the current candle’s high and low are fully contained within the previous candle’s range.
- Indicates a period of indecision or potential breakout zones.
5. **Liquidity Zone Identification**:
- Uses recent 20-period highs and lows to approximate liquidity zones.
- Highlights areas where price is near these zones, indicating potential support or resistance.
6. **Buy and Sell Signal Generation**:
- **Buy Signal**: Triggered when a bullish Pin Bar or Inside Bar occurs in an uptrend, with high volume, and near liquidity zones.
- **Sell Signal**: Triggered when a bearish Pin Bar or Inside Bar occurs in a downtrend, with high volume, and near liquidity zones.
- Signals are visually plotted with green (BUY) and red (SELL) markers.
7. **Consolidation Zone Detection**:
- Identifies periods of low price range volatility using a user-defined period (`length`) and range threshold (`range_threshold` in %).
- Highlights periods where the price range is less than the threshold, visually marking consolidation zones.
- Upper and lower boundaries of consolidation zones are plotted with green and red lines, respectively.
8. **Visual Enhancements**:
- Consolidation zones are shaded with a blue background to make them easily recognizable.
- Clear markers for buy and sell signals help traders quickly spot opportunities.
---
Use Cases:
- **Trend Confirmation**: By integrating MA, VWAP, and volume analysis, this indicator helps confirm trends before entering trades.
- **Liquidity Zone Trading**: Identifies price areas where support or resistance may lead to significant price movement.
- **Consolidation Breakouts**: Highlights consolidation zones, which often precede explosive moves, allowing traders to anticipate breakouts.
- **Candlestick Reversal Patterns**: Pin Bars and Inside Bars are powerful patterns that provide early indications of potential reversals or continuation setups.
---
Customizable Parameters:
- **MA Period**: Length of the moving average (default: 50).
- **Volume Threshold**: Sensitivity to volume spikes (default: 20-period SMA × 1.2).
- **Consolidation Period**: Lookback period for identifying consolidation (default: 20).
- **Consolidation Range Threshold**: Maximum percentage range considered as consolidation (default: 1%).
---
Visualization:
- **Green BUY Signals**: Bullish opportunities based on confluence of patterns, trends, and volume.
- **Red SELL Signals**: Bearish opportunities under similar conditions.
- **Consolidation Zones**: Marked by shaded blue backgrounds and clear horizontal lines for high and low boundaries.
- **Dynamic Levels**: Liquidity zones (highs and lows) plotted for added context.
---
Advantages:
- **Confluence of Factors**: Combines trend, volume, and candlestick analysis for robust signal generation.
- **Market State Detection**: Effectively identifies consolidation and breakout conditions.
- **Customizable**: Users can fine-tune parameters for different instruments or trading styles.
---
This indicator is ideal for traders seeking a comprehensive tool to navigate market conditions with precision, leveraging multiple layers of analysis in a single, easy-to-use overlay.
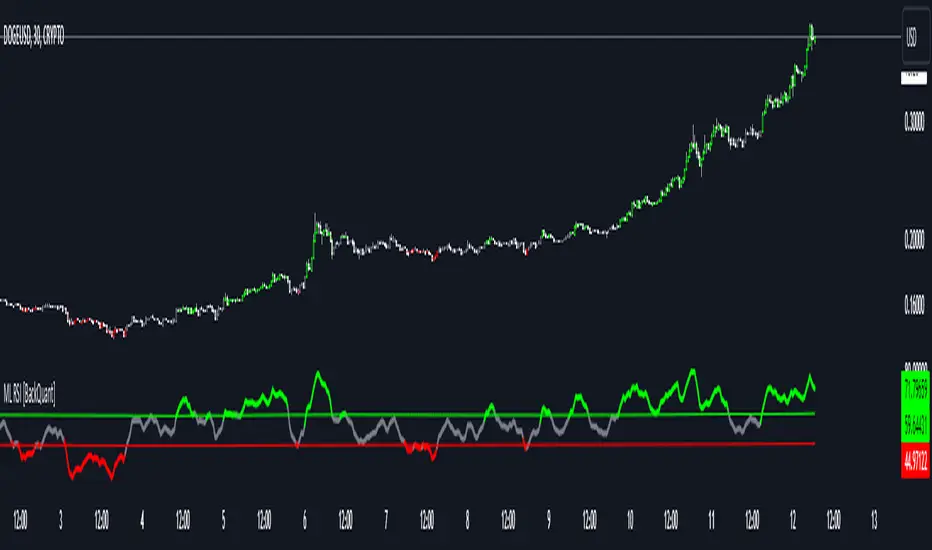
Machine Learning RSI [BackQuant]Machine Learning RSI
The Machine Learning RSI is a cutting-edge trading indicator that combines the power of Relative Strength Index (RSI) with Machine Learning (ML) clustering techniques to dynamically determine overbought and oversold thresholds. This advanced indicator adapts to market conditions in real-time, offering traders a robust tool for identifying optimal entry and exit points with increased precision.
Core Concept: Relative Strength Index (RSI)
The RSI is a well-known momentum oscillator that measures the speed and change of price movements, oscillating between 0 and 100. Typically, RSI values above 70 are considered overbought, and values below 30 are considered oversold. However, static thresholds may not be effective in all market conditions.
This script enhances the RSI by integrating a dynamic thresholding system powered by Machine Learning clustering, allowing it to adapt thresholds based on historical RSI behavior and market context.
Machine Learning Clustering for Dynamic Thresholds
The Machine Learning (ML) component uses clustering to calculate dynamic thresholds for overbought and oversold levels. Instead of relying on fixed RSI levels, this indicator clusters historical RSI values into three groups using a percentile-based initialization and iterative optimization:
Cluster 1: Represents lower RSI values (typically associated with oversold conditions).
Cluster 2: Represents mid-range RSI values.
Cluster 3: Represents higher RSI values (typically associated with overbought conditions).
Dynamic thresholds are determined as follows:
Long Threshold: The upper centroid value of Cluster 3.
Short Threshold: The lower centroid value of Cluster 1.
This approach ensures that the indicator adapts to the current market regime, providing more accurate signals in volatile or trending conditions.
Smoothing Options for RSI
To further enhance the effectiveness of the RSI, this script allows traders to apply various smoothing methods to the RSI calculation, including:
Simple Moving Average (SMA)
Exponential Moving Average (EMA)
Weighted Moving Average (WMA)
Hull Moving Average (HMA)
Linear Regression (LINREG)
Double Exponential Moving Average (DEMA)
Triple Exponential Moving Average (TEMA)
Adaptive Linear Moving Average (ALMA)
T3 Moving Average
Traders can select their preferred smoothing method and adjust the smoothing period to suit their trading style and market conditions. The option to smooth the RSI reduces noise and makes the indicator more reliable for detecting trends and reversals.
Long and Short Signals
The indicator generates long and short signals based on the relationship between the RSI value and the dynamic thresholds:
Long Signals: Triggered when the RSI crosses above the long threshold, signaling bullish momentum.
Short Signals: Triggered when the RSI falls below the short threshold, signaling bearish momentum.
These signals are dynamically adjusted to reflect real-time market conditions, making them more robust than static RSI signals.
Visualization and Clustering Insights
The Machine Learning RSI provides an intuitive and visually rich interface, including:
RSI Line: Plotted in real-time, color-coded based on its position relative to the dynamic thresholds (green for long, red for short, gray for neutral).
Dynamic Threshold Lines: The script plots the long and short thresholds calculated by the ML clustering process, providing a clear visual reference for overbought and oversold levels.
Cluster Plots: Each RSI cluster is displayed with distinct colors (green, orange, and red) to give traders insights into how RSI values are grouped and how the dynamic thresholds are derived.
Customization Options
The Machine Learning RSI is highly customizable, allowing traders to tailor the indicator to their preferences:
RSI Settings : Adjust the RSI length, source price, and smoothing method to match your trading strategy.
Threshold Settings : Define the range and step size for clustering thresholds, allowing you to fine-tune the clustering process.
Optimization Settings : Control the performance memory, maximum clustering steps, and maximum data points for ML calculations to ensure optimal performance.
UI Settings : Customize the appearance of the RSI plot, dynamic thresholds, and cluster plots. Traders can also enable or disable candle coloring based on trend direction.
Alerts and Automation
To assist traders in staying on top of market movements, the script includes alert conditions for key events:
Long Signal: When the RSI crosses above the long threshold.
Short Signal: When the RSI crosses below the short threshold.
These alerts can be configured to notify traders in real-time, enabling timely decisions without constant chart monitoring.
Trading Applications
The Machine Learning RSI is versatile and can be applied to various trading strategies, including:
Trend Following: By dynamically adjusting thresholds, this indicator is effective in identifying and following trends in real-time.
Reversal Trading: The ML clustering process helps identify extreme RSI levels, offering reliable signals for reversals.
Range-Bound Trading: The dynamic thresholds adapt to market conditions, making the indicator suitable for trading in sideways markets where static thresholds often fail.
Final Thoughts
The Machine Learning RSI represents a significant advancement in RSI-based trading indicators. By integrating Machine Learning clustering techniques, this script overcomes the limitations of static thresholds, providing dynamic, adaptive signals that respond to market conditions in real-time. With its robust visualization, customizable settings, and alert capabilities, this indicator is a powerful tool for traders seeking to enhance their momentum analysis and improve decision-making.
As always, thorough backtesting and integration into a broader trading strategy are recommended to maximize the effectiveness!
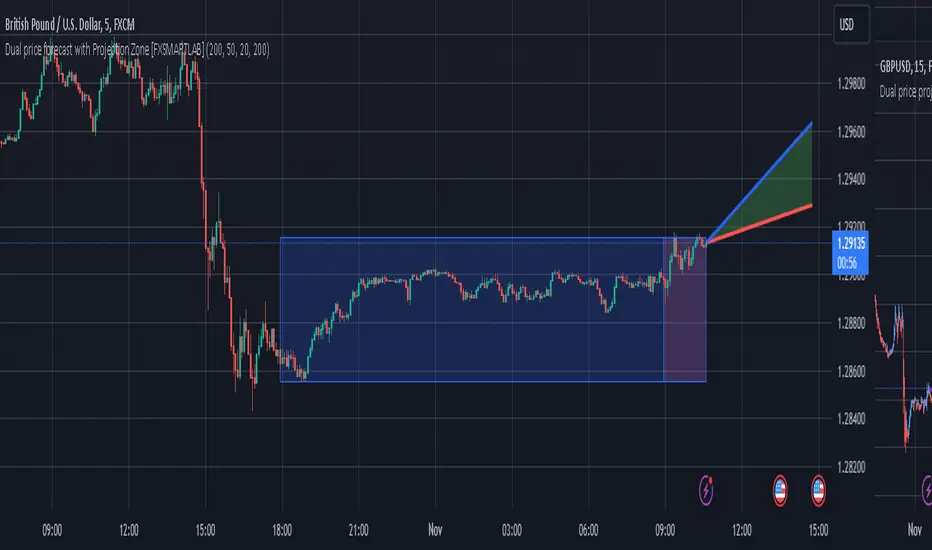
Dual price forecast with Projection Zone [FXSMARTLAB]The Dual Price Forecast with Projection Zone indicator is built to simulate potential future price paths based on historical price movements over two defined lookback periods. By running multiple trials (or simulations) on these historical price movements, the indicator achieves a more robust forecast, incorporating the inherent variability of price behavior.
Key Components and Calculation Details
1. Lookback Periods and Historical Price Movements
Lookback Period 1 and Lookback Period 2 specify the range of past data used to generate each projection. For each period, the indicator calculates the price variations (differences between the closing and opening prices) and stores these in arrays.
These historical price variations capture the volatility and price patterns within each period, serving as templates for future price behavior.
2. Trials: Purpose and Function
The trials are a critical element in the projection calculation. Each trial represents a single simulation of possible future price movements, derived from a random reordering of the historical price variations in each lookback period.
By running multiple trials , the indicator explores various sequences of historical movements, simulating different possible future paths. Each trial adds to the projection’s robustness by capturing a unique potential price path based on past behavior.
Running these multiple trials allows the indicator to account for randomness in price behavior, making the projections more comprehensive by covering a range of scenarios rather than relying on a single deterministic forecast.
3. Reverse Option
The reverse option allows the indicator to invert the direction of price movements within each lookback period. When enabled, historical uptrends are treated as downtrends, and vice versa.
This feature is particularly valuable in scenarios where traders expect a potential reversal in market direction. By enabling the reverse option, the indicator can simulate what might happen if past trends inverted, providing an alternative forecast path that considers possible market reversals.
This allows traders to assess both continuation and reversal scenarios, giving them a more balanced view of potential future price paths and helping them prepare for either market direction.
4. Generating the Average Projection Path
Once the trials are complete, the indicator calculates an average projected price path for each lookback period by averaging the results of all trials. This average represents the most likely price trend based on historical data and provides a smoothed projection that mitigates extreme outliers.
By averaging across all trial paths, the indicator generates a more reliable and balanced forecast line, smoothing out the fluctuations that might appear if only one trial or a small number of trials were used.
5. Projection Zone Visualization
The indicator plots the two average projection paths (one for each lookback period) as Projection 1 and Projection 2, each in a user-defined color.
The Projection Zone is the area between these two lines, filled with a semi-transparent color. This zone visually represents the potential range of future price movement, highlighting where prices are likely to oscillate if historical trends persist.
The Projection Zone effectively functions as a potential support and resistance boundary, providing traders with a visual reference for possible price fluctuations within a specific range.
6. Display of Lookback Zones
To give context to the projections, the indicator can also display colored lookback zones on the chart. These zones correspond to Lookback Period 1 and Lookback Period 2 and are color-coded to match their respective projection lines.
These zones allow traders to see the sections of historical data used in the calculation, helping them understand which past price behaviors influenced the current projections.
Benefits of the Indicator
The "Dual Price Forecast with Projection Zone" indicator provides a multi-scenario forecast based on past price dynamics. Its use of trials ensures that projections are not based on a single deterministic path but on a range of possible scenarios that better reflect the inherent randomness in financial markets.
By generating a probabilistic forecast within a defined zone, the indicator helps traders to:
Anticipate potential price ranges and areas of support/resistance based on historical trends.
Understand the influence of different timeframes (short-term and long-term lookbacks) on future price behavior.
Make informed decisions by visualizing the likely variability of future prices within a controlled projection zone.
Prepare for both continuation and reversal scenarios, thanks to the reverse option. This feature is especially useful in markets where trends may change direction, as it allows traders to explore what might happen
PDF Smoothed Moving Average [BackQuant]PDF Smoothed Moving Average
Introducing BackQuant’s PDF Smoothed Moving Average (PDF-MA) — an innovative trading indicator that applies Probability Density Function (PDF) weighting to moving averages, creating a unique, trend-following tool that offers adaptive smoothing to price movements. This advanced indicator gives traders an edge by blending PDF-weighted values with conventional moving averages, helping to capture trend shifts with enhanced clarity.
Core Concept: Probability Density Function (PDF) Smoothing
The Probability Density Function (PDF) provides a mathematical approach to applying adaptive weighting to data points based on a specified variance and mean. In the PDF-MA indicator, the PDF function is used to weight price data, adding a layer of probabilistic smoothing that enhances the detection of trend strength while reducing noise.
The PDF weights are controlled by two key parameters:
Variance: Determines the spread of the weights, where higher values spread out the weighting effect, providing broader smoothing.
Mean : Centers the weights around a particular price value, influencing the trend’s directionality and sensitivity.
These PDF weights are applied to each price point over the chosen period, creating an adaptive and smooth moving average that more closely reflects the underlying price trend.
Blending PDF with Standard Moving Averages
To further improve the PDF-MA, this indicator combines the PDF-weighted average with a traditional moving average, selected by the user as either an Exponential Moving Average (EMA) or Simple Moving Average (SMA). This blended approach leverages the strengths of each method: the responsiveness of PDF smoothing and the robustness of conventional moving averages.
Smoothing Method: Traders can choose between EMA and SMA for the additional moving average layer. The EMA is more responsive to recent prices, while the SMA provides a consistent average across the selected period.
Smoothing Period: Controls the length of the lookback period, affecting how sensitive the average is to price changes.
The result is a PDF-MA that provides a reliable trend line, reflecting both the PDF weighting and traditional moving average values, ideal for use in trend-following and momentum-based strategies.
Trend Detection and Candle Coloring
The PDF-MA includes a built-in trend detection feature that dynamically colors candles based on the direction of the smoothed moving average:
Uptrend: When the PDF-MA value is increasing, the trend is considered bullish, and candles are colored green, indicating potential buying conditions.
Downtrend: When the PDF-MA value is decreasing, the trend is considered bearish, and candles are colored red, signaling potential selling or shorting conditions.
These color-coded candles provide a quick visual reference for the trend direction, helping traders make real-time decisions based on the current market trend.
Customization and Visualization Options
This indicator offers a range of customization options, allowing traders to tailor it to their specific preferences and trading environment:
Price Source : Choose the price data for calculation, with options like close, open, high, low, or HLC3.
Variance and Mean : Fine-tune the PDF weighting parameters to control the indicator’s sensitivity and responsiveness to price data.
Smoothing Method : Select either EMA or SMA to customize the conventional moving average layer used in conjunction with the PDF.
Smoothing Period : Set the lookback period for the moving average, with a longer period providing more stability and a shorter period offering greater sensitivity.
Candle Coloring : Enable or disable candle coloring based on trend direction, providing additional clarity in identifying bullish and bearish phases.
Trading Applications
The PDF Smoothed Moving Average can be applied across various trading strategies and timeframes:
Trend Following : By smoothing price data with PDF weighting, this indicator helps traders identify long-term trends while filtering out short-term noise.
Reversal Trading : The PDF-MA’s trend coloring feature can help pinpoint potential reversal points by showing shifts in the trend direction, allowing traders to enter or exit positions at optimal moments.
Swing Trading : The PDF-MA provides a clear trend line that swing traders can use to capture intermediate price moves, following the trend direction until it shifts.
Final Thoughts
The PDF Smoothed Moving Average is a highly adaptable indicator that combines probabilistic smoothing with traditional moving averages, providing a nuanced view of market trends. By integrating PDF-based weighting with the flexibility of EMA or SMA smoothing, this indicator offers traders an advanced tool for trend analysis that adapts to changing market conditions with reduced lag and increased accuracy.
Whether you’re trading trends, reversals, or swings, the PDF-MA offers valuable insights into the direction and strength of price movements, making it a versatile addition to any trading strategy.
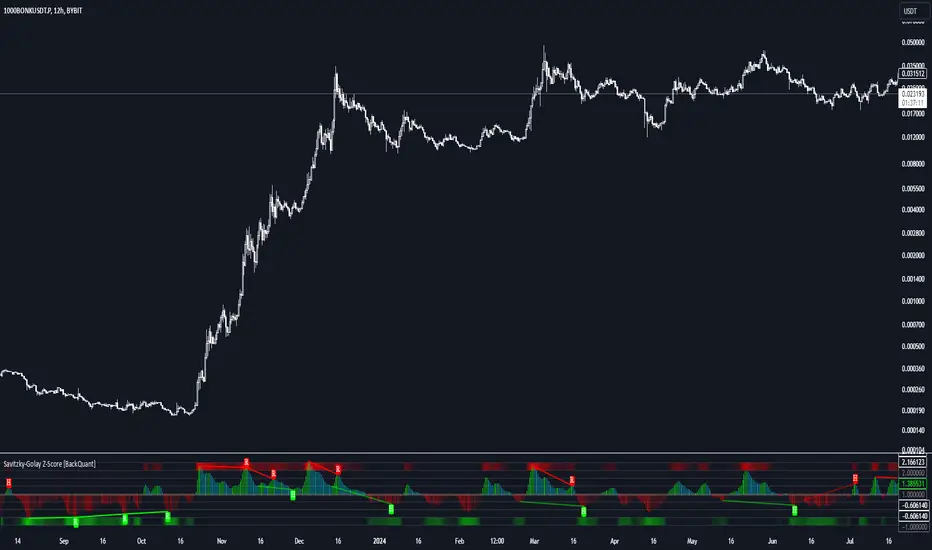
Savitzky-Golay Z-Score [BackQuant]Savitzky-Golay Z-Score
The Savitzky-Golay Z-Score is a powerful trading indicator that combines the precision of the Savitzky-Golay filter with the statistical strength of the Z-Score. This advanced indicator is designed to detect trend shifts, identify overbought or oversold conditions, and highlight potential divergences in the market, providing traders with a unique edge in detecting momentum changes and trend reversals.
Core Concept: Savitzky-Golay Filter
The Savitzky-Golay filter is a widely-used smoothing technique that preserves important signal features such as peak detection while filtering out noise. In this indicator, the filter is applied to price data (default set to HLC3) to smooth out volatility and produce a cleaner trend line. By specifying the window size and polynomial degree, traders can fine-tune the degree of smoothing to match their preferred trading style or market conditions.
Z-Score: Measuring Deviation
The Z-Score is a statistical measure that indicates how far the current price is from its mean in terms of standard deviations. In trading, the Z-Score can be used to identify extreme price moves that are likely to revert or continue trending. A positive Z-Score means the price is above the mean, while a negative Z-Score indicates the price is below the mean.
This script calculates the Z-Score based on the Savitzky-Golay filtered price, enabling traders to detect moments when the price is diverging from its typical range and may present an opportunity for a trade.
Long and Short Conditions
The Savitzky-Golay Z-Score generates clear long and short signals based on the Z-Score value:
Long Signals : When the Z-Score is positive, indicating the price is above its smoothed mean, a long signal is generated. The color of the bars turns green, signaling upward momentum.
Short Signals : When the Z-Score is negative, indicating the price is below its smoothed mean, a short signal is generated. The bars turn red, signaling downward momentum.
These signals allow traders to follow the prevailing trend with confidence, using statistical backing to avoid false signals from short-term volatility.
Standard Deviation Levels and Extreme Levels
This indicator includes several features to help visualize overbought and oversold conditions:
Standard Deviation Levels: The script plots horizontal lines at +1, +2, -1, and -2 standard deviations. These levels provide a reference for how far the current price is from the mean, allowing traders to quickly identify when the price is moving into extreme territory.
Extreme Levels: Additional extreme levels at +3 and +4 (and their negative counterparts) are plotted to highlight areas where the price is highly likely to revert. These extreme levels provide important insight into market conditions that are far outside the norm, signaling caution or potential reversal zones.
The indicator also adapts the color shading of these extreme zones based on the Z-Score’s strength. For example, the area between +3 and +4 is shaded with a stronger color when the Z-Score approaches these values, giving a visual representation of market pressure.
Divergences: Detecting Hidden and Regular Signals
A key feature of the Savitzky-Golay Z-Score is its ability to detect bullish and bearish divergences, both regular and hidden:
Regular Bullish Divergence: This occurs when the price makes a lower low while the Z-Score forms a higher low. It signals that bearish momentum is weakening, and a bullish reversal could be near.
Hidden Bullish Divergence: This divergence occurs when the price makes a higher low while the Z-Score forms a lower low. It signals that bullish momentum may continue after a temporary pullback.
Regular Bearish Divergence: This occurs when the price makes a higher high while the Z-Score forms a lower high, signaling that bullish momentum is weakening and a bearish reversal may be near.
Hidden Bearish Divergence: This divergence occurs when the price makes a lower high while the Z-Score forms a higher high, indicating that bearish momentum may continue after a temporary rally.
These divergences are plotted directly on the chart, making it easier for traders to spot when the price and momentum are out of sync and when a potential reversal may occur.
Customization and Visualization
The Savitzky-Golay Z-Score offers a range of customization options to fit different trading styles:
Window Size and Polynomial Degree: Adjust the window size and polynomial degree of the Savitzky-Golay filter to control how much smoothing is applied to the price data.
Z-Score Lookback Period: Set the lookback period for calculating the Z-Score, allowing traders to fine-tune the sensitivity to short-term or long-term price movements.
Display Options: Choose whether to display standard deviation levels, extreme levels, and divergence labels on the chart.
Bar Color: Color the price bars based on trend direction, with green for bullish trends and red for bearish trends, allowing traders to easily visualize the current momentum.
Divergences: Enable or disable divergence detection, and adjust the lookback periods for pivots used to detect regular and hidden divergences.
Alerts and Automation
To ensure you never miss an important signal, the indicator includes built-in alert conditions for the following events:
Positive Z-Score (Long Signal): Triggers an alert when the Z-Score crosses above zero, indicating a potential buying opportunity.
Negative Z-Score (Short Signal): Triggers an alert when the Z-Score crosses below zero, signaling a potential short opportunity.
Shifting Momentum: Alerts when the Z-Score is shifting up or down, providing early warning of changing market conditions.
These alerts can be configured to notify you via email, SMS, or app notification, allowing you to stay on top of the market without having to constantly monitor the chart.
Trading Applications
The Savitzky-Golay Z-Score is a versatile tool that can be applied across multiple trading strategies:
Trend Following: By smoothing the price and calculating the Z-Score, this indicator helps traders follow the prevailing trend while avoiding false signals from short-term volatility.
Mean Reversion: The Z-Score highlights moments when the price is far from its mean, helping traders identify overbought or oversold conditions and capitalize on potential reversals.
Divergence Trading: Regular and hidden divergences between the Z-Score and price provide early warning of trend reversals, allowing traders to enter trades at opportune moments.
Final Thoughts
The Savitzky-Golay Z-Score is an advanced statistical tool designed to provide a clearer view of market trends and momentum. By applying the Savitzky-Golay filter and Z-Score analysis, this indicator reduces noise and highlights key areas where the market may reverse or accelerate, giving traders a significant edge in understanding price behavior.
Whether you’re a trend follower or a reversal trader, this indicator offers the flexibility and insights you need to navigate complex markets with confidence.