OPEN-SOURCE SCRIPT
FED Rate Decisions (Cuts & Hikes)
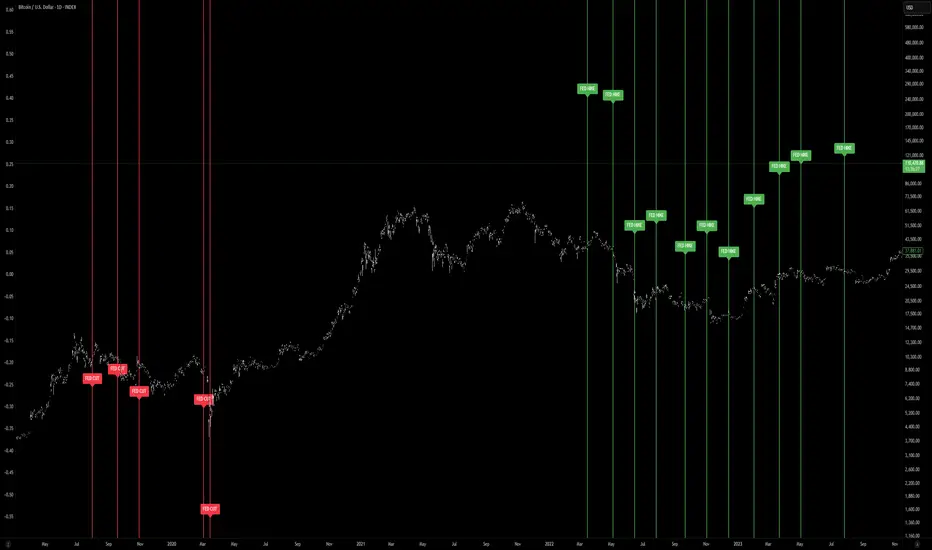
This indicator highlights key moments in U.S. monetary policy by plotting vertical lines on the chart for Federal Reserve interest rate decisions.
Features:
Rate Cuts (red): Marks dates when the Fed reduced interest rates.
Rate Hikes (green): Marks dates when the Fed increased interest rates.
Configurable view: Choose between showing all historical decisions or only those from 2019 onwards.
Labels: Each event is tagged with “FED CUT” or “FED HIKE” above or below the bar (adjustable).
Alerts: You can set TradingView alerts to be notified when the chart reaches a Fed decision day.
🔧 Inputs:
Show decisions: Switch between All or 2019+ events.
Show rate cuts / hikes: Toggle visibility separately.
Colors: Customize line and label colors.
Label position: Place labels above or below the bar.
📈 Usage:
This tool helps traders and investors visualize how Fed policy shifts align with market movements. Rate cuts often signal economic easing, while hikes suggest tightening monetary policy. By overlaying these events on price charts, you can analyze historical reactions and prepare for similar scenarios.
Script de código aberto
Em verdadeiro espírito do TradingView, o criador deste script o tornou de código aberto, para que os traders possam revisar e verificar sua funcionalidade. Parabéns ao autor! Embora você possa usá-lo gratuitamente, lembre-se de que a republicação do código está sujeita às nossas Regras da Casa.
Aviso legal
As informações e publicações não se destinam a ser, e não constituem, conselhos ou recomendações financeiras, de investimento, comerciais ou de outro tipo fornecidos ou endossados pela TradingView. Leia mais nos Termos de Uso.