PROTECTED SOURCE SCRIPT
Volatility Rank Dashboard
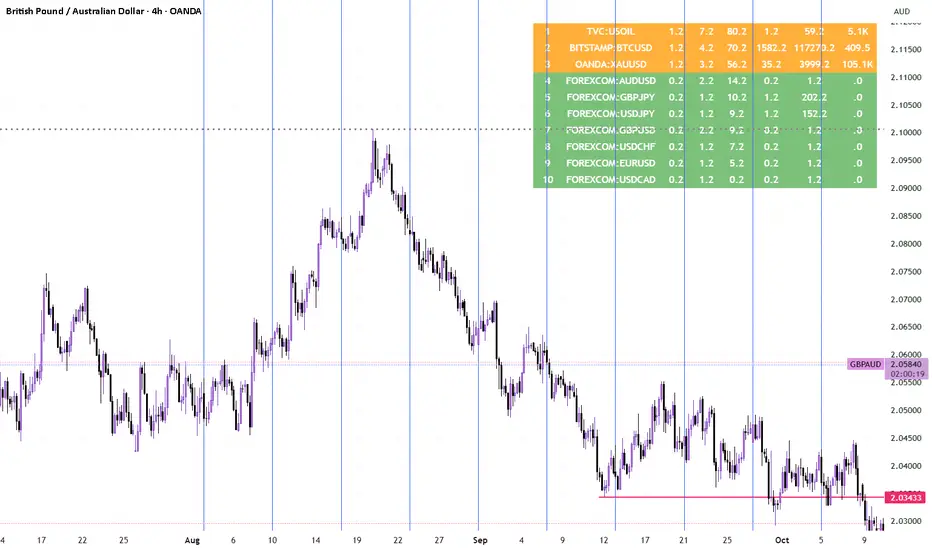
A dynamic multi-symbol dashboard that ranks assets live by their normalized volatility across multiple dimensions.
How it works:
The script scans up to 40 symbols (per TradingView request limits), calculating for each:
ATR% – average true range as a percentage of price (true volatility)
BB Width% – Bollinger Band width as relative spread (market compression/expansion)
Volume or Notional – filters or weights activity by liquidity
A composite volatility score is computed using adjustable weights (ATR%, BB%, Volume).
Symbols are ranked in real time on a color-coded table, highlighting the most volatile and active markets.
Extra features:
Session filter (London, New York, or custom trading hours)
Alerts for ATR% / BB% threshold cross or when a new #1 appears
Automatic 40-request safety management
Adaptive color heat map for instant visual comparison
Use it to quickly identify which assets are moving, liquid, and worth your attention — across any asset class or timeframe.
Script protegido
Esse script é publicada como código fechado. No entanto, você pode usar ele livremente e sem nenhuma limitação – saiba mais aqui.
Aviso legal
As informações e publicações não devem ser e não constituem conselhos ou recomendações financeiras, de investimento, de negociação ou de qualquer outro tipo, fornecidas ou endossadas pela TradingView. Leia mais em Termos de uso.