PROTECTED SOURCE SCRIPT
% Away from x DMA
% Away from X DMA
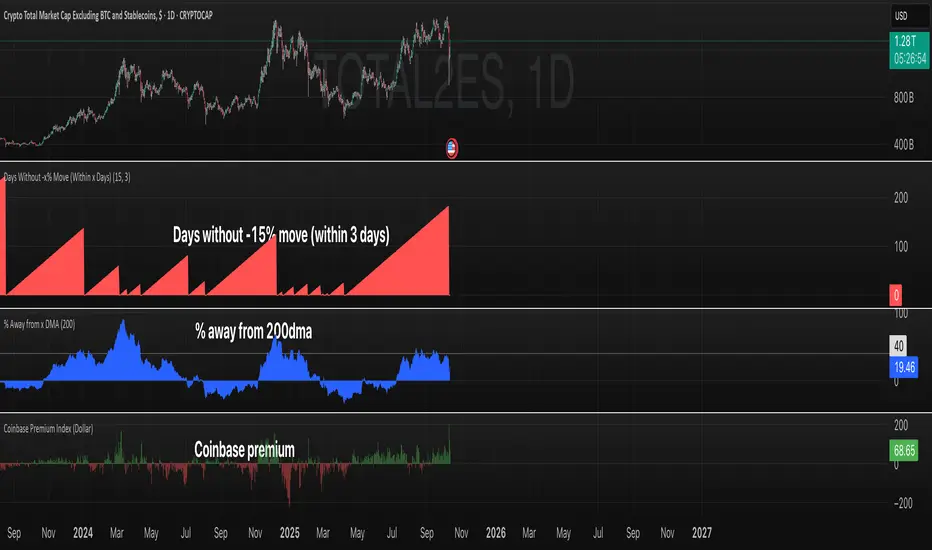
This indicator measures how far the current price is from a chosen moving average, expressed as a percentage. It helps identify overbought/oversold conditions and
mean reversion opportunities.
How It Works:
- Calculates a Simple Moving Average (SMA) for the specified period
- Measures the percentage distance between current price and the moving average
- Positive values indicate price is above the average
- Negative values indicate price is below the average
Key Features:
- Flexible Period: Customize the moving average length (default: 200 DMA)
- Percentage-Based: Standardized measurement works across all price ranges
- Visual Clarity: Blue area plot makes deviations easy to spot
- Universal Application: Works with any asset or timeframe
Trading Applications:
- Mean Reversion: Extreme values often precede reversals back to the mean
- Trend Strength: Large positive values indicate strong uptrends
- Support/Resistance: Major moving averages act as dynamic support/resistance
- Entry Timing: Buy dips when significantly below, sell rallies when extended above
- Risk Management: Avoid entries during extreme deviations
Common Settings:
- 20 DMA: Short-term trend and swing trading
- 50 DMA: Intermediate trend analysis
- 200 DMA: Long-term trend and major support/resistance (default)
Interpretation Guidelines:
- +/-5-10%: Normal price action
- +/-10-20%: Extended move, caution warranted
- +/-20%+: Extreme deviation, high probability mean reversion setup
Ideal for swing traders, mean reversion strategies, and identifying optimal entry/exit points relative to trend.
Script protegido
Esse script é publicada como código fechado. No entanto, você pode gerenciar suas escolhas de bate-papo. Por favor, abra suas Configurações do perfil
Aviso legal
As informações e publicações não se destinam a ser, e não constituem, conselhos ou recomendações financeiras, de investimento, comerciais ou de outro tipo fornecidos ou endossados pela TradingView. Leia mais nos Termos de Uso.