OPEN-SOURCE SCRIPT
Atualizado Parabolic SAR Waves [MMA]
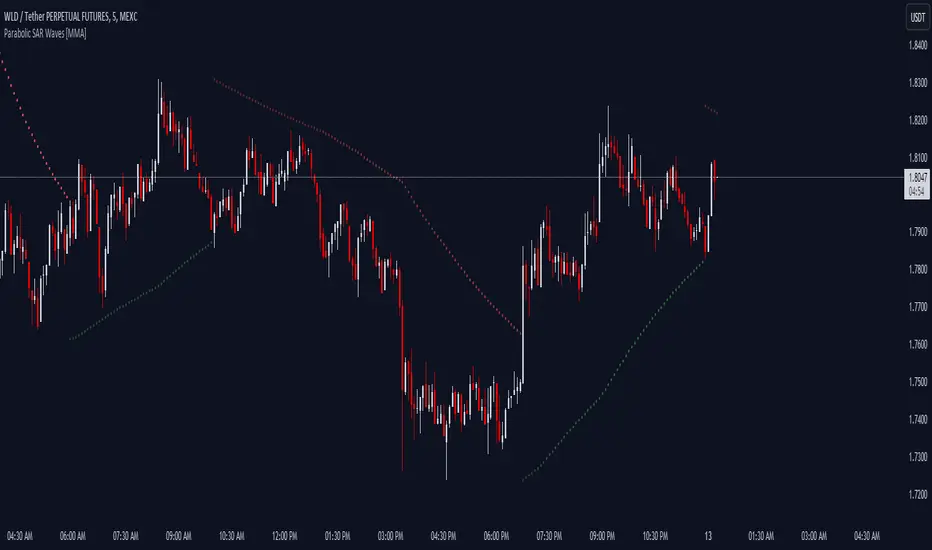
Parabolic SAR Waves [MMA]
Description:
The "Parabolic SAR Waves [MMA]" is an advanced version of the traditional Parabolic SAR indicator, customized for TradingView. This script incorporates dynamic acceleration factors and optional gradient coloration to enhance visual interpretation and utility for traders aiming to accurately capture trends and predict potential reversals.
Features:
- Dynamic Acceleration: Adjust the initial, incremental, and maximum values of the acceleration factor to suit various market conditions and trading preferences.
- Gradient Coloring: Use gradient colors to indicate the strength and stability of the trend, providing visual cues that are easy to interpret.
- Trend Visibility: The SAR dots are plotted directly on the price chart, making it easy to spot trend changes and maintain situational awareness.
- Overlay Feature: Designed to overlay directly on the price charts, allowing for seamless integration with other technical analysis tools.
Benefits:
- Trend Detection: Helps in identifying the beginning and potential reversal of trends, aiding in timely decision-making.
- Stop-Loss Management: Utilizes the positions of the SAR dots as dynamic stop-loss points, which helps in risk management.
- Visual Simplicity: Enhances the decision-making process through a straightforward visual representation of trend data.
Parameters:
- Acceleration Start (accel_start): The initial value for the acceleration, set to 0.02 by default.
- Acceleration Increment (accel_inc): The amount by which the acceleration increases, set to 0.005 by default.
- Acceleration Maximum (accel_max): The maximum limit of the acceleration factor, set to 0.1 by default.
- Use Gradient Colors (use_gradient): A boolean toggle to enable or disable gradient coloring, enabled by default.
Indicator Usage:
1. To apply, select this indicator from TradingView's indicator library.
2. Adjust the acceleration parameters based on your specific trading strategy and market analysis.
3. Interpret the indicator signals:
- Green SAR dots below the price bars indicate a bullish trend.
- Red SAR dots above the price bars signify a bearish trend.
- Gradient colors, if enabled, provide insights into the acceleration factor's intensity relative to trend strength.
Alerts:
- Bullish Reversal Alert: Issues a notification if there is a potential upward reversal when the trend shifts to bullish.
- Bearish Reversal Alert: Alerts when there's potential for a downward move as the trend turns bearish.
The "Parabolic SAR Waves [MMA]" is a robust tool, ideal for traders who need precise, customizable trend-following capabilities that integrate seamlessly with other market analysis strategies. Enhance your trading with detailed trend insights and adaptive parameter controls.
Notas de Lançamento
[MMA] Parabolic SAR WavesScript de código aberto
Em verdadeiro espírito do TradingView, o criador deste script o tornou de código aberto, para que os traders possam revisar e verificar sua funcionalidade. Parabéns ao autor! Embora você possa usá-lo gratuitamente, lembre-se de que a republicação do código está sujeita às nossas Regras da Casa.
Aviso legal
As informações e publicações não se destinam a ser, e não constituem, conselhos ou recomendações financeiras, de investimento, comerciais ou de outro tipo fornecidos ou endossados pela TradingView. Leia mais nos Termos de Uso.
Script de código aberto
Em verdadeiro espírito do TradingView, o criador deste script o tornou de código aberto, para que os traders possam revisar e verificar sua funcionalidade. Parabéns ao autor! Embora você possa usá-lo gratuitamente, lembre-se de que a republicação do código está sujeita às nossas Regras da Casa.
Aviso legal
As informações e publicações não se destinam a ser, e não constituem, conselhos ou recomendações financeiras, de investimento, comerciais ou de outro tipo fornecidos ou endossados pela TradingView. Leia mais nos Termos de Uso.