OPEN-SOURCE SCRIPT
Ultimate RSI (14) TD
Burbin's RSI Alerts:
RSI alerts can be used ONLY when you're awaiting a chart to shift it's momentum. Example: You are waiting for a take profit signal and you'd like a push notification when this is triggered.
These are NOT intended to be Buy and Sell signals. Only to get your attention. Pair with other confirmations.
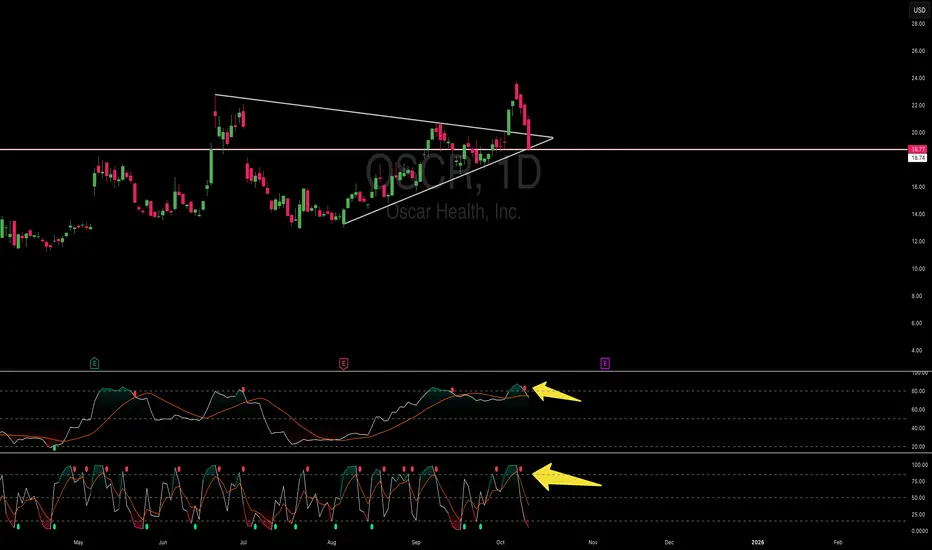
**There are 4 alerts. "RSI Bullish Cross" "RSI Bearish Cross" "RSI Bounce Buy" "RSI Sell".
Both of the Cross alerts can be early. Can be too early. The RSI Bounce Buy and RSI Sell are when the RSI line has crossed back inside the outer bands; from Oversold or Overbought. They are a fairly reliable signal, especially when used with other TA such as support, volume, etc.
Default Overbought is 80, default oversold is 20.
Can be used on multiple timeframes.
This is a modified version of LuxAlgo's Ultimate RSI. This is for education purposes only and personal use by Burbin. Inspired by AA, and dedicated to TD.
LuxAlgo's Description:
The Ultimate RSI indicator is a new oscillator based on the calculation of the Relative Strength Index that aims to put more emphasis on the trend, thus having a less noisy output. Opposite to the regular RSI, this oscillator is designed for a trend trading approach instead of a contrarian one.
🔶 USAGE
While returning the same information as a regular RSI, the Ultimate RSI puts more emphasis on trends, and as such can reach overbought/oversold levels faster as well as staying longer within these areas. This can avoid the common issue of an RSI regularly crossing an overbought or oversold level while the trend makes new higher highs/lower lows.
The Ultimate RSI crossing above the overbought level can be indicative of a strong uptrend (highlighted as a green area), while an Ultimate RSI crossing under the oversold level can be indicative of a strong downtrend (highlighted as a red area).
The Ultimate RSI crossing the 50 midline can also indicate trends, with the oscillator being above indicating an uptrend, else a downtrend. Unlike a regular RSI, the Ultimate RSI will cross the midline level less often, thus generating fewer whipsaw signals.
For even more timely indications users can observe the Ultimate RSI relative to its signal line. An Ultimate RSI above its signal line can indicate it is increasing, while the opposite would indicate it is decreasing.
🔹Smoothing Methods
Users can return more reactive or smoother results depending on the selected smoothing method used for the calculation of the Ultimate RSI. Options include:
Exponential Moving Average (EMA)
Simple Moving Average (SMA)
Wilder's Moving Average (RMA)
Triangular Moving Average (TMA)
These are ranked by the degree of reactivity of each method, with higher ones being more reactive (but less smooth).
Users can also select the smoothing method used by the signal line.
🔶 DETAILS
The RSI returns a normalized exponential average of price changes in the range (0, 100), which can be simply calculated as follows:
ema(d) / ema(|d|) × 50 + 50
🔶 SETTINGS
Length: Calculation period of the indicator
Method: Smoothing method used for the calculation of the indicator.
Source: Input source of the indicator
🔹Signal Line
Smooth: Degree of smoothness of the signal line
Method: Smoothing method used to calculation the signal line.
RSI alerts can be used ONLY when you're awaiting a chart to shift it's momentum. Example: You are waiting for a take profit signal and you'd like a push notification when this is triggered.
These are NOT intended to be Buy and Sell signals. Only to get your attention. Pair with other confirmations.
**There are 4 alerts. "RSI Bullish Cross" "RSI Bearish Cross" "RSI Bounce Buy" "RSI Sell".
Both of the Cross alerts can be early. Can be too early. The RSI Bounce Buy and RSI Sell are when the RSI line has crossed back inside the outer bands; from Oversold or Overbought. They are a fairly reliable signal, especially when used with other TA such as support, volume, etc.
Default Overbought is 80, default oversold is 20.
Can be used on multiple timeframes.
This is a modified version of LuxAlgo's Ultimate RSI. This is for education purposes only and personal use by Burbin. Inspired by AA, and dedicated to TD.
LuxAlgo's Description:
The Ultimate RSI indicator is a new oscillator based on the calculation of the Relative Strength Index that aims to put more emphasis on the trend, thus having a less noisy output. Opposite to the regular RSI, this oscillator is designed for a trend trading approach instead of a contrarian one.
🔶 USAGE
While returning the same information as a regular RSI, the Ultimate RSI puts more emphasis on trends, and as such can reach overbought/oversold levels faster as well as staying longer within these areas. This can avoid the common issue of an RSI regularly crossing an overbought or oversold level while the trend makes new higher highs/lower lows.
The Ultimate RSI crossing above the overbought level can be indicative of a strong uptrend (highlighted as a green area), while an Ultimate RSI crossing under the oversold level can be indicative of a strong downtrend (highlighted as a red area).
The Ultimate RSI crossing the 50 midline can also indicate trends, with the oscillator being above indicating an uptrend, else a downtrend. Unlike a regular RSI, the Ultimate RSI will cross the midline level less often, thus generating fewer whipsaw signals.
For even more timely indications users can observe the Ultimate RSI relative to its signal line. An Ultimate RSI above its signal line can indicate it is increasing, while the opposite would indicate it is decreasing.
🔹Smoothing Methods
Users can return more reactive or smoother results depending on the selected smoothing method used for the calculation of the Ultimate RSI. Options include:
Exponential Moving Average (EMA)
Simple Moving Average (SMA)
Wilder's Moving Average (RMA)
Triangular Moving Average (TMA)
These are ranked by the degree of reactivity of each method, with higher ones being more reactive (but less smooth).
Users can also select the smoothing method used by the signal line.
🔶 DETAILS
The RSI returns a normalized exponential average of price changes in the range (0, 100), which can be simply calculated as follows:
ema(d) / ema(|d|) × 50 + 50
🔶 SETTINGS
Length: Calculation period of the indicator
Method: Smoothing method used for the calculation of the indicator.
Source: Input source of the indicator
🔹Signal Line
Smooth: Degree of smoothness of the signal line
Method: Smoothing method used to calculation the signal line.
Script de código aberto
No verdadeiro espirito do TradingView, o autor desse script o publicou como código aberto, para que os traders possam entendê-lo e verificá-lo. Parabéns ao autor Você pode usá-lo gratuitamente, mas a reutilização desse código em publicações e regida pelas Regras da Casa.
Aviso legal
As informações e publicações não devem ser e não constituem conselhos ou recomendações financeiras, de investimento, de negociação ou de qualquer outro tipo, fornecidas ou endossadas pela TradingView. Leia mais em Termos de uso.