PROTECTED SOURCE SCRIPT
Volume Profile v3.2 [JopAlgo]
Volume Profile v3.2 [JopAlgo] — where the market actually traded, and why that matters
Price shows you where bids and offers met. Volume Profile shows you how much business was done at each price. Put simply: it maps the market’s preference. In any auction, price tends to accept and revisit heavy-traded areas and reject low-participation areas. VP v3.2 turns that logic into a clear picture you can use on any timeframe—from scalps to multi-week swings.
This version focuses on three things that matter in real trading:
a clean, configurable price–volume distribution (your profile),
key levels derived from that distribution (POC, VAH, VAL), and
a POC Shift detector that highlights structural change when the market’s center of mass moves.
If you attach screenshots to your script page, one image should label POC/VAH/VAL and the histogram shape; a second should show a POC Shift during a trend transition.
What you’re seeing (and how to read it)
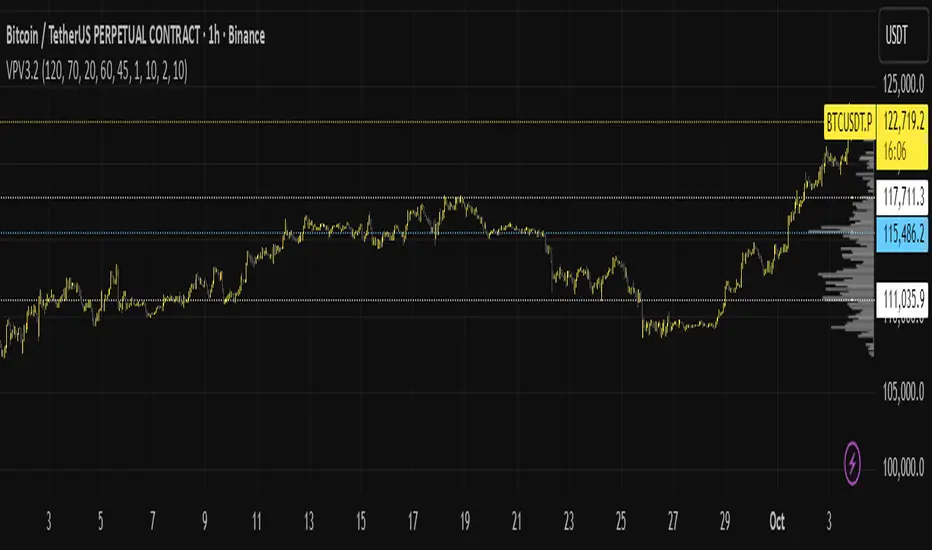
The histogram you see beside price is the profile: each horizontal bar measures traded volume at that price within a chosen range. It reveals:
POC (Point of Control): the single most-traded price in your range (the market’s center of gravity).
Value Area (VA): the price band where a chosen percentage of all volume traded (default 70%). Its boundaries are the VAH (top) and VAL (bottom).
HVNs / LVNs: High-Volume Nodes (bulges) tend to attract price; Low-Volume Nodes (gaps/voids) tend to repel price and act like funnels—price often moves quickly through them, then pauses at the next HVN.
In practice: trade from value edges back to POC in balance, or trade breakouts through LVNs toward the next HVN when the auction is trending.
Choosing the range: Anchored vs Visible
Your range defines the story. VP v3.2 lets you pick it two ways:
Visible Range (default): the profile is built from the bars currently on screen. This adapts as you pan/zoom and is ideal for quick reads and intraday work.
Anchored Range: toggle “Anchored Range” and pick an Anchor Time. Now the profile starts at that timestamp and extends to the most recent bar. Use this for event-based composites (e.g., listing day, policy announcement, ETF approval), weekly/monthly composites, or to study a trend leg in isolation.
Tip: for scalping, a visible range that covers the current session is enough. For swings, anchor to the start of the move, start of the week/month, or the event that changed regime.
Important settings (why they exist, and simple defaults)
Rows: how many price buckets form the histogram. More rows = finer detail, more CPU. Start around 120; go higher when zoomed in.
Value Area %: how much volume should sit inside the VA band. 70% is standard; lower it (e.g., 60–65%) in strong trends to keep VA tight, raise it in dull balance to widen the area you consider “fair.”
Max Width, Horizontal Offset, Row Height %: purely visual—how wide the histogram can draw, how far it sits from the last bar, and how thick each row appears.
Histogram Emphasis: a gentle power curve that makes big nodes pop and tiny nodes fade. Leave at 1.0 until you know why you want more/less contrast.
FAST vs ACCURATE:
FAST puts each bar’s volume into its mid-price bucket. It’s very fast and stable for live trading.
ACCURATE spreads each bar’s volume across its full high-low range. This gives a smoother profile (especially on wide candles) at the cost of more computation.
If your machine lags, use FAST for intraday and ACCURATE when you’re doing end-of-day review.
Plot POC/VA series / Extend Left: draws POC/VAH/VAL as dotted lines and (optionally) extends them left across your chart. Extending is useful when you want those levels to act as “attractors/repellers” beyond the immediate profile.
Theme & Colors: there’s a dark/light toggle so the profile remains readable on any chart theme.
POC Shift — when “fair value” moves
Markets rotate around “fair value.” When that value shifts by a meaningful amount and sticks, the auction has changed. VP v3.2 detects this with three parameters:
Shift Min Ticks: the minimum distance POC must move to count as a new candidate.
Shift Confirm Bars: how many consecutive bars must hold that new area for the shift to be confirmed.
Shift Cooldown: how long to ignore re-triggers after a confirmed shift (avoids spamming in chop).
A POC Shift Up says buyers migrated the center of business higher (typical of an acceptance above prior value). POC Shift Down says the opposite. These are structure events: combine them with your directional tools (e.g., CVDv1’s Absorption/Efficiency read) to avoid chasing when the shift is fragile.
Using Volume Profile on any timeframe
The logic is the same everywhere: trade at value boundaries, target the POC or the next HVN, and respect LVNs as fast-pass corridors.
Scalping (1–5m charts)
Range: Visible; cover the current session or the last 2–4 hours.
Use: Fade VAH→POC and VAL→POC only when the tape supports it (e.g., CVDv1 not showing absorption against you). If price pushes into an LVN, expect fast movement to the other side—don’t fight mid-void.
Intraday (15m–1H)
Range: Visible covering the day, or Anchored to the day’s open.
Use: First seek balance trades (VAL/VAH to POC). When a real POC Shift confirms after a break, switch to trend-following: use pullbacks to prior VA boundaries as entries.
Swing (2H–4H)
Range: Anchored to start of week, start of trend leg, or major event.
Use: Enter on retests of VAL/VAH that hold, target the composite POC/HVNs. If you see sequential POC Shifts in trend direction, it’s a sign to trail rather than constantly fade back to POC.
Position (1D–1W)
Range: Anchored to YTD, quarter, or cycle low/high.
Use: Treat LVNs as structural gaps; acceptance through an LVN often leads to the next HVN. Weekly VA boundaries are strong reference levels; a weekly POC Shift is notable regime information.
How to act at the levels (a simple, durable playbook)
In balance: fade VAL/VAH back to POC—but only if your flow read doesn’t scream “absorption against you.”
In trend: ignore the first touch fade. Wait for acceptance (close outside), then use pullbacks to the broken VA boundary to join.
At LVNs: don’t expect chop. Plan for quick travel to the next HVN, place stops accordingly, and avoid mid-void entries.
Alerts (what they mean, what you do)
Cross POC / VAH / VAL: price just interacted with a key reference. Use your secondary signal (e.g., CVDv1 alignment/absorption) to decide fade vs follow.
POC Shift Up/Down: a structure change just confirmed. In balance, you may flip your bias. In trend, you can add on pullbacks toward the shifted area.
Compatible tools (optional, but powerful)
Volume Profile v3.2 is designed to work cleanly with other [JopAlgo] tools:
Cumulative Volume Delta v1 [JopAlgo] (CVDv1): lets you judge flow quality at VP levels. For example, a poke above VAH with CVD Absorption is a veto to chase—look for a failed breakout or reclaim. A retest of VAL with Imbalance strong and Alignment OK is a higher-quality bounce back to POC.
Weekly AVWAP v3 [JopAlgo]: the market’s mean/anchor. Confluence of Weekly AVWAP with VA boundaries or HVNs creates A-tier levels. Reclaims of Weekly AVWAP near VAL are excellent swing entries; rejections at Weekly AVWAP into VAH are high-quality fades in balance.
(If you post images, one good example is a VAL retest at Weekly AVWAP with CVDv1 showing “Efficient”—that story clicks instantly.)
Practical defaults
Rows: 120
Value Area: 70%
FAST mode for live work; ACCURATE for deep review or wide-range composites
Anchored Range: off (Visible) for intraday; on for weekly/monthly/“since event” studies
POC Shift: start with 10 ticks, 2 confirm bars, 10 cooldown; tighten for very small-tick futures, loosen in highly volatile regimes
Common pitfalls this solves
“Why did it stall here?” Check the profile: you hit an HVN. That’s where business likes to be done. Expect chop or mean-reversion to POC.
“Breakout straight back in.” You broke into an LVN without acceptance; or CVDv1 flagged Absorption. Wait for acceptance, then take the retest.
“Levels feel arbitrary.” POC/VAH/VAL come from where traders actually transacted, not where a simple moving average happens to sit.
Open source & disclaimer
This indicator is published open source so you can learn from it, tune it, and build rules you trust. Trading is risky; no tool eliminates that risk.
Disclaimer — Not Financial Advice.
The “Volume Profile v3.2 [JopAlgo]” indicator and this description are provided for educational purposes only and do not constitute financial or investment advice. Markets involve risk, including possible loss of capital. [JopAlgo] makes no warranties and assumes no responsibility for any trading decisions or outcomes resulting from the use of this script. Past performance is not indicative of future results.
Use VP v3.2 to decide where the market is likely to accept or reject. Then use your flow read (e.g., CVDv1) to decide when to act. That combination—location + flow—is what keeps you on the right side of the auction across any timeframe.
Price shows you where bids and offers met. Volume Profile shows you how much business was done at each price. Put simply: it maps the market’s preference. In any auction, price tends to accept and revisit heavy-traded areas and reject low-participation areas. VP v3.2 turns that logic into a clear picture you can use on any timeframe—from scalps to multi-week swings.
This version focuses on three things that matter in real trading:
a clean, configurable price–volume distribution (your profile),
key levels derived from that distribution (POC, VAH, VAL), and
a POC Shift detector that highlights structural change when the market’s center of mass moves.
If you attach screenshots to your script page, one image should label POC/VAH/VAL and the histogram shape; a second should show a POC Shift during a trend transition.
What you’re seeing (and how to read it)
The histogram you see beside price is the profile: each horizontal bar measures traded volume at that price within a chosen range. It reveals:
POC (Point of Control): the single most-traded price in your range (the market’s center of gravity).
Value Area (VA): the price band where a chosen percentage of all volume traded (default 70%). Its boundaries are the VAH (top) and VAL (bottom).
HVNs / LVNs: High-Volume Nodes (bulges) tend to attract price; Low-Volume Nodes (gaps/voids) tend to repel price and act like funnels—price often moves quickly through them, then pauses at the next HVN.
In practice: trade from value edges back to POC in balance, or trade breakouts through LVNs toward the next HVN when the auction is trending.
Choosing the range: Anchored vs Visible
Your range defines the story. VP v3.2 lets you pick it two ways:
Visible Range (default): the profile is built from the bars currently on screen. This adapts as you pan/zoom and is ideal for quick reads and intraday work.
Anchored Range: toggle “Anchored Range” and pick an Anchor Time. Now the profile starts at that timestamp and extends to the most recent bar. Use this for event-based composites (e.g., listing day, policy announcement, ETF approval), weekly/monthly composites, or to study a trend leg in isolation.
Tip: for scalping, a visible range that covers the current session is enough. For swings, anchor to the start of the move, start of the week/month, or the event that changed regime.
Important settings (why they exist, and simple defaults)
Rows: how many price buckets form the histogram. More rows = finer detail, more CPU. Start around 120; go higher when zoomed in.
Value Area %: how much volume should sit inside the VA band. 70% is standard; lower it (e.g., 60–65%) in strong trends to keep VA tight, raise it in dull balance to widen the area you consider “fair.”
Max Width, Horizontal Offset, Row Height %: purely visual—how wide the histogram can draw, how far it sits from the last bar, and how thick each row appears.
Histogram Emphasis: a gentle power curve that makes big nodes pop and tiny nodes fade. Leave at 1.0 until you know why you want more/less contrast.
FAST vs ACCURATE:
FAST puts each bar’s volume into its mid-price bucket. It’s very fast and stable for live trading.
ACCURATE spreads each bar’s volume across its full high-low range. This gives a smoother profile (especially on wide candles) at the cost of more computation.
If your machine lags, use FAST for intraday and ACCURATE when you’re doing end-of-day review.
Plot POC/VA series / Extend Left: draws POC/VAH/VAL as dotted lines and (optionally) extends them left across your chart. Extending is useful when you want those levels to act as “attractors/repellers” beyond the immediate profile.
Theme & Colors: there’s a dark/light toggle so the profile remains readable on any chart theme.
POC Shift — when “fair value” moves
Markets rotate around “fair value.” When that value shifts by a meaningful amount and sticks, the auction has changed. VP v3.2 detects this with three parameters:
Shift Min Ticks: the minimum distance POC must move to count as a new candidate.
Shift Confirm Bars: how many consecutive bars must hold that new area for the shift to be confirmed.
Shift Cooldown: how long to ignore re-triggers after a confirmed shift (avoids spamming in chop).
A POC Shift Up says buyers migrated the center of business higher (typical of an acceptance above prior value). POC Shift Down says the opposite. These are structure events: combine them with your directional tools (e.g., CVDv1’s Absorption/Efficiency read) to avoid chasing when the shift is fragile.
Using Volume Profile on any timeframe
The logic is the same everywhere: trade at value boundaries, target the POC or the next HVN, and respect LVNs as fast-pass corridors.
Scalping (1–5m charts)
Range: Visible; cover the current session or the last 2–4 hours.
Use: Fade VAH→POC and VAL→POC only when the tape supports it (e.g., CVDv1 not showing absorption against you). If price pushes into an LVN, expect fast movement to the other side—don’t fight mid-void.
Intraday (15m–1H)
Range: Visible covering the day, or Anchored to the day’s open.
Use: First seek balance trades (VAL/VAH to POC). When a real POC Shift confirms after a break, switch to trend-following: use pullbacks to prior VA boundaries as entries.
Swing (2H–4H)
Range: Anchored to start of week, start of trend leg, or major event.
Use: Enter on retests of VAL/VAH that hold, target the composite POC/HVNs. If you see sequential POC Shifts in trend direction, it’s a sign to trail rather than constantly fade back to POC.
Position (1D–1W)
Range: Anchored to YTD, quarter, or cycle low/high.
Use: Treat LVNs as structural gaps; acceptance through an LVN often leads to the next HVN. Weekly VA boundaries are strong reference levels; a weekly POC Shift is notable regime information.
How to act at the levels (a simple, durable playbook)
In balance: fade VAL/VAH back to POC—but only if your flow read doesn’t scream “absorption against you.”
In trend: ignore the first touch fade. Wait for acceptance (close outside), then use pullbacks to the broken VA boundary to join.
At LVNs: don’t expect chop. Plan for quick travel to the next HVN, place stops accordingly, and avoid mid-void entries.
Alerts (what they mean, what you do)
Cross POC / VAH / VAL: price just interacted with a key reference. Use your secondary signal (e.g., CVDv1 alignment/absorption) to decide fade vs follow.
POC Shift Up/Down: a structure change just confirmed. In balance, you may flip your bias. In trend, you can add on pullbacks toward the shifted area.
Compatible tools (optional, but powerful)
Volume Profile v3.2 is designed to work cleanly with other [JopAlgo] tools:
Cumulative Volume Delta v1 [JopAlgo] (CVDv1): lets you judge flow quality at VP levels. For example, a poke above VAH with CVD Absorption is a veto to chase—look for a failed breakout or reclaim. A retest of VAL with Imbalance strong and Alignment OK is a higher-quality bounce back to POC.
Weekly AVWAP v3 [JopAlgo]: the market’s mean/anchor. Confluence of Weekly AVWAP with VA boundaries or HVNs creates A-tier levels. Reclaims of Weekly AVWAP near VAL are excellent swing entries; rejections at Weekly AVWAP into VAH are high-quality fades in balance.
(If you post images, one good example is a VAL retest at Weekly AVWAP with CVDv1 showing “Efficient”—that story clicks instantly.)
Practical defaults
Rows: 120
Value Area: 70%
FAST mode for live work; ACCURATE for deep review or wide-range composites
Anchored Range: off (Visible) for intraday; on for weekly/monthly/“since event” studies
POC Shift: start with 10 ticks, 2 confirm bars, 10 cooldown; tighten for very small-tick futures, loosen in highly volatile regimes
Common pitfalls this solves
“Why did it stall here?” Check the profile: you hit an HVN. That’s where business likes to be done. Expect chop or mean-reversion to POC.
“Breakout straight back in.” You broke into an LVN without acceptance; or CVDv1 flagged Absorption. Wait for acceptance, then take the retest.
“Levels feel arbitrary.” POC/VAH/VAL come from where traders actually transacted, not where a simple moving average happens to sit.
Open source & disclaimer
This indicator is published open source so you can learn from it, tune it, and build rules you trust. Trading is risky; no tool eliminates that risk.
Disclaimer — Not Financial Advice.
The “Volume Profile v3.2 [JopAlgo]” indicator and this description are provided for educational purposes only and do not constitute financial or investment advice. Markets involve risk, including possible loss of capital. [JopAlgo] makes no warranties and assumes no responsibility for any trading decisions or outcomes resulting from the use of this script. Past performance is not indicative of future results.
Use VP v3.2 to decide where the market is likely to accept or reject. Then use your flow read (e.g., CVDv1) to decide when to act. That combination—location + flow—is what keeps you on the right side of the auction across any timeframe.
Script protegido
Esse script é publicada como código fechado. No entanto, você pode usar ele livremente e sem nenhuma limitação – saiba mais aqui.
@jopalgo | [JopAlgo] — Indicators & strategies. Clear rules, no chasing. Education only. Not financial advice.
Aviso legal
As informações e publicações não devem ser e não constituem conselhos ou recomendações financeiras, de investimento, de negociação ou de qualquer outro tipo, fornecidas ou endossadas pela TradingView. Leia mais em Termos de uso.