PROTECTED SOURCE SCRIPT
Volume Profile Movable Range
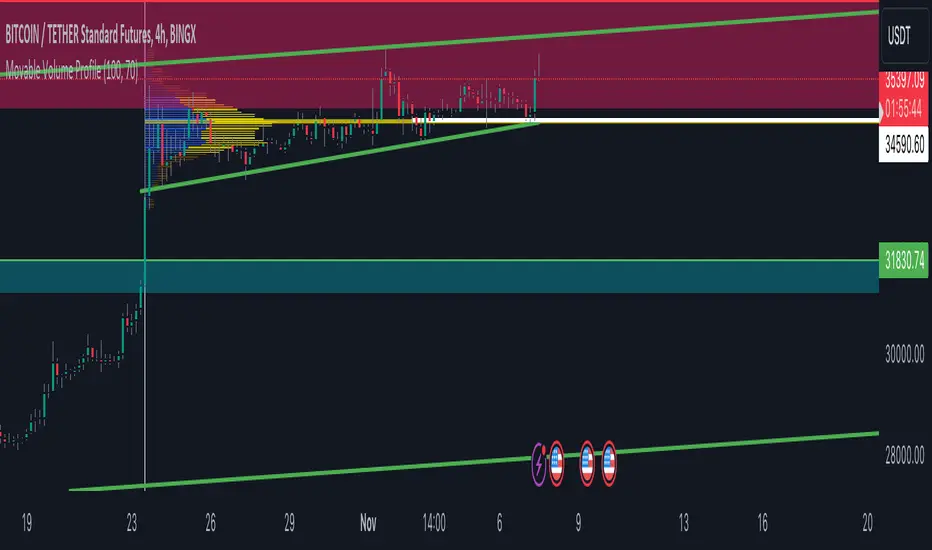
A movable range volume profile indicator is an advanced technical analysis tool that offers traders the flexibility to customize the start date from which the indicator's calculation begins. This feature is particularly valuable for investors who wish to focus on specific time periods and gain a more detailed understanding of price and volume movements within those intervals.
The primary advantage of this indicator lies in its intuitive movable bar, which allows users to easily adjust the start date on the chart. By dragging this bar forward or backward along the time axis, the volume profile calculation is automatically updated to reflect the newly selected date range. This provides traders with a unique ability to adapt to changing market conditions and adjust their analysis in real-time.
By customizing the start date, investors can explore patterns, trends, and support/resistance levels within specific timeframes more accurately and timely. Furthermore, this indicator offers a detailed interpretation of trading volume, aiding traders in assessing the strength or weakness of trends, identifying potential entry and exit points, and making informed decisions in their trading strategies.
In summary, a movable range volume profile indicator is an essential tool for traders seeking more adaptable and precise technical analysis. The ability to easily select and adjust the start date through a movable bar on the chart provides a significant advantage when making data-driven, personalized decisions in financial markets.
Script protegido
Esse script é publicada como código fechado. No entanto, você pode gerenciar suas escolhas de bate-papo. Por favor, abra suas Configurações do perfil
Aviso legal
As informações e publicações não se destinam a ser, e não constituem, conselhos ou recomendações financeiras, de investimento, comerciais ou de outro tipo fornecidos ou endossados pela TradingView. Leia mais nos Termos de Uso.