OPEN-SOURCE SCRIPT
RMA EMA Crossover | MisinkoMaster
The RMA EMA Crossover (REMAC) is a trend-following overlay indicator designed to detect shifts in market momentum using the interaction between a smoothed RMA (Relative Moving Average) and its EMA (Exponential Moving Average) counterpart.
This combination provides fast, adaptive signals while reducing noise, making it suitable for a wide range of markets and timeframes.
🔎 Methodology
RMA Calculation
The Relative Moving Average (RMA) is calculated over the user-defined length.
RMA is a type of smoothed moving average that reacts more gradually than a standard EMA, providing a stable baseline.
EMA of RMA
An Exponential Moving Average (EMA) is then applied to the RMA, creating a dual-layer moving average system.
This combination amplifies trend signals while reducing false crossovers.
Trend Detection (Crossover Logic)
Bullish Signal (Trend Up) → When RMA crosses above EMA.
Bearish Signal (Trend Down) → When EMA crosses above RMA.
This simple crossover system identifies the direction of momentum shifts efficiently.
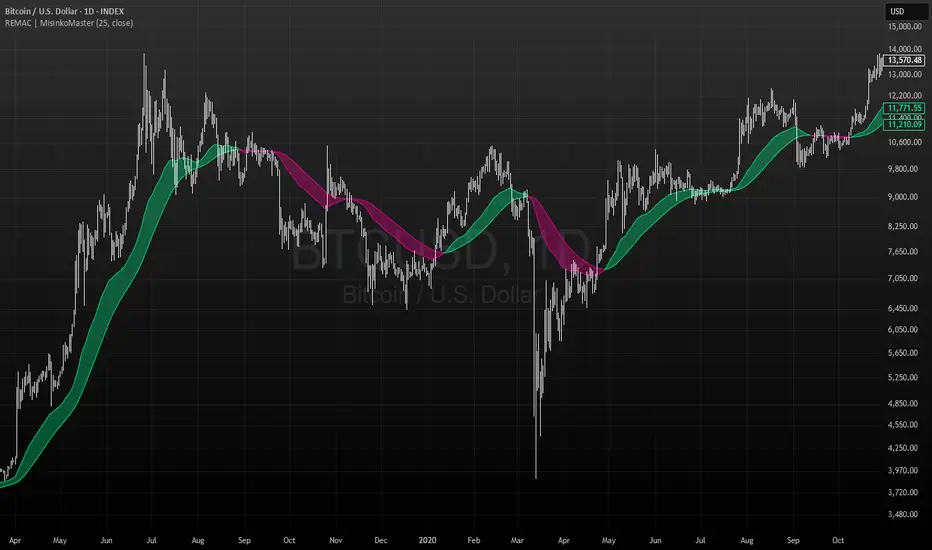
📈 Visualization
RMA and EMA are plotted directly on the chart.
Colors adapt dynamically to the current trend:
Cyan / Green hues → RMA above EMA (bullish momentum).
Magenta / Red hues → EMA above RMA (bearish momentum).
Filled areas between the two lines highlight zones of trend alignment or divergence, making it easier to spot reversals at a glance.
⚡ Features
Adjustable length parameter for RMA and EMA.
Overlay format allows for direct integration with price charts.
Visual trend scoring via color and fill for rapid assessment.
Works well across all asset classes: crypto, forex, stocks, indices.
✅ Use Cases
Trend Following → Stay on the right side of the market by following momentum shifts.
Reversal Detection → Crossovers highlight early trend changes.
Filter for Trading Systems → Use as a confirmation overlay for other indicators or strategies.
Visual Market Insight → Filled zones provide immediate context for trend strength.
This combination provides fast, adaptive signals while reducing noise, making it suitable for a wide range of markets and timeframes.
🔎 Methodology
RMA Calculation
The Relative Moving Average (RMA) is calculated over the user-defined length.
RMA is a type of smoothed moving average that reacts more gradually than a standard EMA, providing a stable baseline.
EMA of RMA
An Exponential Moving Average (EMA) is then applied to the RMA, creating a dual-layer moving average system.
This combination amplifies trend signals while reducing false crossovers.
Trend Detection (Crossover Logic)
Bullish Signal (Trend Up) → When RMA crosses above EMA.
Bearish Signal (Trend Down) → When EMA crosses above RMA.
This simple crossover system identifies the direction of momentum shifts efficiently.
📈 Visualization
RMA and EMA are plotted directly on the chart.
Colors adapt dynamically to the current trend:
Cyan / Green hues → RMA above EMA (bullish momentum).
Magenta / Red hues → EMA above RMA (bearish momentum).
Filled areas between the two lines highlight zones of trend alignment or divergence, making it easier to spot reversals at a glance.
⚡ Features
Adjustable length parameter for RMA and EMA.
Overlay format allows for direct integration with price charts.
Visual trend scoring via color and fill for rapid assessment.
Works well across all asset classes: crypto, forex, stocks, indices.
✅ Use Cases
Trend Following → Stay on the right side of the market by following momentum shifts.
Reversal Detection → Crossovers highlight early trend changes.
Filter for Trading Systems → Use as a confirmation overlay for other indicators or strategies.
Visual Market Insight → Filled zones provide immediate context for trend strength.
Script de código aberto
Em verdadeiro espírito do TradingView, o criador deste script o tornou de código aberto, para que os traders possam revisar e verificar sua funcionalidade. Parabéns ao autor! Embora você possa usá-lo gratuitamente, lembre-se de que a republicação do código está sujeita às nossas Regras da Casa.
"Better to take a step back, than to stand stuck forever."
Aviso legal
As informações e publicações não se destinam a ser, e não constituem, conselhos ou recomendações financeiras, de investimento, comerciais ou de outro tipo fornecidos ou endossados pela TradingView. Leia mais nos Termos de Uso.