PROTECTED SOURCE SCRIPT
Time Based Statistics
This indicator is a complex time-based statistics tool for analyzing intraday trading patterns. Here's a comprehensive breakdown:
1. **Session Management**
- Tracks trading sessions from 18:00 to 16:59 next day (using New York time)
- Separates analysis by weekdays (Monday through Friday)
- Resets statistics at week's end
2. **High/Low Time Tracking**
- Records when daily highs and lows occur for each day
- Maintains historical arrays of high/low times for pattern analysis
- Tracks high/low patterns in three main time periods:
- Evening/Overnight (18:00-23:59)
- Early Morning (00:00-09:59)
- Market Hours (10:00-16:59)
3. **Probability Calculations**
The indicator calculates several probabilities:
a) **Hold Probability**
- Calculates likelihood current high/low will remain day's high/low
- Counts how many historical highs/lows occurred in remaining hours
- Returns percentage based on historical patterns
b) **Most Frequent Times**
- Identifies which times most frequently produce highs/lows
- Tracks both primary and secondary (next highest) probable times
- Maintains historical counts of highs/lows by hour
4. **Pattern Analysis**
- Filters historical times based on current time
- Helps predict potential future high/low times
- Adjusts analysis based on time of day
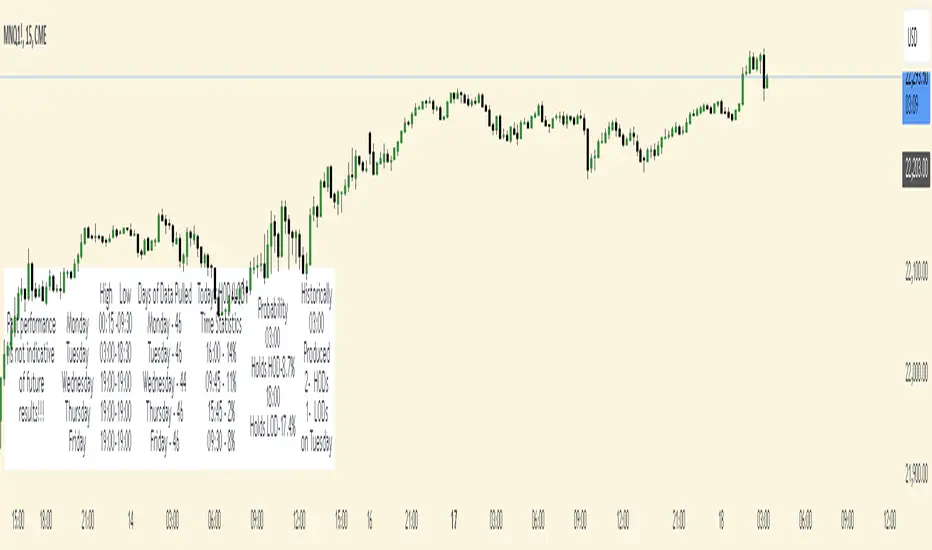
5. **Data Display**
Shows statistics in a table including:
- Days of data analyzed
- Current day's high/low times
- Most frequent times for today's highs/lows
- Probability of current high/low holding
- Historical patterns for current hour
6. **Historical Data Management**
- Stores daily high/low data at week's end
- Maintains separate arrays for each day of the week
- Uses this historical data for pattern analysis
The indicator helps traders by:
- Understanding when highs/lows typically occur
- Assessing probability of new highs/lows
- Identifying historically significant time periods
- Providing statistical basis for timing decisions
1. **Session Management**
- Tracks trading sessions from 18:00 to 16:59 next day (using New York time)
- Separates analysis by weekdays (Monday through Friday)
- Resets statistics at week's end
2. **High/Low Time Tracking**
- Records when daily highs and lows occur for each day
- Maintains historical arrays of high/low times for pattern analysis
- Tracks high/low patterns in three main time periods:
- Evening/Overnight (18:00-23:59)
- Early Morning (00:00-09:59)
- Market Hours (10:00-16:59)
3. **Probability Calculations**
The indicator calculates several probabilities:
a) **Hold Probability**
- Calculates likelihood current high/low will remain day's high/low
- Counts how many historical highs/lows occurred in remaining hours
- Returns percentage based on historical patterns
b) **Most Frequent Times**
- Identifies which times most frequently produce highs/lows
- Tracks both primary and secondary (next highest) probable times
- Maintains historical counts of highs/lows by hour
4. **Pattern Analysis**
- Filters historical times based on current time
- Helps predict potential future high/low times
- Adjusts analysis based on time of day
5. **Data Display**
Shows statistics in a table including:
- Days of data analyzed
- Current day's high/low times
- Most frequent times for today's highs/lows
- Probability of current high/low holding
- Historical patterns for current hour
6. **Historical Data Management**
- Stores daily high/low data at week's end
- Maintains separate arrays for each day of the week
- Uses this historical data for pattern analysis
The indicator helps traders by:
- Understanding when highs/lows typically occur
- Assessing probability of new highs/lows
- Identifying historically significant time periods
- Providing statistical basis for timing decisions
Script protegido
Esse script é publicada como código fechado. No entanto, você pode gerenciar suas escolhas de bate-papo. Por favor, abra suas Configurações do perfil
Aviso legal
As informações e publicações não se destinam a ser, e não constituem, conselhos ou recomendações financeiras, de investimento, comerciais ou de outro tipo fornecidos ou endossados pela TradingView. Leia mais nos Termos de Uso.