OPEN-SOURCE SCRIPT
Table: Colorable Timeframes Top-Down Analysis
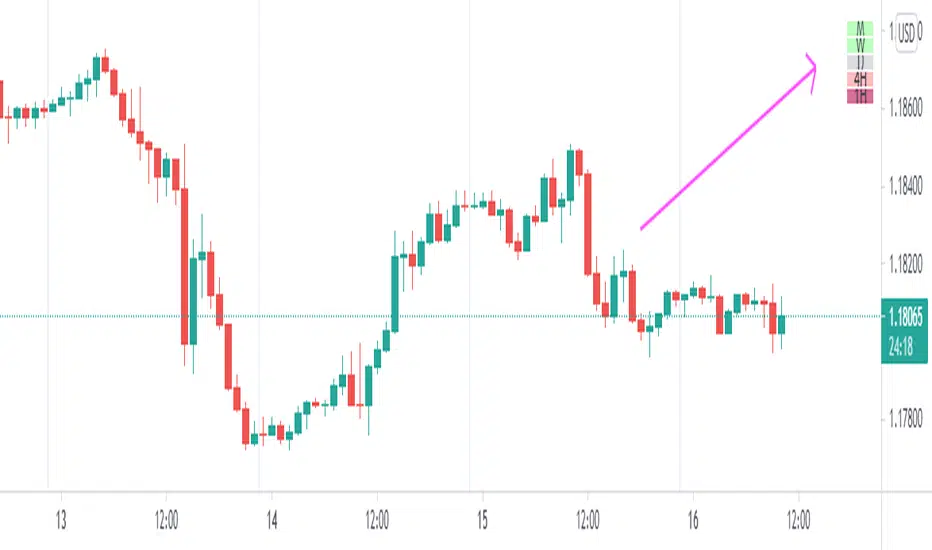
This is a very simple indicator that lets you color up to five different cells. After doing Top-Down analysis, you are probably going to stay on the lowest of timeframes, and if you work with many tickers, you may forget the bigger picture or confuse them.
So you can make some timeframes green if they are bullish or red if they are bearish and you will always have a reminder on the screen in the form of this small non-intrusive table.
So you can make some timeframes green if they are bullish or red if they are bearish and you will always have a reminder on the screen in the form of this small non-intrusive table.
Script de código aberto
Em verdadeiro espírito do TradingView, o criador deste script o tornou de código aberto, para que os traders possam revisar e verificar sua funcionalidade. Parabéns ao autor! Embora você possa usá-lo gratuitamente, lembre-se de que a republicação do código está sujeita às nossas Regras da Casa.
Aviso legal
As informações e publicações não se destinam a ser, e não constituem, conselhos ou recomendações financeiras, de investimento, comerciais ou de outro tipo fornecidos ou endossados pela TradingView. Leia mais nos Termos de Uso.