PROTECTED SOURCE SCRIPT
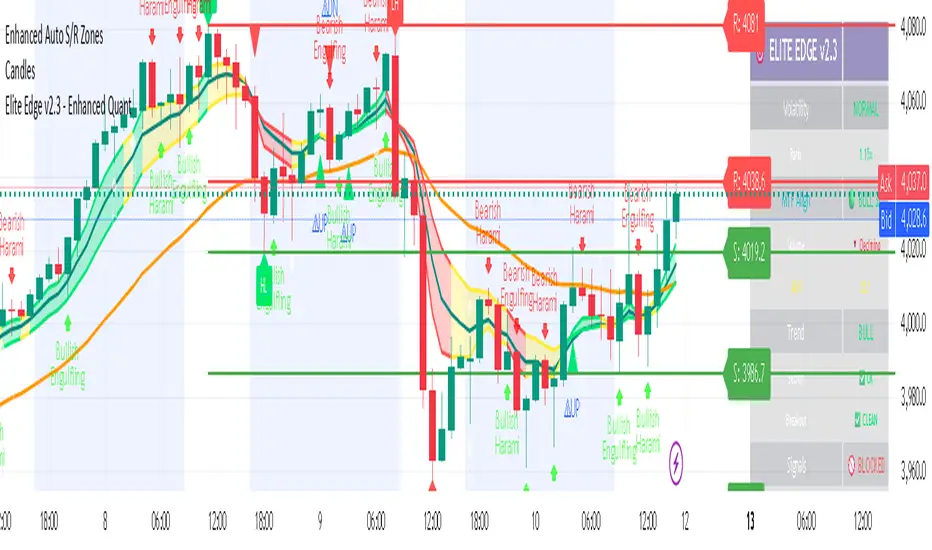
Elite Edge v2.3 - Enhanced Quant
This is an updated version of my previous indicator- Probability Score & UP/DOWN signals. I want to emphasize that "when not to trade".
Purpose: Make good trades obvious—and make bad trades easy to skip.
On-Chart Elements:
EMA 8 & EMA 34
Madrid Trend Ribbon (color = trend state)
Signal Arrows (BUY / SELL)
Signal Labels (shows setup quality)
Structure Labels (HH/HL/LH/LL — optional)
The Golden Rule: When Not to Trade
Skip the trade if any of the following are true:
Volatility Warning shows “🛑 EXTREME VOLATILITY”
Score < 70
MTF < 3/3
Signal quality is below GOOD
Dashboard is not ✅ ACTIVE or shows mixed/“not all green”
Chart is messy (overlapping signals, choppy price, no clean structure)
Quick Trading Flow (3 Checks)
See a Signal Arrow? (BUY/SELL on a clean chart)
Read the Signal Label:
Quality = ELITE / EXCELLENT / GOOD
Score ≥ 70
MTF = 3/3
Open the Dashboard:
Signals: ✅ ACTIVE
Statuses: all green (no warnings)
All 3 pass → Enter.
Any one fails → Skip.
Critical System Messages
Purple Label — “🛑 EXTREME VOLATILITY”
Meaning: Market regime is unstable (ratio > 2.5×)
Do: Stop trading; step away 30+ minutes
Dashboard: Volatility = EXTREME, Signals = 🚫 BLOCKED
Green Label — “✅ CLEAR TO TRADE”
Meaning: Volatility normalized; conditions OK
Do: Resume scanning for setups
Dashboard: Volatility = NORMAL, Signals = ✅ ACTIVE
What “Clean Chart” Means (at a glance)
Price respects EMA 8/34 and ribbon trend
Clear swing structure (HH/HL in uptrends, LH/LL in downtrends)
Few conflicting arrows; no chop cluster
No extreme spikes or gaps around signal
Signal Quality Cheatsheet
ELITE: Strong trend + structure + confluence → priority trade
EXCELLENT: Solid alignment, slight imperfection → tradable
GOOD: Meets minimum standards → optional; be strict with risk
Below GOOD: Do not trade
Risk & Discipline Nudge
Default R/R ≥ 1:2
Size down in rising volatility or mixed confluence
No FOMO: You will see another signal.
Polished LLM Prompt (for Claude or any LLM)
You are an experienced quantitative trader and technical analyst. I’m sharing a single chart (regular session only).
Analyze price action, trend structure, volume, key levels, candlestick patterns, moving averages, momentum, and support/resistance.
Deliver a clear plan:
Direction Bias: Bullish, Bearish, or Neutral — with reasoning.
Entry Zone(s): Price ranges with structure/indicator confluence.
Exit Plan: Target(s) and stop level with justification.
Short-Term vs. Medium-Term Outlook: e.g., continuation, reversal, consolidation.
Risk Management: Suggested position sizing or minimum R/R ≥ 1:2, with probability and confidence.
Assume standard market hours (no after-hours). Avoid mere description; give actionable guidance with probabilities and confidence. Now evaluate the attached chart and advise.
Script protegido
Esse script é publicada como código fechado. No entanto, você pode usar ele livremente e sem nenhuma limitação – saiba mais aqui.
Aviso legal
As informações e publicações não devem ser e não constituem conselhos ou recomendações financeiras, de investimento, de negociação ou de qualquer outro tipo, fornecidas ou endossadas pela TradingView. Leia mais em Termos de uso.