OPEN-SOURCE SCRIPT
[COG]S&P 500 Weekly Seasonality Projection
[COG]S&P 500 Weekly Seasonality Projection
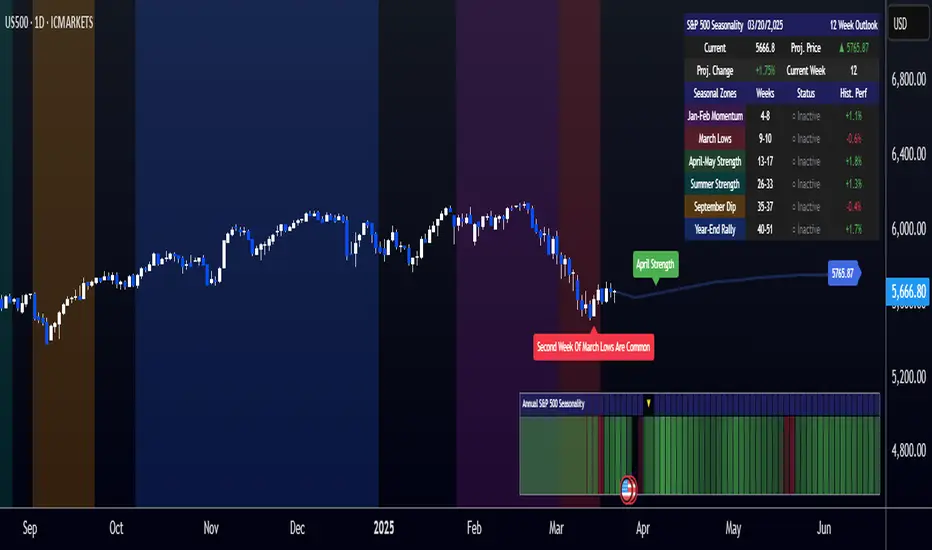
This indicator visualizes S&P 500 seasonality patterns based on historical weekly performance data. It projects price movements for up to 26 weeks ahead, highlighting key seasonal periods that have historically affected market performance.
Key Features:
Projects price movements based on historical S&P 500 weekly seasonality patterns (2005-2024)
Highlights six key seasonal periods: Jan-Feb Momentum, March Lows, April-May Strength, Summer Strength, September Dip, and Year-End Rally
Customizable forecast length from 1-26 weeks with quick timeframe selection buttons
Optional moving average smoothing for more gradual projections
Detailed statistics table showing projected price and percentage change
Seasonality mini-map showing the full annual pattern with current position
Customizable colors and visual elements
How to Use:
Apply to S&P 500 index or related instruments (daily timeframe or higher recommended)
Set your desired forecast length (1-26 weeks)
Monitor highlighted seasonal zones that have historically shown consistent patterns
Use the projection line as a general guideline for potential price movement
Settings:
Forecast length: Configure from 1-26 weeks or use quick select buttons (1M, 3M, 6M, 1Y)
Visual options: Customize colors, backgrounds, label sizes, and table position
Display options: Toggle statistics table, period highlights, labels, and mini-map
This indicator is designed as a visual guide to help identify potential seasonal tendencies in the S&P 500. Historical patterns are not guarantees of future performance, but understanding these seasonal biases can provide valuable context for your trading decisions.
Note: For optimal visualization, use on Daily timeframe or higher. Intraday timeframes will display a warning message.
Script de código aberto
Em verdadeiro espírito do TradingView, o criador deste script o tornou de código aberto, para que os traders possam revisar e verificar sua funcionalidade. Parabéns ao autor! Embora você possa usá-lo gratuitamente, lembre-se de que a republicação do código está sujeita às nossas Regras da Casa.
CognitiveAlpha
Aviso legal
As informações e publicações não se destinam a ser, e não constituem, conselhos ou recomendações financeiras, de investimento, comerciais ou de outro tipo fornecidos ou endossados pela TradingView. Leia mais nos Termos de Uso.