OPEN-SOURCE SCRIPT
2B detector beta
Identifying a trend reversal is practically tricky, given that price movement is somewhat unpredictable and mostly obeys a power law. In which the price difference is primarily out of normal distribution. According to Benoit Mandelbrot, the price distribution follows an alpha-stable distribution with α equal to 1.7.
Real data observation suggests that stock prices do not follow the Random Walk Hypothesis or Brownian motion. Instead, they follow a fractal pattern. Fractals exhibit similar patterns at different scales called self-similarity. Using this character, one can develop fractal patterns to identify local highs and local lows.
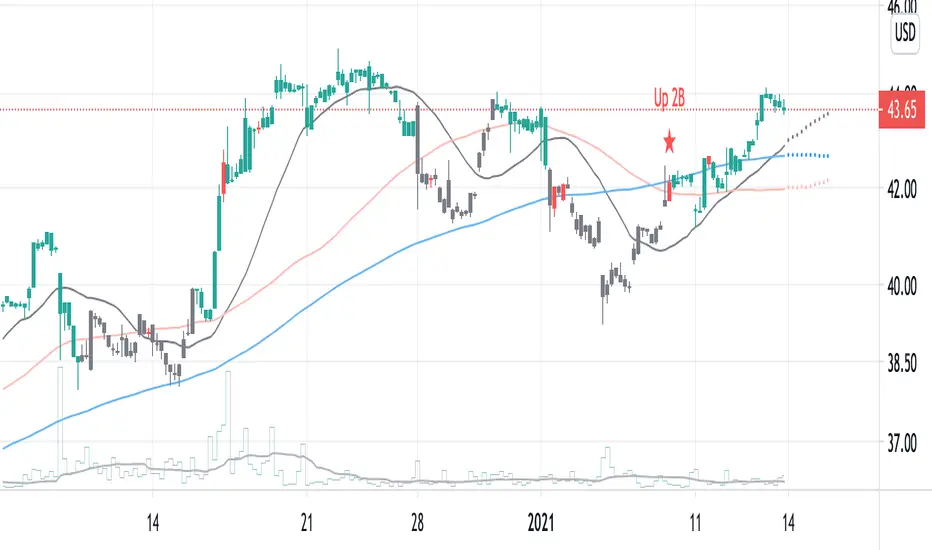
This indicator identifies the reversal signal so-called 2B base on the following logic:
1. Identify local highs and local lows with fractals
2. Define relative positions of those local highs and lows (ABC and 2B)
3. Define the local range of ABC and B
Disclaimer: This indicator is only for research purposes. Please do not take it as investing or trading advice.
Real data observation suggests that stock prices do not follow the Random Walk Hypothesis or Brownian motion. Instead, they follow a fractal pattern. Fractals exhibit similar patterns at different scales called self-similarity. Using this character, one can develop fractal patterns to identify local highs and local lows.
This indicator identifies the reversal signal so-called 2B base on the following logic:
1. Identify local highs and local lows with fractals
2. Define relative positions of those local highs and lows (ABC and 2B)
3. Define the local range of ABC and B
Disclaimer: This indicator is only for research purposes. Please do not take it as investing or trading advice.
Script de código aberto
Em verdadeiro espírito do TradingView, o criador deste script o tornou de código aberto, para que os traders possam revisar e verificar sua funcionalidade. Parabéns ao autor! Embora você possa usá-lo gratuitamente, lembre-se de que a republicação do código está sujeita às nossas Regras da Casa.
Aviso legal
As informações e publicações não se destinam a ser, e não constituem, conselhos ou recomendações financeiras, de investimento, comerciais ou de outro tipo fornecidos ou endossados pela TradingView. Leia mais nos Termos de Uso.