OPEN-SOURCE SCRIPT
The Commitment of Traders (COT) Index
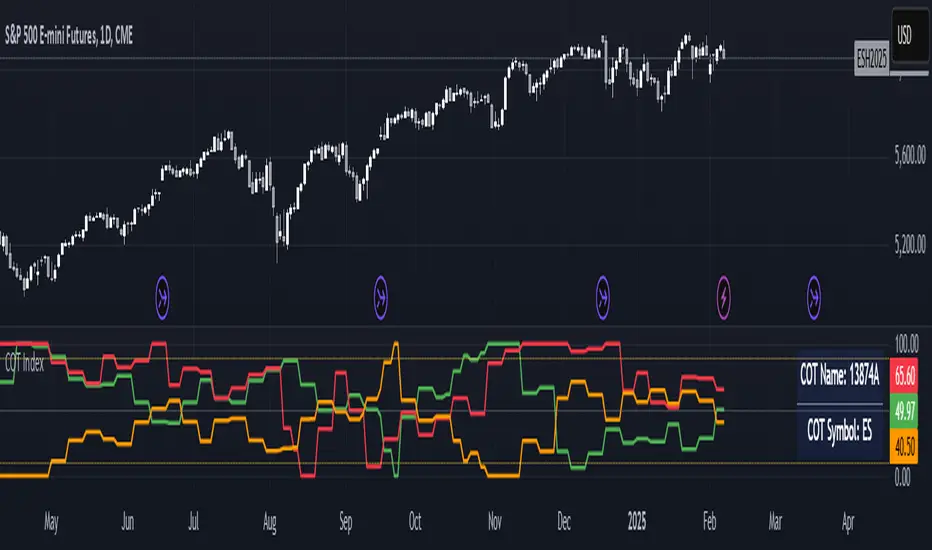
The COT Index indicator is used to measure the positioning of different market participants (Large Traders, Small Traders, and Commercial Hedgers) relative to their historical positioning over a specified lookback period. It helps traders identify extreme positioning, which can signal potential reversals or trend continuations.
Key Features of the Indicator:
COT Data Retrieval
The script pulls COT report data from the TradingView COT Library TradingView/LibraryCOT/3).
It retrieves long and short positions for three key groups:
Large Traders (Non-commercial positions) – Speculators such as hedge funds.
Small Traders (Non-reportable positions) – Small retail traders.
Commercial Hedgers (Commercial positions) – Institutions that hedge real-world positions.
Threshold Zones for Extreme Positioning:
Upper Zone Threshold (Default: 90%)
Signals potential overbought conditions (excessive buying).
Lower Zone Threshold (Default: 10%)
Signals potential oversold conditions (excessive selling).
The indicator plots these zones using horizontal lines.
The COT Index should be used in conjunction with technical analysis (support/resistance, trends, etc.). A high COT Index does not mean the market will reverse immediately—it’s an indication of extreme sentiment.
Note:
If the script does not recognize or can't find the ticker currently viewed in the COT report, the COT indicator will default to U.S. Dollar.
Script de código aberto
Em verdadeiro espírito do TradingView, o criador deste script o tornou de código aberto, para que os traders possam revisar e verificar sua funcionalidade. Parabéns ao autor! Embora você possa usá-lo gratuitamente, lembre-se de que a republicação do código está sujeita às nossas Regras da Casa.
Aviso legal
As informações e publicações não se destinam a ser, e não constituem, conselhos ou recomendações financeiras, de investimento, comerciais ou de outro tipo fornecidos ou endossados pela TradingView. Leia mais nos Termos de Uso.