OPEN-SOURCE SCRIPT
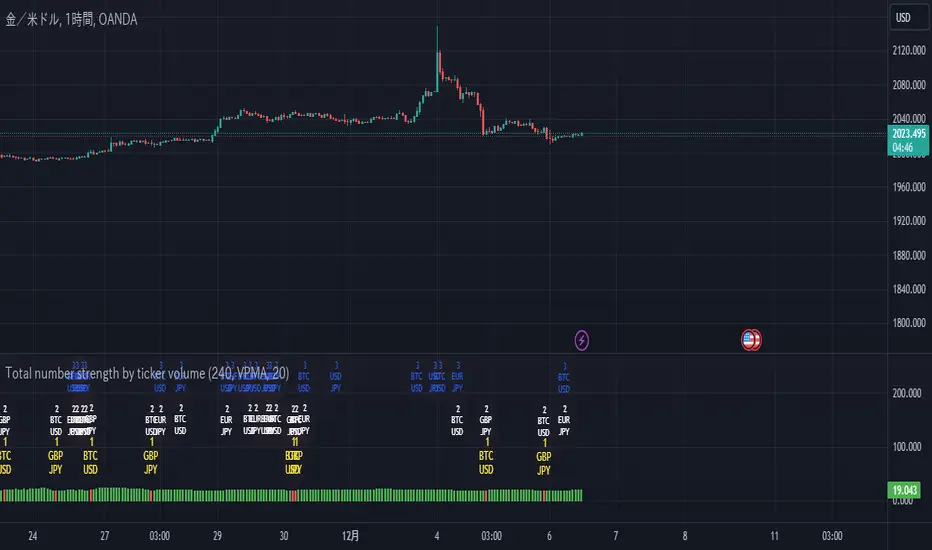
Total number strength by ticker volume
This is about stocks, which I always analyze.
Figure this out by looking at what the code calls ta.secutity.
This indicator plots the highest value of the ratio of total volume to individual volume for the stock you are analyzing, and the histogram tumbles to red when the stock changes in that value. The changed value is plotted as a label above that histogram. By using this indicator, you can determine which is currently the focus of attention, and if there are outliers, you will know by the histogram's detachment.
The parameters are explained below, but Timefream is the market value to be determined
setvalue sets the item to be judged, and lenght sets the time period to be judged. setvalue is the parameter that determines the timeframe for the judgment. vol is the volume, VP is the total purchase price, VPMA is its average, VPMAD is the detachment from its average, MA is the average of the vol, MAD is the detachment from its average, LRC is the average of the vol, and LRC is the average of the vol. value of linear regression, and also
The calculation of detachment is not negative because it comes out as a square, but it is not a problem because it is calculated as a percentage.
There is a *problem, and if the timefreame to be displayed is not calculated below the value of timefreame, an error will occur. We are currently searching for a solution to this problem. If you know the solution, I would appreciate it if you could let me know in the chat.
Script de código aberto
Em verdadeiro espírito do TradingView, o criador deste script o tornou de código aberto, para que os traders possam revisar e verificar sua funcionalidade. Parabéns ao autor! Embora você possa usá-lo gratuitamente, lembre-se de que a republicação do código está sujeita às nossas Regras da Casa.
Aviso legal
As informações e publicações não se destinam a ser, e não constituem, conselhos ou recomendações financeiras, de investimento, comerciais ou de outro tipo fornecidos ou endossados pela TradingView. Leia mais nos Termos de Uso.