PROTECTED SOURCE SCRIPT
Atualizado Relative Volume with Hull ma and Donchian channel
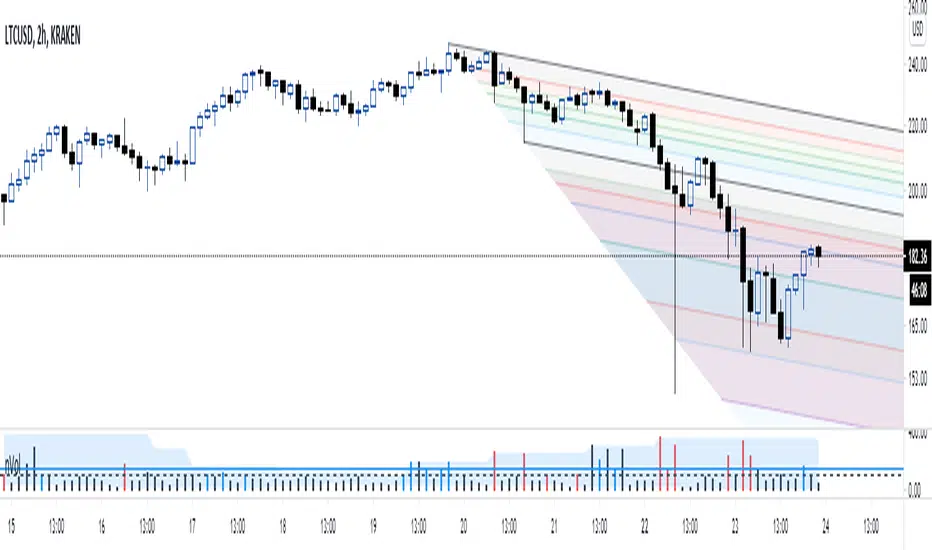
A trader introduced the relative volume to me; I like the concept but its presentation doesn't fit my "visual" taste.
What I did was to color the relative volume bar based on the relationship among (1) hull moving average of the close (2) close vs. open and (3) the relative volume bar reading.
Red -> bearish price action with a lot of volume
Green -> bullish price action with a lot volume
Black -> no clear relationship between volume and price action.
I also added a Donchian channel to the relative volume to further gauge the strength of the relative volume.
All of my posts are for entertainment only.
Notas de Lançamento
The purpose of this "relative volume" indicator is to easily visualize whether the volume flow supports with a price-action.To further enhance the visualization, I just shifted the main horizontal line using this code.
nVol = volume / Volume_Average * 100 -100
Script protegido
Esse script é publicada como código fechado. No entanto, você pode gerenciar suas escolhas de bate-papo. Por favor, abra suas Configurações do perfil
Aviso legal
As informações e publicações não se destinam a ser, e não constituem, conselhos ou recomendações financeiras, de investimento, comerciais ou de outro tipo fornecidos ou endossados pela TradingView. Leia mais nos Termos de Uso.