OPEN-SOURCE SCRIPT
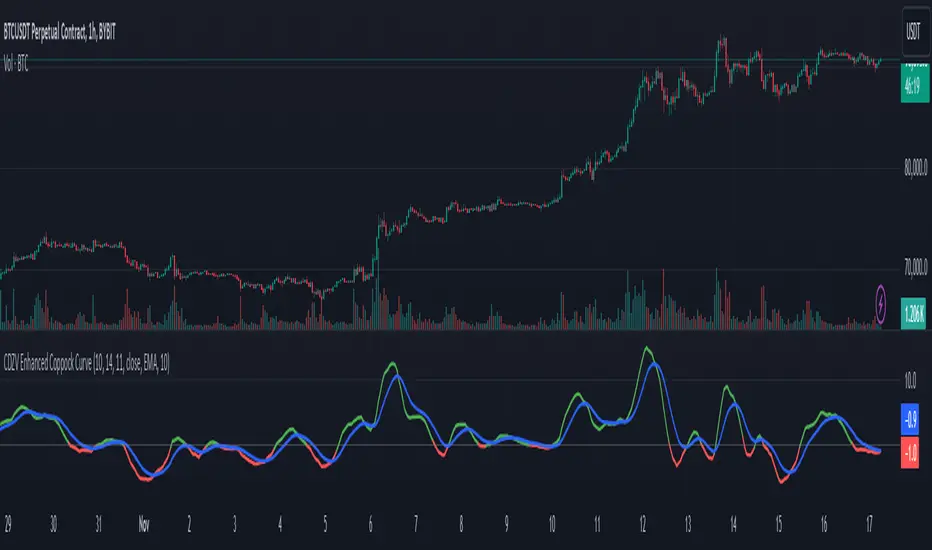
CDZV Enhanced Coppock Curve
This indicator is a part of the CDZV toolkit (backtesting and automation)
The Enhanced Coppock Curve is an upgraded version of the classic Coppock Curve indicator. It incorporates several additional features for greater flexibility and analysis capabilities. This indicator is used to analyze market trends by plotting a weighted moving average (WMA) of the sum of two Rate of Change (ROC) values.
Key Features of the Indicator:
Base Calculation of the Coppock Curve:
The Coppock Curve is calculated as a weighted moving average (WMA) of the sum of two ROC values (long and short periods).
The source for the calculation is customizable (default is close).
Added Custom Moving Average:
The indicator supports three types of moving averages:
EMA (Exponential Moving Average),
SMA (Simple Moving Average),
HMA (Hull Moving Average).
Users can choose the type and length of the moving average via input settings.
The selected moving average values are displayed in the Data Window for easier analysis.
Dynamic Coloring of the Coppock Curve:
The Coppock Curve line changes color based on its value:
Green if the value is positive,
Red if the value is negative.
The line's color is also displayed in the Data Window as a numeric value:
1 for green (positive),
-1 for red (negative).
Data Window Output:
The values of the selected moving average are displayed in the Data Window.
The Coppock Curve line's color state (1 or -1) is also shown in the Data Window.
Visual Representation:
The Coppock Curve is plotted with dynamic color coding.
The selected moving average is overlaid on the Coppock Curve for deeper trend analysis.
Usage Instructions:
Add the indicator to your chart on TradingView.
Configure the inputs:
Smoothing length for the Coppock Curve,
Long and short periods for ROC,
Type and length of the moving average.
Analyze the chart:
A green Coppock Curve line indicates a bullish trend, while a red line signals a bearish trend.
The selected moving average helps further filter and confirm signals.
Use the Data Window to view numeric values for the moving average and the Coppock Curve line color.
Applications:
This indicator is ideal for assessing trend direction and strength. The added customization options and additional data make it a versatile tool for traders, enabling them to tailor the Coppock Curve to their strategies.
Script de código aberto
Em verdadeiro espírito do TradingView, o criador deste script o tornou de código aberto, para que os traders possam revisar e verificar sua funcionalidade. Parabéns ao autor! Embora você possa usá-lo gratuitamente, lembre-se de que a republicação do código está sujeita às nossas Regras da Casa.
Aviso legal
As informações e publicações não se destinam a ser, e não constituem, conselhos ou recomendações financeiras, de investimento, comerciais ou de outro tipo fornecidos ou endossados pela TradingView. Leia mais nos Termos de Uso.