OPEN-SOURCE SCRIPT
Approximate Spectral Entropy-Based Market Momentum (SEMM)
Overview
The Approximate Spectral Entropy-Based Market Momentum (SEMM) indicator combines the concepts of spectral entropy and traditional momentum to provide traders with insights into both the strength and the complexity of market movements. By measuring the randomness or predictability of price changes, SEMM helps traders understand whether the market is in a trending or consolidating state and how strong that trend or consolidation might be.
Key Features
Concepts Underlying the Calculations
The indicator utilizes Shannon entropy, a concept from information theory, to approximate the spectral entropy of price returns. Spectral entropy traditionally involves a Fourier Transform to analyze the frequency components of a signal, but due to Pine Script limitations, this indicator uses a simplified approach. It calculates log returns over a rolling window, normalizes them, and then computes the Shannon entropy. This entropy value represents the level of disorder or complexity in the market, which is then multiplied by traditional momentum measures like the rate of change (ROC).
How It Works
How Traders Can Use It
Example Usage Instructions
The Approximate Spectral Entropy-Based Market Momentum (SEMM) indicator combines the concepts of spectral entropy and traditional momentum to provide traders with insights into both the strength and the complexity of market movements. By measuring the randomness or predictability of price changes, SEMM helps traders understand whether the market is in a trending or consolidating state and how strong that trend or consolidation might be.
Key Features
- Entropy Measurement: Calculates the approximate spectral entropy of price movements to quantify market randomness.
- Momentum Analysis: Integrates entropy with rate-of-change (ROC) to highlight periods of strong or weak momentum.
- Dynamic Market Insight: Provides a dual perspective on market behavior—both the trend strength and the underlying complexity.
- Customizable Parameters: Adjustable window length for entropy calculation, allowing for fine-tuning to suit different market conditions.
Concepts Underlying the Calculations
The indicator utilizes Shannon entropy, a concept from information theory, to approximate the spectral entropy of price returns. Spectral entropy traditionally involves a Fourier Transform to analyze the frequency components of a signal, but due to Pine Script limitations, this indicator uses a simplified approach. It calculates log returns over a rolling window, normalizes them, and then computes the Shannon entropy. This entropy value represents the level of disorder or complexity in the market, which is then multiplied by traditional momentum measures like the rate of change (ROC).
How It Works
- Price Returns Calculation: The indicator first computes the log returns of price data over a specified window length.
- Entropy Calculation: These log returns are normalized and used to calculate the Shannon entropy, representing market complexity.
- Momentum Integration: The calculated entropy is then multiplied by the rate of change (ROC) of prices to generate the SEMM value.
- Signal Generation: High SEMM values indicate strong momentum with higher randomness, while low SEMM values indicate lower momentum with more predictable trends.
How Traders Can Use It
- Trend Identification: Use SEMM to identify strong trends or potential trend reversals. Low entropy values can indicate a trending market, whereas high entropy suggests choppy or consolidating conditions.
- Market State Analysis: Combine SEMM with other indicators or chart patterns to confirm the market's state—whether it's trending, ranging, or transitioning between states.
- Risk Management: Consider high SEMM values as a signal to be cautious, as they suggest increased market unpredictability.
Example Usage Instructions
- Add the Indicator: Apply the "Approximate Spectral Entropy-Based Market Momentum (SEMM)" indicator to your chart.
- Adjust Parameters: Modify the length parameter to suit your trading timeframe. Shorter lengths are more responsive, while longer lengths smooth out the signal.
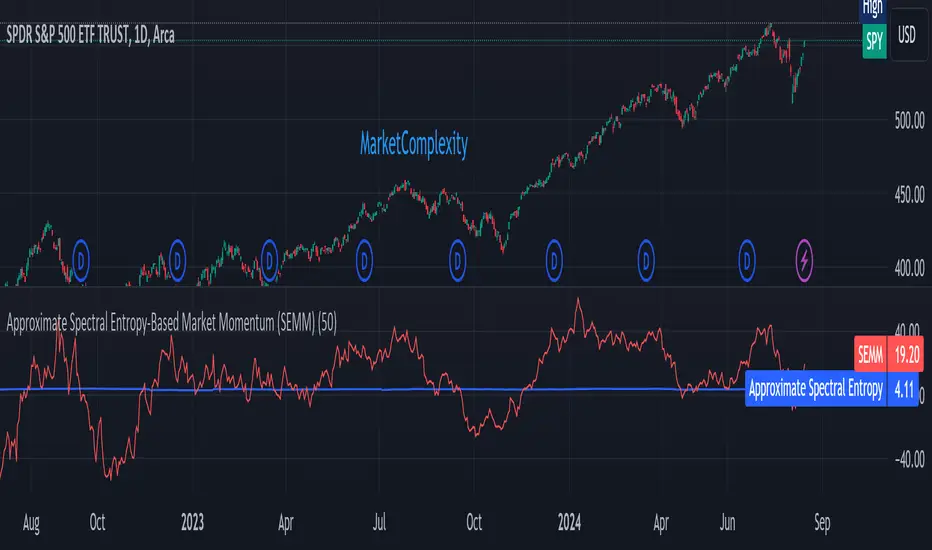
- Analyze the Output: Observe the blue line for entropy and the red line for SEMM. Look for divergences or confirmations with price action to guide your trades.
- Combine with Other Tools: Use SEMM alongside moving averages, support/resistance levels, or other indicators to build a comprehensive trading strategy.
Script de código aberto
Em verdadeiro espírito do TradingView, o criador deste script o tornou de código aberto, para que os traders possam revisar e verificar sua funcionalidade. Parabéns ao autor! Embora você possa usá-lo gratuitamente, lembre-se de que a republicação do código está sujeita às nossas Regras da Casa.
Aviso legal
As informações e publicações não se destinam a ser, e não constituem, conselhos ou recomendações financeiras, de investimento, comerciais ou de outro tipo fornecidos ou endossados pela TradingView. Leia mais nos Termos de Uso.