Dynamic Gann Square Pro - [Magic_xD]
Dynamic Gann Square Pro is an advanced technical analysis tool that combines classical Gann theory with modern geometric analysis to identify high-probability support/resistance zones, time cycles, and market turning points.
🎯 What This Indicator Does
This indicator provides a comprehensive suite of Gann-based analytical tools designed to help traders identify:
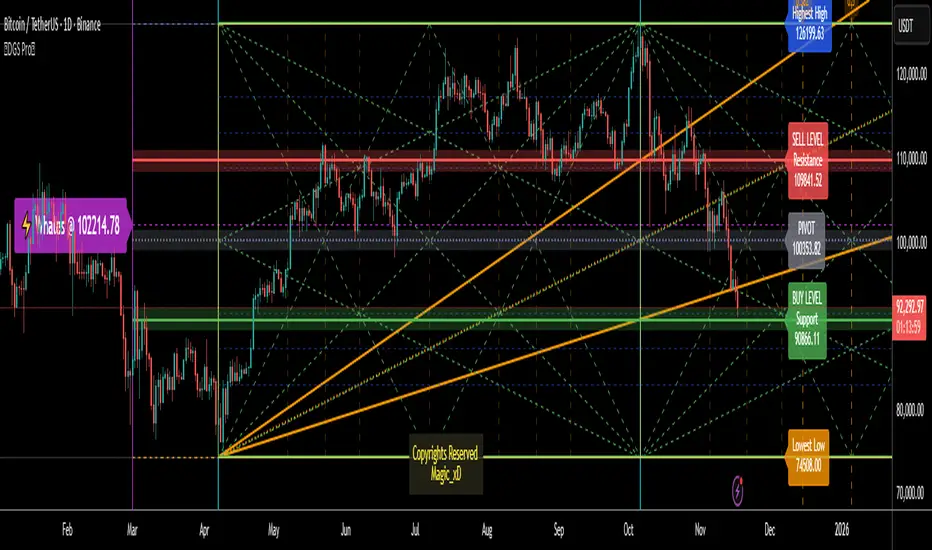
Dynamic Support & Resistance Levels: Automatically calculated key price zones based on market structure
Gann Square of 9 Calculations: Multiple calculation methods including Range, Daily, Weekly, and Monthly timeframes
Advanced Time Cycle Analysis: Gann cycles, Fibonacci time projections, and Square Root cycles for anticipating market turns
Geometric Pattern Recognition: Gann Stars with customizable shapes (Square, Triangle, Pentagon, Hexagon, Octagon, and more)
Price Action Zones: Color-coded zones highlighting critical decision points
Whale Detection System: Volume-weighted analysis to identify institutional activity
Multi-Timeframe Dashboard: Real-time technical rating system combining 10+ indicators (RSI, MACD, Stochastic, ADX, Bollinger Bands, and more)
📊 Key Features
Flexible Calculation Modes:
Select Candle Mode: Click directly on your chart to select your reference point
Lookback Mode: Define custom lookback periods (1-5000 bars)
Auto-Timeframe Detection: Automatically adjusts to Daily, Weekly, or Monthly ranges
Advanced Gann Tools:
Configurable Gann Square spacing with 17 precision levels (from 0.00000001 to 100000000)
Cycle multipliers (1-10 cycles) representing 360° to 3600° rotations
14 geometric shapes for market division analysis
Infinite Squares projection system for extended future projections
Time Cycle Systems:
Classical Gann Time Cycles with automatic repetition
Extended Fibonacci Time Ratios (0.382, 0.618, 1.618, 2.618, 3.618, up to 21.0)
W.D. Gann Square Root Method for geometric time expansion
Time grid subdivisions with customizable styles
Visual Clarity:
Multiple color themes (Dark Blue, Dark Gray, Black, Dark Green, Dark Purple)
Adjustable line styles (Solid, Dashed, Dotted) for all elements
Customizable labels with offset controls
Zone highlighting with transparency controls
Clean, professional chart presentation
🔮 Who Should Use This
This indicator is designed for:
Experienced traders familiar with Gann analysis methodology
Swing traders looking for high-probability reversal zones
Position traders using geometric and time-based analysis
Technical analysts who incorporate classical market theory
Gold & Forex traders (optimized for XAUUSD, BTCUSD, and major pairs)
⚙️ How to Use
Select Your Mode: Choose between "Select Candle" (click a pivot) or "Lookback" (automatic detection)
Configure Calculation Method: Pick your preferred Gann Square method (Range, Sqr9, Daily, Weekly, Monthly)
Adjust Cycles & Shape: Set the number of cycles and geometric division pattern
Enable Desired Features: Toggle Gann levels, Stars, Time Cycles, Trendlines, and Dashboard as needed
Customize Visual Style: Match your chart theme and preferences
The indicator automatically updates as new price data arrives, continuously calculating fresh support/resistance zones and time projections.
📈 What Makes This Different
Unlike simple support/resistance indicators, Dynamic Gann Square Pro implements authentic W.D. Gann methodology including:
True Square of 9 spiral calculations
Geometric price-time relationships
Natural angle divisions based on sacred geometry
Volume-weighted institutional detection
Multi-indicator consensus analysis
The system combines price analysis with time analysis, recognizing that Gann theory emphasizes both dimensions equally for accurate market forecasting.
⚠️ Important Notes
This is a technical analysis tool and should be used alongside proper risk management
Best results achieved when combined with your existing trading strategy
The indicator works on all timeframes but is optimized for H1, H4, and Daily charts
Customization is key: Spend time adjusting settings to match your trading instrument and style
The dashboard provides a technical rating but is not financial advice
🎓 Educational Foundation
This indicator is built on the teachings of W.D. Gann, one of the most legendary traders of the 20th century, incorporating:
Square of 9 theory
Natural geometric divisions (360° cycles)
Price-time equivalence principles
Support/resistance zone analysis.
Coded by Magic_xD - Ahmed Ramzey
Professional Algorithmic Trading System Developer
All copyrights reserved. This indicator represents years of research into Gann theory combined with modern programming techniques.
its a puzzle - Challenging.
Good luck ;)
Script sob convite
Somente usuários aprovados pelo autor podem acessar este script. Você precisará solicitar e obter permissão para usá-lo. Normalmente, essa permissão é concedida após o pagamento. Para obter mais detalhes, siga as instruções do autor abaixo ou entre em contato diretamente com Magic_xD.
A TradingView NÃO recomenda pagar ou usar um script, a menos que você confie totalmente em seu autor e entenda como ele funciona. Você também pode encontrar alternativas gratuitas e de código aberto em nossos scripts da comunidade.
Instruções do autor
Aviso legal
Script sob convite
Somente usuários aprovados pelo autor podem acessar este script. Você precisará solicitar e obter permissão para usá-lo. Normalmente, essa permissão é concedida após o pagamento. Para obter mais detalhes, siga as instruções do autor abaixo ou entre em contato diretamente com Magic_xD.
A TradingView NÃO recomenda pagar ou usar um script, a menos que você confie totalmente em seu autor e entenda como ele funciona. Você também pode encontrar alternativas gratuitas e de código aberto em nossos scripts da comunidade.