PROTECTED SOURCE SCRIPT
Atualizado Index Trend Map
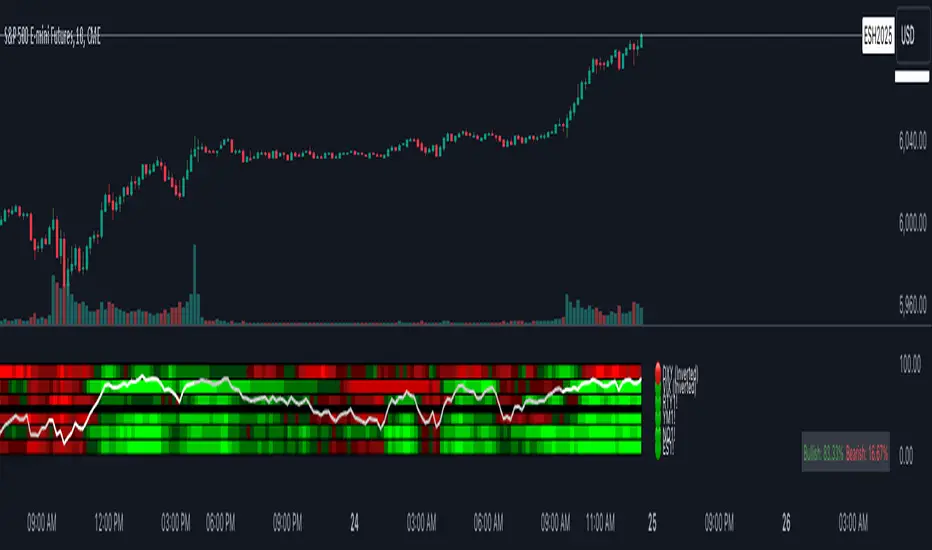
The Index Trend Map is a versatile and powerful tool designed to provide a sentiment heatmap for major market indices. This indicator tracks the average trend direction across multiple indices data points, including a default setting for S&P 500 Futures ( ES), Nasdaq 100 Futures (NNQ), Dow Jones Futures (YYM), Russell 2000 Futures (
 RTY) and traditionally inverse data points like the VIX– allowing traders to quickly assess overall market sentiment and make more informed trading decisions.
Key Features:
Heatmap Visualization:
Dynamic Table:
Located in the bottom right corner, this table displays real-time percentages of indices that are bullish and bearish. Example: If 4 out of 6 index data points are bullish, the table will show 66.6% bullish and 33.3% bearish.
Best Used For:
Key Features:
- Sentiment Heatmap: Displays a color-coded heatmap for indices, with green indicating bullish sentiment and red indicating bearish sentiment. Each index’s sentiment is calculated on a scale from 0 to 100, with 50 as the neutral point.
- Bullish/Bearish Percentages: Real-time calculations of the percentage of indices in bullish or bearish territory are displayed in a dynamic table for easy reference.
- Tracks Major Indices: Monitors popular indices or their related futures contracts with the option to include custom tickers.
- Inverse Sentiment Options: Allows users to invert sentiment calculations for specific symbols (e.g., VIX or DXY) to reflect their inverse relationship to broader market trends.
- Customizable Moving Averages: Choose from SMA, EMA, WMA, or DEMA to tailor the trend calculation to your trading strategy.
- Overlay Sentiment Colors on Candles: Option to display sentiment as green (bullish) or red (bearish) directly on price chart candles, enhancing market trend visibility.
Heatmap Visualization:
- The heatmap assigns each index a sentiment score based on its calculated average.
- Sentiment values above the 50 midline indicate bullish sentiment, while those below 50 indicate bearish sentiment.
Dynamic Table:
Located in the bottom right corner, this table displays real-time percentages of indices that are bullish and bearish. Example: If 4 out of 6 index data points are bullish, the table will show 66.6% bullish and 33.3% bearish.
Best Used For:
- Intraday Traders: Assess real-time index sentiment during active market hours to make data-driven trading decisions.
- Swing Traders: Monitor index trends over time to identify shifts in market sentiment and positioning opportunities.
- Market Breadth Analysis: Identify broader market strength or weakness by analyzing multiple indices simultaneously.
Notas de Lançamento
Updated Chart Issue.Notas de Lançamento
Fixed small display bug.Script protegido
Esse script é publicada como código fechado. No entanto, você pode gerenciar suas escolhas de bate-papo. Por favor, abra suas Configurações do perfil
Aviso legal
As informações e publicações não se destinam a ser, e não constituem, conselhos ou recomendações financeiras, de investimento, comerciais ou de outro tipo fornecidos ou endossados pela TradingView. Leia mais nos Termos de Uso.
Script protegido
Esse script é publicada como código fechado. No entanto, você pode gerenciar suas escolhas de bate-papo. Por favor, abra suas Configurações do perfil
Aviso legal
As informações e publicações não se destinam a ser, e não constituem, conselhos ou recomendações financeiras, de investimento, comerciais ou de outro tipo fornecidos ou endossados pela TradingView. Leia mais nos Termos de Uso.